ABSTRACT. Website traffic varies through time in consistent and predictable ways, with highest traffic in the middle of
Optimizing Web Traffic via the Media Scheduling Problem Lars Backstrom∗
Jon Kleinberg†
Ravi Kumar
Dept. of Computer Science Cornell University Ithaca, NY 14853.
[email protected]
Dept. of Computer Science Cornell University Ithaca, NY 14853.
[email protected]
Yahoo! Research 701 First Ave. Sunnyvale, CA 94089.
[email protected]
ABSTRACT Website traffic varies through time in consistent and predictable ways, with highest traffic in the middle of the day. When providing media content to visitors, it is important to present repeat visitors with new content so that they keep coming back. In this paper we present an algorithm to balance the need to keep a website fresh with new content with the desire to present the best content to the most visitors at times of peak traffic. We formulate this as the media scheduling problem, where we attempt to maximize total clicks, given the overall traffic pattern and the time varying clickthrough rates of available media content. We present an efficient algorithm to perform this scheduling under certain conditions and apply this algorithm to real data obtained from server logs, showing evidence of significant improvements in traffic from our algorithmic schedules. Finally, we analyze the click data, presenting models for why and how the clickthrough rate for new content declines as it ages.
Categories and Subject Descriptors H.4.m [Information Systems]: Miscellaneous
Keywords User interaction, Media scheduling, Human response
1.
INTRODUCTION
Many websites have featured items placed prominently on their web pages. News sites have featured news stories, content sharing sites (like Flickr and YouTube) have featured media, and on-line stores have featured products. The exact business goals of these sites vary, but in general these items are placed in featured locations with the expectation that a large fraction of visitors will examine them. For a news site, the featured article is typically a story that many people will be interested in, and one metric of success ∗ Part of the work done while the author was visiting Yahoo! Research. † Supported in part by NSF grants CCF-0325453, CNS-0403340, BCS-0537606, and IIS-0705774, and by funding from Google, Yahoo!, and the John D. and Catherine T. MacArthur Foundation.
Permission to make digital or hard copies of all or part of this work for personal or classroom use is granted without fee provided that copies are not made or distributed for profit or commercial advantage and that copies bear this notice and the full citation on the first page. To copy otherwise, to republish, to post on servers or to redistribute to lists, requires prior specific permission and/or a fee. Copyright 200X ACM X-XXXXX-XX-X/XX/XX ...$5.00.
that can be used by a news site when evaluating its selection of featured articles is the total number of clicks. A news site that does a good job of delivering the news that is interesting to most people will have a large number of overall clicks. Similarly, a contentsharing site would like to present high-quality content in featured spots. An on-line store might have slightly different goals in selecting featured products: they might select high-margin rather than popular items, for instance. In all of these cases, the website operator sees some value in having the featured items appear prominently and receiving user attention. Some utility is gained for each impression of the featured item. The visitor may think more highly of the website the featured item is placed on, or be inspired to follow a link to another page, or even buy a product. In this work, we will consider the value of an impression to be represented by the probability of a user clicking on that featured item, but other tasks, such as maximizing total sales or total profit can be considered within our framework as well. The media scheduling problem. There is thus an underlying content scheduling problem that is central to the choice of featured items on all such sites. However, this scheduling problem has remained essentially implicit and unexamined in the literature, despite its role in determining the clickthrough rates for content that is in some cases viewed by hundreds of millions of individuals. In this paper we provide a formulation of this problem in terms of a few underlying parameters that can be reliably inferred from a site’s log data; and by formulating the problem precisely, we are able to develop algorithms that improve significantly on current practice. While the problem in its most general form is intractable, we provide efficient algorithms for a special case that closely approximates data from real user traffic. We then evaluate our algorithm on trace data from the front page of Yahoo! (the most visited Web site in the world), showing how to improve the estimated clickthrough rate on featured articles by over 25% relative to the human-intensive strategies that are currently employed. We now give an overview of the problem, before formally specifying it in the next section. The operator of a website has a pool of potential items that can be featured on the front page over the course of a day. We assume this pool is known at the start of the day: this is appropriate for most applications, including advertising, general-interest news features as on the Yahoo! front page, highlighted videos and photos as on the YouTube and Flickr front pages, and a number of other typical settings.1 User interest in a single featured item decays over time as it re1 The main setting in which it is less appropriate is in the handling of breaking news, which can come unexpectedly and is timecritical. In the final section we discuss some interesting directions for future research based on adapting our model to this setting.
mains on a site; this is largely due to the fact that the user population viewing it will increasingly consist of repeat visitors who have seen it linked from the front page already. Thus, as we show in Section 3, user interest in a featured item can be characterized by two parameters: a peak interest level, which is the probability of a user clicking on the item when it is first presented; and a decay function, which is the item-specific rate over time at which this click probability decreases while the item is being featured. Moreover, these parameters can be quickly estimated using bucket tests on a small subset of the full user population. In Section 3 we show that the website operator can also reliably estimate a final important parameter in the formulation of the problem: the user traffic per minute over the course of a day. We thus have the following media scheduling problem, which will be the focus of the paper: given the estimated time series of user traffic for the day, and a pool of potential items to be featured — each with its own peak interest level and decay function — determine an order in which to feature items, and a length of time that each should be featured. This formulation of the problem captures some of the fundamental trade-offs at work in scheduling items for high-volume sites. In particular if we always present the best item, repeat visitors will have no opportunity to see other items, and the value per impression will decrease as more and more of the impressions are from repeat visitors. If we change the items too often, we will not extract maximum value from the best items, as low quality items will often fill the featured spot. Our results for media scheduling. Since the general version of the problem is NP-hard, we seek tractable cases that approximate real traffic data. This is challenging, since not only does user traffic vary considerably over a day and peak interest vary considerably from one item to another — even the decay functions of different items can have quite different shapes. Using full traffic data from the Yahoo! front page, however, we are able to identify a crucial phenomenon in the data that leads to a tractable formulation: the decay functions for different items can all be approximately fit to (different) segments of a single “universal” curve. We then show that for any instance of the media scheduling in which decay functions all form segments of a single curve, and in which traffic over the course of a day is unimodal (or bimodal), the media scheduling problem can be solved efficiently. When these properties hold to within some approximation bound — as they do in our case, with small error — our algorithm provides the same approximation guarantee to the optimum schedule. We evaluate the algorithm in comparison both to simpler baselines and to the way content is actually scheduled on the Yahoo! home page, showing significant gains in total clicks. Thus, this is a case where the analysis of a large volume of data, and the identification of regular structure in it, feeds directly into algorithm design (and corresponding performance improvements) for a large-scale application. The problem formulation, as argued above, is general enough to apply to a wide range of high-traffic sites. We believe that our observations about the data will be useful in the context of many other sites as well, since they are aggregates of hundreds of millions of visitors and do not appear to depend on any idiosyncrasies of Yahoo!’s content presentation. With this in mind, we explore the structure of the traffic data in detail, identifying principles about clickthroughs and decay rates, as well as a simple generative model that explains some of the fundamental patterns that we see. Organization. The remainder of the paper is organized as follows. In Section 2 we will formally define the media scheduling problem. In Section 3 we will examine some data from yahoo.com, which
gives us insights into the details of daily traffic, declining clickthrough rates, and variable article quality. Section 4 will present an exponential algorithm which is optimal under all conditions, and a polynomial algorithm which gives optimal results under the conditions discussed above, which are approximately met by our data. In Section 5 we will look at the performance of these algorithms and compare them to the performance of the manual scheduling that actually occurred. Finally, in Section 6, we will look in more depth at the user behavior which gives rise to the phenomena we observe, with particular focus on why the clickthrough rate declines in the way it does.
2.
SCHEDULING PROBLEM
We now formalize the media scheduling problem. We have N items that we could potentially place in the featured location. Each item has an associated value function fi (t), which specifies the utility of a visiting user seeing item i after it has been on the front page for t minutes. In our applications, we will think of fi (t) as giving the probability each user clicks on the item, when visiting the page t minutes after the item’s first appearance. However, in general, fi (t) can be any measure of utility per visitor and the formulation remains the same. Based on traffic patterns from previous days, we also know with high accuracy how many people will show up to the front page each minute of the day: aτ at minute τ . Our goal is to determine which subset of the items to use, when to place them, and for how long, in order to maximize the total value over the course of the day. Thus, the problem is to assign non-overlapping intervals [Si , Ti ) to each item i, where the expected number of clicks on item i at time τ ∈ [Si , Ti ) is aτ fi (τ − Si ). (This choice includes selecting a subset of the items to show, since we can choose not to use an item P P i by setting Si = Ti .) Our goal is to maximize i Tτ =S aτ fi (τ − i Si ). Recall that we are considering applications in which each piece of content can be shown at any point during the day. Also, the fact that each item has a function fi (t) indicates that the value per visitor is assumed to be independent of the time of day.2 Additionally, we are constrained to put each item up for at most one contiguous interval: once it is replaced, it cannot return. This is consistent with practice on most of the websites we consider, where human editors tend not to bring back a featured item later, since it creates for the user population an unwanted impression of non-fresh, recycled content on the site.
3.
DATA AND TEMPORAL PATTERNS
To optimize the media scheduling problem effectively, we need to be able to predict the overall traffic (aτ ) and item clickthrough rates (fi (t)) ahead of time. To illustrate the feasibility of estimating such data effectively, we examine the server logs for the front page of Yahoo! Figure 1 gives an example showing the typical placement and positioning of the featured articles which we examine on the Yahoo! front page. (“Best and worst French fries” was the article being featured at the time this image was captured.) Over the course of three weeks (starting May 1, 2008), we recorded the number of 2
An interesting extension is to explicitly consider the fact that some content may be more appealing to typical visitors at, say 6 AM, than at 6 PM. We do not have indications that this is a strong effect for the kinds of applications (i.e. general-interest Yahoo! news items) where we have data for analysis; but there are certainly settings where this can be an effect. We indicate it as a direction for future work.
Figure 1: A screenshot of the Yahoo! front page showing the placement of the featured article: “Best and worst French fries.” Figure 3: An alignment of all clickthrough rate curves to a single universal curve. The red region of the plot shows that almost all of the data fits to within a 10% window around a single curve.
Figure 2: The number of page views of yahoo.com over the course of three consecutive weeks in Nov/Dec 2008. Note, that with the exception of a small glitch (likely cause by a logging error or server failure) the traffic is very consistent over the three weeks. front page views and the number of article clicks at a 1-minute resolution. Using this data, we are able to ascertain the clickthrough rate for an article after it has been featured on the website for some number of minutes. In this study we will only consider articles that were featured for at least 20 minutes between the hours of 3AM and 8PM Pacific time. This gave us a total of 337 featured articles, for an average of about 16 per day. While our algorithm could have used all articles (not just those shown for at least 20 minutes) and could have scheduled the full 24-hour day, the optimal algorithm to which we compare starts to become prohibitively slow as the number of articles exceeds 20. Hence we imposed these restrictions, both for our algorithm and competing approaches, to allow comparison to the optimum without removing very many high-quality articles, or high traffic times of day. Figure 2 shows the total number of views of yahoo.com as a function of time for three weeks. Over these three weeks, the view curves are almost identical — e.g., 4:53 on one Wednesday has about the same number of views as 4:53 on another Wednesday. This illustrates the predictability of traffic on most days: during regular weeks, the traffic pattern is almost identical from one week to the next. We note that on some days, particularly holidays, the traffic does not conform to the typical pattern.3 3
To predict the traffic on holidays, we would have to use a slightly
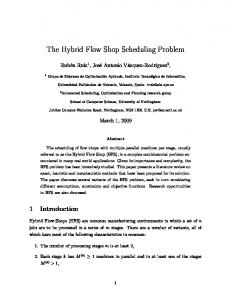
Predicting the time-varying clickthrough rates of media content is a harder task. However, we can use bucket testing to get a good approximation of this. By presenting a small fraction of the visitors to our site with a particular piece of content, we can get a good approximation of how popular that piece of content will be when presented to the entire population. Once we have learned the initial popularity of an article, the future popularity will follow a predictable decay. (See [1] for more sophisticated statistical models for predicting clickthrough rates in the context of content recommendation.) Crucially for our analysis, we find that these articles not only follow predictable decay curves, but they can all be approximately realized as different segments of a single universal curve, as illustrated in Figure 3. That is, there is a single curve g(t), so that each item’s clickthrough function fi (t) can be written as fi (t) = g(t + σi ) for an item-specific offset σi . Thus, when learning the parameters for an article i, we need only use bucket testing to learn the appropriate starting point σi along this single curve. If, for instance, we find that the initial clickthrough rate (when the article is first featured) is 5%, we can find the point along this single curve corresponding to a clickthrough rate of 5%. We find that this corresponds to some x = T on the plot in Figure 3. Once we know this offset, we can compute that the clickthrough rate after the article has been up for 20 minutes will correspond to T + 20 in Figure 3. Thus with only the initial rate, we can accurately predict the clickthrough rates we will achieve when placing this article in a featured position for any length of time. In our data, we observe that all articles can be aligned to a single monotonically decreasing function such that the average relative error is only 3.2%. A natural worry is that with only a few hundred articles in our dataset, we are overfitting the data and cannot, in reality, predict fi (t) for all t from the first few minutes of data and a small sample population. To show that this is not the case, we also fit the data to a simple exponential decay curve. While each article has its own starting point, there is only one universal parameter to this function: the decay parameter λ. We find that the best fit is when λ = −0.0044, indicating that the clickthrough rate typically declines by 0.44% per minute in our data. While this fit is not as good as the previous one (it can’t be since only the constraint on the previous curve was that it be decreasing) it still gives an average more sophisticated model, perhaps looking back a year to that day last year, or perhaps estimating from similar holidays.
the bin-packing problem to items whose clickthrough rates are 1 up to time equal to the length of the corresponding bin-packing item, and 0 thereafter, optimal clicks can be achieved if and only if the original bin-packing problem is solvable.
Fits of a single article
Click-Through Rate
Actual Data Best fit power lay decay Best fit linear decay Best fit exponential decay
Optimal Algorithm. A naive algorithm would have to consider N ! different permutations of the items, and even then it would still have to determine the interval lengths for each one. This would make it infeasible to solve instances even of size 15. Using a more sophisticated algorithm considerably improves the exponential behavior of the search for the optimum. 0
50
100
150
200
250
Minutes
Figure 4: A fit of three functions to the single longest running article in our dataset. The exponential decay curve is clearly the best, and while the linear curve isn’t too far enough, it will certainly continue to deviate more and more from reality since it will eventually become negative. relative error of only 4.6%. Figure 4 shows the fit of this exponential decay for the single article which appears for the longest interval in our data. While it does not fit quite as well as one might hope, it is a good approximation, and is significantly better than another simple alternative: a power law decay. For comparison, the average relative error of the exponential fit is 4.1%, while the power-law and linear fits have mean relative error 13.1% and 8.2%, and the best constant function with fixed y-value would have average relative error of 30.3%. In other words, these clickthrough rates change significantly over time, and while an exponential decay is not perfect, it gives a close approximation, better than other comparably simple functions. In Section 6 we will investigate the declining clickthrough rate in greater detail and offer an explanation for this phenomenon. For now, however, it suffices to observe that the functions fi (t) are reasonably predictable, and can all be approximately aligned to segments of one common curve.
4.
ALGORITHMS
In this section, we describe the development of our algorithms. As a preliminary step, we show that the general problem is NPhard, but that even in general, there is an exponential algorithm that improves significantly over brute-force search (making it possible to find optimal solutions for N around 20-30 rather than 10). As our main focus, we then show how to solve the problem in polynomial time when the functions fi (t) can all be aligned to segments of a single universal curve — as we observed for our data in the previous section — and when the user traffic is unimodal (or Kmodal for any fixed K) over the course of the day. When these conditions are approximately met, our algorithm here produces a corresponding approximation guarantee to the optimum.
4.1
Preliminaries
NP-Hardness T HEOREM 1. The general media scheduling problem is NPhard. P ROOF S KETCH . A reduction from bin-packing gives K disjoint intervals where traffic is 1 and the interval lengths are equal to the bin size. These intervals with traffic 1 are separated by intervals of the same size with zero traffic. We reduce the items in
T HEOREM 2. The optimal solution for any traffic pattern a and any functions fi can be found in time O(T 2 N 2N ) where T is the total time, and N is the number of media items in the set of all available items. P ROOF. An algorithm using dynamic programming can achieve this bound. For each t ≤ T and each subset S of items, the algorithm computes the optimal scheduling for the first t minutes of the day, using only the items in S. To do this, we note that the optimal scheduling for some choice of t and some subset S places a particular item last for some time interval from t − u to t. Call this item i. Then, the value of the optimal scheduling for this choice of i and S is opt(t − u, S \ {i}) + value(t − u, t, i), where value(a, b, i) is the value of placing item i in the interval [a, b) and can easily be precomputed. Of course, we do not know which u and i to use ahead of time, but by searching over all choices of u and i, we can find opt(t, S). There are O(T 2N ) choices for t and S, and computing each one requires searching over O(T N ) choices for u and i. Multiplying these together gives us the runtime stated.
4.2
Our Algorithm
As we observed in Section 3, the clickthrough rates for all the items can, to a close approximation, be aligned to a single curve. Formally, if the clickthrough rate for item i after t minutes is given by fi (t), we can say that there is some universal, monotonically decreasing function g(t) such that fi (t) = g(t + σi ) for some σi . Furthermore, as shown in Figure 2, the traffic rate over the course of a single day is approximately unimodal: it increases in the mornings, peaks, and then decreases in the afternoons. (It is even closer to being bimodal, with a dip at midday, and we can handle this as well.) The crucial building block in handling unimodal traffic (or K-modal traffic for fixed K) is to understand the problem when traffic is monotonically increasing or decreasing. We do this first, via the following two lemmas. L EMMA 3. If the traffic is monotonically increasing, then an optimal ordering of items is given by decreasing σi , i.e., putting worse items earlier. P ROOF. Suppose there were an optimal ordering where item i comes immediately before item j in the optimal ordering, but σi < σj , in contrast to the statement of our lemma. We will show how this leads to a contradiction. Without loss of generality, we will assume that σi = 0. This optimal solution presents item i for σj + δ minutes, followed by item j for γ minutes. An optimal solution must have δ ≥ 0, since if δ < 0, then fi (σj + δ) < fi (σj ) = g(σj ) = fj (0). In other words, if δ < 0, then fi at the end of item i’s interval would be greater than fj at the beginning of item j’s interval, and we could do better by extending item i and starting item j a little bit later. We now consider what would happen if we swapped the order of the two items, presenting item j first for time δ and item i for time σj + γ. This is illustrated in Figure 5.
(strictly better if the monotone functions are strict) from reordering items i and j. Case 2: σj ≥ δ. The analysis here is similar except we collect terms by g instead of a. The loss for clickthrough rates between g(σj ) and g(σj + δ) can be written as Z σj Z σj +δ (ax+δ − ax ) dx. g(x)(ax − ax−σj ) dx ≤ g(σj ) 0
σj
The gain for clickthrough rates between g(0) and g(σj ), on the other hand, is Z σj Z σj (ax+δ − ax ) dx. g(x)(ax+δ − ax ) dx > g(σj ) 0
0
Figure 5: Illustration of the proof of Lemma 3. If we have a situation where the ‘better’ (blue) item is placed earlier, we can swap the two items as illustrated here. After this swap, the clickthrough rate remains unchanged in the last γ, while it drops in the lower traffic region from 0 to δ, and rises in the higher traffic region from δ to δ + σj .
These two items span a total time of δ + σj + γ. When item i came first, the total clicks were Z
σj +δ
Z
σj +δ+γ
ax fj (x − σj − δ) dx.
ax fi (x) dx + 0
σj +δ
When we perform the swap suggested above, the total clicks become δ
Z
Z
σj +δ+γ
ax fi (x − δ) dx.
ax fj (x) dx + 0
δ
For time greater than σj + δ, the total click contribution is unchanged. In this interval, the optimal ordering had a clickthrough rate of fj (x − σj − δ) = g(x − δ), while our swap gives a clickthrough rate of fi (x−δ) = g(x−δ) — the same. We now consider two cases: Case 1: σj < δ. Loss Because of the swap we make from the optimal solution, the clickthrough rate decreases in the interval from 0 to δ as fj (x) = g(x + σj ) < g(x) = fi (x). The decrease in this region can be written as Z δ Z δ ax (fi (x) − fj (x)) dx = ax (g(x) − g(x + σj )) dx. 0
0
Because a is monotonically increasing and g is monotonically deRδ creasing we can bound this loss in clicks by aδ 0 g(x) − g(x + σj )Rdx. Because σj < δ this telescopes and can be rewritten as σ aδ 0 j g(x) − g(x + δ). Gain. On the other hand, in the interval from δ to σj +δ, the clickthrough rate increases, as fi (x − δ) > fi (x). Here, the total gain R σ +δ we get is δ j ax (fi (x − δ) − fi (x)) dx. Since a is increasing, this is at least Z σj +δ Z σj (fi (x − δ) − fi (x)) dx = aδ (g(x) − g(x + δ)) dx. aδ δ
0
Thus, the loss in clicks in the interval from 0 to δ is at least offset by the gain we achieve in the interval from δ to σj + δ when we make the swap from the optimal ordering, and we do no worse
As before, the gain from the swap is at least as large as the loss. L EMMA 4. If the traffic is monotonically decreasing, then an optimal ordering of items is given by increasing σi , i.e., putting better items earlier. P ROOF. While this seems similar to the case in Lemma 3, we note that it is more than just a case of changing the signs and performing the same analysis. In the previous case, the traffic was increasing through time, while the clickthrough rate was decreasing. In this case, however, the traffic is decreasing as well as the clickthrough rate. Thus, while similar, the analysis ends up being a bit different, and hence this lemma needs an argument separate from Lemma 3. Consider an optimal ordering where this is not the case: item j proceeds item i, but σj > σi . As in the proof of the previous lemma, we will show how this leads to a contradiction. Without loss of generality we will assume that σi = 0. We will denote the length of the interval for item i as σj + δ and the length of the interval for item j as γ. If we find that δ < 0 here, we decrease σj to the point where δ = 0. This would only increase the quality of the optimal scheduling. However, in the rearrangement below, we will show that we can get no worse performance by presenting item j for time δ. Thus, an optimal ordering would never have δ < 0 and we will henceforth assume δ ≥ 0. We consider swapping the ordering of i and j, presenting i first for σj + γ and then presenting j for δ. The clickthrough rate is unchanged beyond σj + γ, so we need only worry about the region before that. The optimal ordering achieved Z γ Z γ+σj ax g(x + σj ) + ax g(x − γ) dx. 0
γ
When we perform the change mentioned above, the value in this region becomes Z γ+σj ax g(x) dx. 0
R γ+σ The value we lose in the region from γ to γ +σj is γ j ax (g(x− γ)−g(x)) R γdx. However, this is offset by the gain in the region from 0 to γ of 0 ax (g(x)−g(x+σj ) dx. Again, the proof breaks down into two cases. Case 1: σj < γ. Here the loss can be rewritten as Z σj Z σj ax (g(x − γ) − g(x)) dx ≤ aγ (g(x) − g(x + γ)) dx. 0
0
The gain can be rewritten as Z γ ax (g(x) − g(x + σj ) dx ≥ 0
γ
Z
σj
Z
(g(x) − g(x + γ) dx.
(g(x) − g(x + σj ) dx = aγ
aγ
0
0
Thus, the gain always exceeds the loss. Case 2: σj ≥ γ. Here the loss can be rewritten as Z σj ax (g(x − γ) − g(x)) dx ≤ 0 σj
Z
γ
Z
(g(x) − g(x + σj )) dx.
(g(x) − g(x + γ)) dx = aγ
aγ 0
0
The gain can be rewritten as Z γ Z γ (g(x) − g(x + σj ) dx. ax (g(x) − g(x + σj ) dx ≥ aγ 0
0
Again, the gain always exceeds the loss. Thus, in the case where the function g exists and traffic is monotone, we can easily determine the ordering. Once the ordering is fixed (and using discrete time intervals) we can use dynamic programming to solve the scheduling problem. If the total time is T and there are N items to schedule, we find the optimal scheduling for the first t ≤ T time and the first n ≤ N items, when they are ordered as in Lemma 3 and Lemma 4. If this optimal schedule has value opt(t, n) we find it by finding t0 such that opt(t0 , n − 1) + value(t0 , t, n) is maximized. It is important to note that we do not need to actually know the values of g(·) and σ for the algorithm to work. As long as they do exist and we can order the items according to σ, the actual values are unimportant to the running of the algorithm. In the unimodal case, things are a bit more complicated. If we knew how to straddle the peak, and which side of the peak to put the items on, we could then schedule the increasing and decreasing parts independently. Of course there are exponentially many ways to divide the items into two groups, so a naive approach won’t work. However, with a more careful approach, we show T HEOREM 5. When traffic is unimodal, we can find the optimal scheduling in polynomial time. P ROOF. First note that Lemma 3 and Lemma 4 tell us nothing about the item that straddles the peak, but they show that the items on either side are ordered by σ with smaller values closer to the peak. Thus, the item with largest σ, which we will denote item n, is either the first item in the entire sequence, or the last. This suggests a dynamic programming recurrence for computing the optimal ordering. We will denote the optimal value for the interval [a, b) using the first n items by opt(a, b, n). There are two cases now. If item n comes last, then opt(a, b, n) = opt(a, t, n − 1) + value(t, b, n), for some a ≤ t ≤ b, while if item n come first opt(a, b, n) = opt(t, b, n − 1) + value(a, t, n), for some a ≤ t ≤ b. This recurrence omits the base case where an item straddles the peak. However, we can run the algorithm N times, trying each item for each straddling interval as the base case, and removing that item from the set to be scheduled to the sides. Each of the N times this takes time O(N T 3 ), so trying all N takes O(N 2 T 3 ). Extending the algorithm to bimodal and K-modal cases. This algorithm can be generalized to the case where we have two peaks instead of one. In this case, we must first start be picking the items that straddle the two maxima and the minima between them. Once this is done we can compute the optimal in a similar manner. We find that opt(t1 , t2 , t3 , t4 , n) is the optimal value when the first
n items (where three have already been removed for minima and maxima) have been assigned and the intervals [t1 , t2 ) and [t3 , t4 ) are covered. Using a recurrence analogous to that for the unimodal piece, we try all four possible locations for the n-th item: to the left of the first peak, to the right of the first peak, to the left of the second peak, to the right of the second peak. Finally, we search over all opt(0, t2 , t3 , T, N − 3) and for each one we fill in the interval [t2 , t3 ) with the item we held out for the minima, picking the schedule with the highest value. There are O(N 3 ) ways to pick the items for the minima and maxima, and once we have picked them, we have to find the value of opt(·) for O(N T 4 ) configurations, which takes time O(N T 5 ). Putting this together, we get O(N 4 T 5 ). We can further extend this algorithm to the multimodal case, first fixing the items that straddle the peaks and valleys, and then running a dynamic programming algorithm analogous to that for two peaks. If there are K peaks, there are 2K − 1 peaks and valleys, and so we need to select out items to straddle these. Once those are selected, we must compute the optimal schedule for each set of intervals [a1 , b1 ), [a2 , b2 ), . . . , [aK , bK ), where the intervals do not overlap and [ai , bi ) straddles peak i. In the worst case, this gives us a runtime of O(T 2K+1 N 2K K −2K ).
4.3
Performance when conditions not met
Even when the exact conditions of unimodality and fi (x) = g(x + σi ) are not precisely met, the dynamic programming algorithm still gives a valid solution to the scheduling problem. In fact, if we find an ordering based on an approximation of σ and that ordering is close enough that it matches the optimal ordering, the dynamic programming algorithm will still choose the correct interval lengths. But, in the case where the ordering is wrong, we can still bound the error in our result by the degree to which the actual data deviates from our assumptions. Given the actual data, we can find a unimodal traffic function such that the actual traffic is higher than the unimodal function, but exceeds it by at most a factor of α. Similarly, we can find a function g and values of σi such that g(x + σi ) ≤ fi (x) ≤ βg(x + σi ). Any scheduling for the original problem gives no more clicks than a factor of αβ times the version meeting our conditions. Since we solve that version optimally, our algorithm gives a schedule that is within a factor of αβ optimal. Figure 2 shows that the unimodality constraint is roughly met in our data, while Section 3 showed that all clickthrough rate functions could be aligned fairly well. In the next section we will see how close our algorithm comes to the optimal ordering on this real data.
5.
EXPERIMENTS
We start with the raw clickthrough rates for each of the articles in our dataset. For each article, we approximate the clickthrough rate function after presenting the article for t minutes as fi (t) = e−λ(t+σi ) , where λ is a global decay parameter common to all articles and σi measures each article’s inherent popularity as it is offset in time. To estimate λ, we picked the value that minimized the overall squared error (summed over all articles). In our dataset, we find λ = 0.0044, indicating that on average the clickthrough rate of an article declines by about 0.44% each minute. To simulate our scheduling algorithm for a given day, we start by extracting the clickthrough rate data for each article actually used by Yahoo! that day. From this, we fit fi (t) by finding the best σi . We cannot simply use the true clickthrough rates because we only have that data for the time before the article was replaced on the site — using the fitted version allows us to simulate placing the ar-
Distribution of Number of Home Page Visits Rate Distribution Power Law with Exponent -1.5
Views
Log(Count)
Click-Through Rate
Views Our Algorithm Optimal Scheduling
1
10
100
1000
Visits
0
100
200
300
400
500
600
700
800
Figure 7: The distribution of visit rates to yahoo.com.
900
Minutes
Figure 6: This figure shows our scheduling and the optimal scheduling for one particular day. Because the page views are not quite unimodal, our ordering is not quite optimal. It is close enough that the fraction lost is only 3.3E-5 though. For comparison, our baseline method does 2.2% worse, and we estimate a 26% improvement over the ordering that was used.
Day 1 2 3 4 5 6 7 8 9 10 11 12 13 14 15 16 17 18 19 20 21 Avg
Percent Improvement Over Actual Over Baseline 26.0 2.2 12.1 3.1 66.9 13.5 28.2 5.1 18.5 6.2 21.4 4.4 36.3 2.9 28.9 8.2 20.4 7.9 34.6 13.7 27.1 6.2 18.0 3.4 22.2 2.5 34.3 9.0 18.2 2.7 23.6 8.8 18.9 4.3 25.0 7.6 18.7 6.9 20.1 7.1 23.5 9.4 25.9 6.4
Table 1: The percent improvment of our algorithm over the actual data, and over the simpler baseline algorithm. On all days, our algorithm is within 0.1% of optimal.
ticles for arbitrary amounts of time. In addition to the clickthrough rates, we extract data about the number of front-page views at each minute of the day. As our analysis in Section 3 shows, while an application would not have these exact numbers, they can be estimated very reliably from traffic in other weeks. We know from Section 4 that our scheduling algorithm is optimal for this type of function, provided that the traffic is unimodal. The true traffic is close to unimodal, but this condition is not strictly met. Thus, in evaluating our algorithm on this real data, we will consider three questions. First, how close is our algorithm to optimal, given that the optimality conditions are not strictly met? Second, how much better do we expect to do compared to the scheduling that was used? Third, how much better is our algorithm than a simple baseline? The baseline algorithm we compare to sets all the article lengths so that their final clickthrough rates (before being replaced) are about the same (as close as possible given the 1-minute resolution). It then orders them by placing the best article in the middle, straddling the peak, the next best to the right, the next to the left, and so on, alternating sides of the peak. This problem is difficult enough that manual scheduling has fallen well short of optimality. First, our algorithm achieves 99.99% of the optimal algorithm, and is a 6.4% improvement over the simple baseline algorithm (with a daily maximum of a 13.7% improvement over the baseline). While this may seem modest, we should note that the number of daily visitors to the Yahoo! front page makes 6.5% a significant number. Finally, our algorithm gives a 25.9% improvement over the manual scheduling used at the time, a huge improvement. One possible concern when examining these results is that some of the articles may not have been available to the human editors at Yahoo! until roughly when they were first scheduled. (Though, as discussed in Section 1, these articles come from a class of applications where the content is not time-critical, so this is not necessarily a significant issue in reality.) To make sure that the improvements are not arising purely from the ability to shift content early, we run the optimal algorithm with one additional constraint: our algorithm may not schedule anything earlier than the first time it appeared on the Yahoo site. Even with this constraint, we still do 17.6% better, indicating that our improvement is not coming simply because we have the ability to shift articles earlier in the day.
6.
GENERATIVE MODELS
Now that we have seen how the traffic data can be used to inform the design of our algorithms, it is interesting to ask whether we can explain the structure of this traffic data — particularly, the
Declining Click-Through Rate for a Typical Article and Simulated CTR
Distribution of Interarrival Times for Front Page Visitors Power-Law with Exponential Cutoff (x-0.512 e-0.049 x)
Count
Click-Through Rate
Click-Through Rate Simulation Results
0
10
20
30
40
50
60
70
Minutes Since First Display
1
10 Minutes
100
Figure 8: The distribution of interarrival gaps. Click-Through Rate after K Views
Average CTR
Average CTR Power-Law Fit ~x^-0.75
1
10 Number of Views with Current Article Featured
Figure 9: The clickthrough rate declines as visitors repeated see the same featured item. functional shape of the declining clickthrough rates — from more basic assumptions. In particular, the declining clickthrough rates are clearly arising from the aggregate behavior of the user population, who differ in their rates of activity on the Yahoo! front page and their response to the content that is presented there. A natural question is whether the clickthrough functions over time can be approximately derived from a few simple parameters quantifying the variation within this user population. We show that this is indeed possible, suggesting some of the fundamental underlying mechansisms for the dependence of clickthrough rate on time. The first step towards understanding this data is to look at how often users return to the front page and how likely they are to view a story once they get there. Each individual user has his or her own visit rate for the Yahoo! home page. Naturally, some users visit much more frequently than others and this plays an important role in scheduling because we want to serve fresh content to the frequent visitors. (This is one of the inherent trade-offs in the scheduling problem, as discussed earlier: we need to keep frequent visitors interested, but we have to avoid delivering low-quality content in the interest of freshness.) By examining server logs, we can easily determining the distribution of return rates. Figure 7 shows the distribution of rates for all visitors to the Yahoo! home page over the course of one month. For the bulk of the distribution, we see that there is a good fit to a power law distribution with exponent −1.5. A user whose overall rate is λ will be expected to view the home
Figure 10: Here we put together the visit rate distribution, interarrival gap distribution, and probability of clicking an article as a function of times seen on home page. The figure above shows the actual clickthrough rates along with simulated clickthrough rates for one article and a corresponding set of model parameters.
page a number of times proportional to λ over the course of a fixed time interval. However, the distribution of these views is another factor we must consider when modeling users. While it would be simplest to posit an exponential distribution for the interarrival times between home page views, the data shows that this is not accurate. Instead, Figure 8 shows that the time between views to the home page while a single article is featured is distributed as a power law with exponent roughly 0.5 and an exponential cutoff. If we condition on a user’s rate, the graph changes for different values of λ, but fitted exponential-cutoff power laws have similar powers, and mostly vary in the exponential cutoff term, which is highly correlated to λ. Thus, we model a user with rate λ as someone who returns repeatedly by sampling interarrival times from a distribution proportional to x−0.5 exp(−xλ) (which has mean close to 1/λ). The final step towards modeling users is to examine how the probability of a user clicking on an article depends on the number of times they have been exposed to it. Naturally, a user is most likely to click on an article the first time they are given the opportunity. Each time a user returns to the home page, the probability decreases as the user becomes attenuated to the article. Again, we go to the data to see how this attenuation works. Figure 9 shows the decreasing click through rate for one article as a visitor sees it over and over again: a power law with exponent γ = −0.75. We note that only a user’s first click on a featured article is considered when computing the clickthrough rate. Subsequent clicks are disregarded. We now propose a model to combine the observed distributions. First, a user samples his or her overall rate λ from the power law rate distribution. Once this rate is sampled, the user starts generating arrival gaps, starting at time t0 = 0. To sample an arrival gap δi , a user samples δi from a power law distribution with exponential cutoff, where the cutoff parameter corresponds to the rate, setting ti = ti−1 +δi . For some interval [S, T ], a featured article is presented on the home page. For each S ≤ ti ≤ T a user considers clicking on the article according to the attenuation function and the article’s inherent interest. Thus, if an article has inherent interest K, and ti is the j-th time the user has been to the home page in the interval [S, T ], the probability that the user will click is Kj γ . The final caveat is that a user who has clicked on an article will never click a second time.
Figure 10 shows the result of simulating this model for the parameters we see in the data. For comparison, the actual clickthrough rate for a specific article is also shown. While the curves differ somewhat, we see that the overall effect is quite similar. The fact that the simulated curve is produced purely from a very small number of aggregate parameters about the user population suggests that the functional shape of the declining clickthrough rates is largely rooted in simple collective properties of the set of users.
7.
RELATED WORK
The related work falls into mainly three categories, namely, optimization and recommendation in online content-delivery systems, scheduling problems in the context of online user activities, and the dynamics of human response. Das et al. [4] considered the problem of real-time recommendation of news articles to users. Their focus was on the recommendation and personalization aspects to maximize readership. Agarwal et al. [1] studied the problem of selecting and serving articles to users in an online portal to maximize the clickthrough rate. They develop a general framework to incorporate aspects such as learning, explore-exploit strategies, and individual user characteristics. While closest to theirs in end goal, our approach differs in being combinatorial while theirs is statistical. There is rich literature on improving website organization to optimize user experience; see, for instance, [11]. Szabo and Huberman [12] investigate methods for predicting the popularity of online content from user access patterns; they show long term popularity can be measured by the popularity at an early time. Using this, Wu and Huberman [16] study the role of popularity and novelty of an article and its position on a webpage in determining the growth of collective attention to the article; see also [15]. They formulate a model based on novelty and popularity and use it to find an optimal ordering of news stories to be displayed on a web page so as to maximize the number of clicks in a finite horizon. Their concern is more about the spatial display of news articles (modeling factors such as novelty) whereas we are interested in a temporal ordering of items. Dasgupta et al. [5] considered a job scheduling problem that is motivated by web advertising. In this setting items (stories) arrive online, each with a length and per-unit value, and the goal is to pre-emptively schedule them to maximize the total time-discounted value. The main difference between their work and ours is offline vs online: our goal is to construct an offline schedule of items whereas their goal is to obtain an online schedule that is competitive against an offline optimum. For a detailed description of many job scheduling algorithms, we refer to [3, 9]. Barabasi [2] argued that the bursty nature of human behavior is caused by a decision-based queuing process, where tasks executions are priority-driven, with the timing of execution heavy-tailed; for further work, see [13, 14]. Johansen and Sornette [8] and subsequently Johansen [6] studied the response of online users to a “point-like” perturbation (e.g., publication of an online article) and showed that the download rate of the article is inverse polynomial. A similar observation was made between an email message and its reply [7]. Oliveira and Barabasi [10] show that the correspondence patterns of Darwin and Einstein is similar to today’s electronic correspondences. Our analysis of user return times and interest levels provides a further perspective on how response times vary across a very large population in different applications, in our case for the purpose of informing an underlying scheduling algorithm.
8.
CONCLUSIONS AND FUTURE WORK
We have formulated a general media scheduling problem, and shown how the types of data available at high-traffic websites makes it possible to develop algorithms that improve significantly on current practice in scheduling featured content. This problem is general enough that it can be applied to a wide variety of web sites. We have shown that real data is structured in a way that allows an efficient algorithm to schedule these items optimally. There are a number of directions for further work. One interesting issue, noted earlier, is that while we have focused on applications where the pool of available content is known at the start of the scheduling period (e.g. at the start of the day), there are other applications — such as presenting breaking news — that are inherently on-line, with limited or zero advance information about content until it is ready to be scheduled. Related to this is content that may be available somewhat in advance, but whose utility function fi (t) depends on when it is shown. We believe that the ideas developed in this paper provide a useful starting point for thinking about these further variations on the problem, and this is an interesting direction for future work.
9.
REFERENCES
[1] D. Agarwal, B. Chen, P. Elango, N. Motgi, S.-T. Park, R. Ramakrishnan, S. Roy, and J. Zachariah. Online models for content optimization. In Proc. 21st NIPS, 2008. [2] A.-L. Barabasi. The origin of bursts and heavy tails in human dynamics. Nature, 435:207–211, 2005. [3] P. Brucker. Scheduling Algorithms. Springer, 2007. [4] A. Das, M. Datar, A. Garg, and S. Rajaram. Google news personalization: Scalable online collaborative filtering. In Proc. 16th WWW, pages 271–280, 2007. [5] A. Dasgupta, A. Ghosh, H. Nazerzadeh, and P. Raghavan. Online story scheduling in web advertising. In Proc. 20th SODA, pages 1275–1284, 2009. [6] A. Johansen. Response time of internauts. Physica A, 296(3-4):539–546, 2000. [7] A. Johansen. Probing human response times. Physica A, 338(1-2):286–291, 2004. [8] A. Johansen and D. Sornette. Download relaxation dynamics in the WWW following newspaper publication of URL. Physica A, 276(1-2):338–345, 2000. [9] J. Y.-T. Leung, editor. Handbook of Scheduling: Algorithms, Models, and Peformance Analysis. Chapman & Hall, CRC, 2004. [10] J. G. Oliveira and A.-L. Barabasi. Human dynamics: Darwin and Einstein correspondence patterns. Nature, 437:1251, 2005. [11] R. Srikant and Y. Yang. Mining web logs to improve website organization. In Proc. 10th WWW, pages 430–437, 2001. [12] G. Szabó and B. A. Huberman. Predicting the popularity of online content. Technical Report abs/0811.0405, CoRR, 2008. [13] A. Vázquez. Exact results for the barabasic model of human dynamics. Phy. Rev. Let., 95:248701, 2005. [14] A. Vázquez, J. G. Oliveira, Z. Dezsö, K.-I. Goh, I. Kondor, and A.-L. Barabási. Modeling bursts and heavy tails in human dynamics. Phy. Rev. E, 73(6), 2006. [15] F. Wu and B. A. Huberman. Novelty and collective attention. PNAS, 104(45):17599–17601, 2007. [16] F. Wu and B. A. Huberman. Popularity, novelty, and attention. In Proc. 9th EC, pages 240–245, 2008.