The final publication is available at Springer via http://dx.doi.org/10.1007/s13278-012-0050-3
Overlapping Community Detection using a Community Optimized Graph Swarm Bradley S. Rees Department of Computer Science Florida Institute of Technology Melbourne, Florida, USA
Keith B. Gallagher Department of Computer Science Florida Institute of Technology Melbourne, Florida, USA
[email protected]
[email protected]
ABSTRACT Detection of communities within social networks is a nontrivial problem. Allowing communities to overlap – e.g. nodes can belong to more than one community simultaneously – further complicates the problem. Nevertheless, people do belong to multiple social groups simultaneously and being able to detect overlapping communities is an important step into being able to understand and analyze social networks. A common practice in community detection (clustering) is to view the network (graph) as a whole and have a central control process determine where and how nodes are clustered. That central control, we believe, is a limitation to performance. In our previous work, we showed that the individual’s view of his or hers social groups could be aggregated to produce communities. In this paper we propose a unique approach to community detection that combines the individual’s view of the community, not having the view the graph as a whole, with swarm intelligence as a means of removing the central control mechanism. Our approach offers a community detection solution that finds overlapping communities while running in O(n log2 n) time.
Keywords Community detection, community clustering, complex networks, social networks, swarm intelligence, multi-agent system. 1. INTRODUCTION Many types of real world systems can be represented as a complex network, where nodes represent agents (people, places, organizations, etc.) and edges represent the relationship between agents. Empirical studies of complex networks have shown that social networks, to a greater extent than other types (Girvan 2002; Newman 2003 Whitney 2010), tend to exhibit community structure (Fortunato 2010), or the clustering of nodes such that the internal density is higher than the between-cluster density. Additionally, social networks exhibit the small-world (Barabasi 2002; Buchanan 2003; Kleinberg 2000; Travers 1969), phenomenon, which postulates that any two nodes are separated by a small path length. Algorithms for community detection, also called community clustering, within social networks have garnered significant interest in the past decade (Baumes et al. 2005; Clauset 2005; Davis 2008; Der ́enyi 2005; Donetti 2004; Du 2007; Gregory 2007; Lancichinetti 2008; Newman 2003). The focus of community detection has shifted away from the traditional cluster problem of grouping objects with common attributes to one where the interactions and relationships between the objects are of importance (Getoor 2005). This shift has caused the network to be viewed as a graph. Hierarchical clustering techniques appear to give good results, and significant progress has been made to improve performance (Clauset 2004; Wakita 2007). However, hierarchical approaches suffer by requiring the graph to be analyzed as a single unit. A divisive algorithm based upon edge-betweenness centrality (Girvan 2002; Radicchi 20040, for example, requires that a centrality score be computed for each edge in the graph and then the edge with the highest centrality score, across the whole graph, selected for deletion. That global view, centralized control, we argue, is a significant performance and scalability bottleneck. To
1
The final publication is available at Springer via http://dx.doi.org/10.1007/s13278-012-0050-3
solve that problem we turn to the field of Swarm Intelligence and the decentralized control and selforganizational features it offers. In this paper we present a dramatically different approach to community detection that identifies communities by allowing the individual nodes to negotiate with its neighbors to determine community membership. Furthermore, this approach allows nodes to belong to multiple overlapping communities. The final community grouping is obtained by simply asking each node for a list of communities it belongs to. The contributions of the paper are: •
A full-fledged implementation of the Community Optimized Graph Swarm (COGS) algorithm
•
An algorithm producing communities with maximal size by allowing for overlap
•
An algorithm that is swarm-based, multi-agent, that can be distributed easily
•
An algorithm which can be converted to run within a database
•
An algorithm which runs in O(n log2n ) time.
2. BACKGROUND AND RELATED WORK This work brings together concepts from a number of disciplines, from Graph Theory (Mathematics) and Social Network Analysis (Social Science) to Data Mining and Swarm Intelligence (Computer Science). Each of those fields has their own taxonomy and argot. For the purpose of this paper we apply the terms node, vertex, and agent interchangeably. 2.1 Graph Terminology A graph (Chartrand 1985) is defined as G = {V, E} where V is a set of vertices (nodes) and E is a set of edges, represented by unordered pairs of vertices, called the start node and end node. The edge set defines connections between pairs of vertices. An optional weighting can be assigned to the pair. If the pairs are ordered, the graph is directed. The neighbors of a vertex, v, is defined as the set of vertexes connected by way of an edge to vertex v, or N(v) = {U}, where v ∈V and ∀u ∈U ∃ edge(v,u) . The degree of a vertex, δ(v), is the number of edges incident to that vertex. The density of a graph, or subgraph, is the measure of the number of edges in the graph, over the maximum number of possible edges. A value of 1 indicates that all possible edges are present, while a value of 0 indicates the absence of any edges. Centrality (Freeman 1979) is a measure of how central a node or edge is in relation to the entire graph. The betweenness centrality of a node, n, is number of shortest paths that contain n in the all-pairs-shortest-path set of the graph. Betweenness centrality can also be obtained for edges (Girvan 2002). The term egonet (Freeman 1982; Everett 2005) derives from egocentric network. An egonet is an induced subgraph consisting of a central node, the ego-node, its neighbors, and all edges among the neighbors. The individual’s viewpoint reduces the network under consideration to just those vertices adjacent to the central ego-node and any edges between those nodes. A dyad is two nodes joined by an edge. A triad is three nodes connected by a minimum of two edges and a maximum of three edges. A sparse graph is one where the number of edges is close to the number of nodes, and a dense graph is one where the density measurement approaches, or is equal to, 1. There is no agreed upon threshold between a sparse graph and a dense graph. All graphs in this work are considered to be sparse, unweighted, undirected, and containing no loops. For this work, we define sparse as being graphs with density less than 0.4. 2.2 Graph-Based Approaches A popular technique for community detection is hierarchical clustering (Fortunato 2010), an approach that derives its name from its function of building a hierarchy of clusters, represented as a dendrogram. The process generally takes one of two classes, agglomerative clustering (bottom-up) or divisive clustering (top-down). Agglomerative clustering begins with every node in its own cluster and then iteratively merges clusters by adding back in edges based on a quality measure. Divisive clustering follows a similar
2
The final publication is available at Springer via http://dx.doi.org/10.1007/s13278-012-0050-3
process but starts with a single cluster, the base graph, and methodically removes edges, breaking the graph down into smaller and smaller clusters, until all nodes are disconnected. The challenge in hierarchical clustering is determining a metric for the selection of which edge to cut (divisive) or add (agglomerative), and in how to interpret the resulting dendrogram. One of the more prevalent hierarchical clustering algorithms comes from work by Girvin & Newman (Girvan 2002; Newman 2003), referred to simply as GN. The GN algorithm follows a divisive hierarchical method, which iteratively removes edges with the highest edge-betweenness centrality score. This is based on the assumption that between-community edges have higher centrality than within-community edges. The GN algorithm recognized that the centrality score must be recalculated after each edge removal. However, the recalculation of centrality causes the algorithm to have high computational demands, running in O(n4) time on sparse graphs. Hierarchical clustering approaches, divisive or agglomerative, present some problems. The GN algorithm, as Newman (2004) pointed out, always produces a set of communities even when the network might not truly have such community division. The problem stems from the divisive hierarchy clustering process of simply breaking the graph down into smaller and smaller pieces without regard for what defines a community. The resulting dendrogram presents a number of communities based on the selected stopping point (Newman 2003). The challenge is that the decision of where to stop needs to be done a priori. The following illustration, Figure 1, shows a dendrogram with three possible cut points (A, B, and C), producing two, four, or six possible clusters, each of which does not necessarily equate to a community (Radicchi 2004).
Figure 1: Possible communities in a dendrogram
Newman (2004) addressed the problem of performance by developing an agglomerative method, fastNewman, that reduced runtime to O(n2). Performance increase was achieved through the introduction of Modularity as a replacement to edge-betweenness centrality. Modularity could be described as the notion that communities do not occur by random change. The Modularity, denoted Q, is the measure of a cluster against the same cluster in a null, or random, graph. A greater than random probability indicates a good cluster. Modularity has become a widely studied community quality measure (Clauset 2004; Clauset 2005; Noack 2009; Wakita 2007) (non-exhaustive list). More recently, Brandes et. al. (2008) published a critique of modularity that highlighted the issue that finding the optimal modularity value is an NP-complete problem. Real world social networks present an additional challenge in that people tend to belong to multiple communities simultaneously (Baumes 2005; Davis 2008; Du 2008; Palla 2005). Each person, node or agent, could have a community for family, friends, work, and interest, for example, and community detection algorithms must allow for, and detect, overlapping groups. Forcing a node into a single community and not allowing for overlap could prevent the detection of the true underlying community structures (Davis 2008; Lancichinetti 2009; Palla 2005). Furthermore, the detection of maximal community structure requires that community be allowed to overlap (Rees 2011). A number of solutions for finding overlapping communities have been developed (Baumes 2005; Davis 2008; Du 2008; Palla 2005). Gregory (2007), for example, modified the GN algorithm to highlight overlapping communities by splitting nodes, thus permitting a node to be represented in the graph multiple times, and allowing each instance of the node to clustered into a different community. While the modification does find overlapping communities, it also degrades the algorithm’s performance. Not all algorithms follow a hierarchical approach. Another common technique is to look for cliques, a subgraph with maximal density. Clique-based approaches dates back to the late 1940s (Wasserman 1994). Palla et al. (2005) extended the theory of cliques as communities by introducing the definition that a community, specifically a k-clique-community, is a union of all k-cliques that can be reached via adjacent k-cliques. The process works by rolling, or percolating, a k-clique over the network to find other k-cliques 3
The final publication is available at Springer via http://dx.doi.org/10.1007/s13278-012-0050-3
that share k-1 nodes. The percolating (Der é nyi 2005) is performed by moving the selection of one node within the k-clique to an unselected neighbor node that also form a k-clique. Since only one node is selected each time, the subsequent k-clique must share exactly k-1 nodes. This is not meant to be an all-inclusive list of community detection algorithms. For a more in-depth discussion on community detection research, we direct readers to a recent paper by Fortunato (2010). 2.3 Swarm-Based Community Detection Swarm Intelligence was first introduced by Beni and Wang (1989) and described as a collection of nonintelligent robots whose collective behavior produces an unpredicted, and intelligent, result. Rephrased, it is the emergent intelligence of a collection of simple agents. Studies of social insects have shown that they exhibit a form of emergent intelligence. Ant Colony Optimization, or ACO, is a popular technique for cluster that imitates the behavior of ants in performing simple sorting tasks (Hartmann 2005; Leung 2003). However, this type of cluster is merely grouping like objects together and not community detection. A comprehensive Internet search revealed only a single published swarm-based paper on community detection in complex networks. Oliveira and Zhao (2008) present what they called Swarm Aggregation. Their algorithm follows a divisive hierarchical approach that uses a swarm generated phase metric as the selection criteria for which edge to remove. Each node starts with a randomly assigned phase. That phase is propagated through the network following a swarm model. The edge between the two nodes with the greatest difference in the phase is selected for removal. Following the hierarchical paradigm, the process is repeated until all edges are removed and a dendrogram created. The use of a hierarchical approach, in our opinion, makes this algorithm only partially swarm-based. The algorithm suffers and additional drawback in that it is nondeterministic. Oliveira and Zhao suggest running the algorithm 30 times and averaging the results to obtain the communities.
3. OUR APPROACH 3.1 Assumptions When examining undirected, unweighted, and unlabeled graphs, a few assumptions need to be made: (1) That there is some form of homophily, common interest, that binds communities together; (2) that each edge represents the same level of relationship strength; and, (3) that there is an equal amount of reciprocity in each edge. With those assumptions in mind, we make a few assertions: 1.
That a triangle, triad with all three edges present, indicates that all members share a common interest
2.
That the absence of an edge in a triad indicates, the potential of, two topics of interest overlapping at one node
Consider a triad comprised of the three nodes {A, B, C}, Figure 2(a). If there is a tie between A and B, and A and C, the probability that B and C are linked is so much greater than random (Granovetter 1973; Kossinets 2006) that Granovetter deemed the absence of such a link as the “Forbidden” triad. The presence of a triad indicates that there is a strong tie between the nodes and therefore some type of shared interest, which could be called a community. For the purpose of this work, we are considering the absence of a link between node B and C, Figure 2(b), to be an indication that B and C are not similar and therefore, initially, not within the same community. Conversely, the presence of a tie between B and C, Figure 2(c), is an indication that all three nodes are in the same community.
4
The final publication is available at Springer via http://dx.doi.org/10.1007/s13278-012-0050-3
Figure 2: Triangles and the Forbidden Triad
3.2 Previous Work In our previous work, (Rees 2010; Rees 2011) we presented an approach to community detection that diverged from the notion that the graph needed to be viewed in full in order to detect communities. The algorithm showed that overlapping communities could be detected through aggregating the local group perspective of each node. The process works by first finding the Friendship-Groups of each node, and then aggregating, merging and reducing, the friendship-groups sets into communities. A friendship-group is defined as the local view of communities within an egonet from the perspective of the ego node. Or, an induced subgraph extracted from an egonet, adhering to the principle that communities have multiple paths (Moody 2003). A distinction is made between communities and friendship-groups since a friendship-group is a myopic view of the egonet, and one or more friendships-groups can be combined to form a community. As an example, the egonet in Figure 3 contains two friendship-groups as shown in Figure 3b-d.
Figure 3: Friendship-Group
The Merge and Reduce process is performed by first merging all matching sets, groups that are either complete or proper subsets of other groups. The next step is to merge groups that are “relatively close”, in this case, groups that match all but one item from the smaller group. Given two sets, SL and SS, where SL is larger than or equal to SS, the sets are merged (union) if the size of the intersection is equal to one less than the size of the smaller set: S L ∩ S S = S S −1 . This step compensates for egonets not having a complete picture of the community, and allows communities of different sizes to be compared. When a merge happens the two compared sets are deleted and the newly formed set added. The addition of a new set causes the “merge and reduce” process to start over. The process continues until there are no more sets to merge. The aggregation, merge and reduce, process caused the algorithm to have poor performance, running in approx. O(n3). 3.3 Defining Community Optimized Graph Swarm We use the term Swarm to be a multi-agent system (Ferber 1999) where each agent has the same behavior and goal. Agents are reactive, able to respond to environment, and social, able to communicate with other agents (Weiss 1999). A Graph Swarm is therefore a collection of agents whose behavior is that of nodes within a graph, or network, and whose environment consists of neighboring nodes (agents). Each agent is autonomous, acting independently without a central control. For the rest of this paper we will use the term agent in favor of node. However both terms refer to the same graph structure. The community detection feature of the Graph Swarm is an emergent behavior and not the goal of each agent. The goal of each agent is to simply agree, among its neighbors, on a unique identifier (ID) to each of its friendship-groups. Each agent governs the propagation of a suggested friendship-group ID based on its view of the other agents contained in the friendship-group. A Community Optimized Graph Swarm is a Graph Swarm where the goal of each individual agent is to label to which communities it belongs.
5
The final publication is available at Springer via http://dx.doi.org/10.1007/s13278-012-0050-3
3.4 Algorithm The algorithm executes in three distinct sequential phases. Each agent keeps track of which phase it is in and determining when it should move into the next phase. The three phases are: 1.
Detect Friendship-Groups and assign each a unique identifier
2.
Find Non-Propagating nodes within each Friendship-Group
3.
Propagate the assigned Friendship-Group IDs
Since every agent is identical, the description of the algorithm phases will be presented from the viewpoint of a single agent.
3.4.1 Initialization During graph creation, each agent is assigned an incrementing unique identifier (ID). That ID is used as the base for assigning a unique identifier to each friendship-group. For each detected friendship-group, an incremented decimal value is appended to the agent’s unique ID to form a unique ID for each friendshipgroup. The ordering of the friendship-groups is not important, only that each is uniquely identified.
3.4.2 Step 1: Detecting Friendship-Groups The first step entails the building of an egonet and the detection of the friendship-groups. This is done by have the agent ask each of its neighbors for a list of their respective neighbors. That process allows the agent to construct a local graph from which an egonet can be inducted. Once an egonet has been created the friendship-groups can be found Each agent keeps track of the currently assigned ID for each of its friendship-groups. Additionally, each agent records when the ID for a friendship-group has changed. The initial assignment of an ID to a friendship-group marks that set as having its value changed.
3.4.3 Step 2: Finding Non-Propagating nodes Not all neighboring agents are treated equal. Neighbors can have different view of the friendship-group, an indication of possible overlap. Consider the graph in Figure 3, The friendship-group view from node A is the set {A, B, C, D} while node D’s view of the same friendship-group is only {A, C, D}. Each agent will ask each of its neighbors for their view of the friendship-group. Since, from the perspective of the requesting agent, each of its neighboring agent can appear in only one friendship-group, the requested agent can quickly determine the group containing the requesting agent and return that friendship-group set. The requesting agent compares the two friendship-group sets, and if the sets are not the same, then information being passed from that agent is not propagated. The agent with a different view of the friendship-group is marked as Non-Propagating. Since there is no central control, this step is only initiated once the agent has found all its friendship-groups and assigned each a unique ID. Additionally, as the agent is asking each of its neighbors for their view of the respective friendship-group, the neighbor could return an error code indicating that it is not ready. In that case the agent simply repeats the request until a successful result is returned.
3.4.4 Step 3: Propagate the Friendship-Groups IDs The propagation of friendship-group IDs needs to be addressed from the perspective of the agent pushing out the ID value and from the view of an agent being informed of an ID value. From the view of the agent initiating the propagation: For each friendship-group where the ID has changed, notify each agent within that friendship-group of the new ID. From the perspective of the agent being notified: The agent first checks to see if the calling agent is considered Non-Propagating. Non-Propagating: If the calling agent is tagged as Non-Propagating, then the passed ID is checked against the currently associated ID. If the passed-in value is lower then the currently assigned value then the new value is associated with that agent and a successful status code returned. Propagating: If the agent is not Non-Propagating, e.g. propagating, then the related friendship-group is determined. If the new ID is lower then the ID current assigned to the friendship-group, then the value is
6
The final publication is available at Springer via http://dx.doi.org/10.1007/s13278-012-0050-3
updated and the friendship-group is marked as changed. The flag indicates that the newly assigned ID needs to be propagated. The process is repeated until all agents reach a steady state and no longer need to propagate information: e.g. the assigned values on the friendship-groups do not change. Additionally, as with the previous step, the agent needs to handle the case where the agent being informed of a new friendship-group ID is not ready for that information. For the error case the agent retries propagating the ID until all neighbors return successful. Each agent keeps a separate ID value for Propagating and Non-Propagation neighbors. The only different between the two is that propagating agent set the flag to continue pushing the ID value out to more neighbors. The ID value has no significance other than being a unique value. Additionally, the selection of the lower value is solely a technique that offers easy comparison and guaranteed uniqueness.
3.4.5 Obtaining the Communities The goal of each agent is to simply obtain a consensus between all its neighbors on a unique label for each of its friendship-groups. However, since each agent can have a different view of the group, labels can propagate beyond just the local friendship-group. The different perspective of each agent is what allows for the detection and identification of communities. Additionally, since a node can belong to multiple friendship-groups, overlapping communities can be detected. Once the propagation step stabilizes, communities can be determined simply by asking each agent for a list of its assigned communities. In this case, communities will be all agents that share a common ID value.
3.4.6 Performance The algorithm is designed to operate in an environment where agents can be distributed, operate autonomously, and have decentralized control. That environment makes determining runtime performance extremely difficult since all nodes could operate simultaneously. To simplify the task of estimating performance, we impose a single threaded environment that round-robins execution to each agent. Additionally, Hwang et al. (Hwang 2008) pointed out that the average degree of a sparse network is approximately log n. We will use that approximation for the anticipated engonet size. Lastly, we measure performance solely on the potion of code detecting communities. Initially loading of data, swarm creation, or other initialization times are outside the scope of this measurement. Step 1: The process of building the friendship-groups involves each agent asking its neighbors for a list of their neighbors. All returned lists are used to form an egonet. From that egonet, friendship-groups are extracted using a simply union-find algorithm. For each node O(n) 1.
Ask each neighbor, O(log n), for their neighbors.
2.
Take the list from the neighbors and add to a graph. O(log n).
3.
Find Friendship-Groups using a simple union-find algorithm O(log2 n).
The runtime for that portion is then: O(n ((log n * log n) + log2n) ) which reduces to O(n log2 n). Note: The process of adding neighbors to the graph in step 2 actually produces a graph larger that just the egonet. That needs to be done to ensure that between neighbor edges are added. The union-find algorithm was modified to only search within the egonet. Step 2: The next step is to find non-propagating neighbors. That process involves asking each neighbor for its view of the corresponding friendship-groups and comparing the returned set. For each node: O(n) 1.
Ask each neighbor for their corresponding Friendship-Group: O(log n)
2.
Intersect the two Freindship-Groups: O(log n)
Runtime of part two is O(n (log n * log n)) or O(n log2 n) Step 3: The last step is the propagation of the community ID.
7
The final publication is available at Springer via http://dx.doi.org/10.1007/s13278-012-0050-3
For each node: O(n) 1.
If ID has changed, propagate that ID to neighbors: O(log n)
2.
The called agent compares determines which set contains the requesting agent: O(log n)
3.
Compare values and update O(1)
The number of times an ID needs to be propagated is dependent on the diameter of the community. Using Small-Word (Barabasi 2002; Travers 1969; Watts 1998), we can estimate that the distance between any two nodes will be six degree. That yield a runtime of O(6 n log2 n), which simplifies to O(n log2n). The final runtime is therefore O(2(n log2n) + n log2n + 6(n log2n)). Dropping the constants and simplifying yields a total runtime of O(nlog2n).
3.4.7 Selection Non-Propagation Agent Options In the absence of additional relationship information, semantic tags or edge weights, we make the assumption that a friendship-group represents a single shared interest and not potentially multiple interests that overlap. The lack of additional information leaves the selection of non-propagating nodes as the primary vehicle through which where we can influence the communities’ boundaries. Leveraging our previous work, we used a very restrictive definition of close matching between two friendship-groups as a measure of when an agent should be labeled as non-propagation. That measure, which we call the Off-By-One score, is: S L ∩ S S = S S −1 . Nevertheless, that is not the only metric that could be used. A Jaccard index, for example, could be used to determination set closeness (similarity), and therefore the selection of Non-Propagation. Jaccard Index: J ( X ,Y ) =
X ∩Y X ∪Y
However, we find that the Jaccard index does not perform well when the two sets are drastically different in size. Instead we use the Overlap Coefficient, which is variant of Jaccard based on the size of the smaller set:
X ∩Y min( X , Y )
. In this case, a score of 1 indicates that the smaller set is a proper subset of the larger.
The problem with using the Jaccard index, or the Overlap Coefficient, is that a threshold value needs to be selected a priory. The selection of a threshold value has a tremendous influence on the selection of NonPropagating agents, and therefore on the number of communities detected. Setting the threshold at 1.0 generates a large number of small overlapping communities. A value of 0.0 on the other hand, causes the detection of a few large communities. Since our goal is to have an algorithm that detects communities without requiring prior knowledge of the data, or multiple runs to fine-tune the selection, we will use our Off-By-One metric. The Jaccard and Overlap Coefficient approaches are presented as supplemental information. Additional experiments are planned to determine if there is a similarity threshold value that produces better results. Lastly, the Off-ByOne metric is being used since it produces results similar, but not identical, to Clique Percolation (Palla 2005) when the clique size is three (k = 3). 4. APPLICATION 4.1 Simple Graph The first series of tests were on two simple graphs to determine how the algorithm would handle overlapping communities. The first graph contained two 4-cliques with a single shared common node, Figure 4. In this case, the algorithm was able to correctly identify the two communities.
8
The final publication is available at Springer via http://dx.doi.org/10.1007/s13278-012-0050-3
Figure 4: Double 4-Clique
The second graph consisted of two 5-cliques joined by a single edge, Figure 5(a). This was done to verify that the algorithm operates correctly and can detect the simple case. The interaction between the two cliques along the boundary was increased, Figure 5(b), with the question “How many communities exist now- one, two, or three?” posed. The algorithm detected two communities that overlap, Figure 5(c). In this case, the algorithm included two nodes from the other cliques within the community. This was different from the first test in that each community’s view of where the overlap occurs is different. Based on the results, we can infer that the four common nodes are important to both groups.
Figure 5: Double 5-Clique
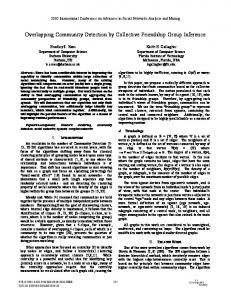
4.2 The GB Benchmark Girvan and Newnan (2002) presented a method for benchmarking community detection algorithms using simulated data. Their benchmark consists of a generated graph containing 128 nodes, broken down into four communities of 32 nodes each. The number of within-community edges is denoted zin, and the number of between-community edges is denoted as zout. The total number of edges per nodes is z = zin + zout and if fixed at 16 edges per node. The benchmark starts with zin = 16, all edges are within-community edges. The mixing parameter, denoted µ, is the ratio of within-community edges to between-community edges. That ratio is varied and the performance of the algorithm tested. The results of running our algorithm against the GB benchmark are shown in the following figure. Ten graphs where generated for each mixing parameter and the displayed points are the average over 10 interaction of each graph.
Figure 6: Results of GN Benchmark
We were not expecting our algorithm to have reasonable performance on this benchmark since it does not consider overlapping communities and is biased towards producing centrality based graphs. In fact, the benchmark penalizes overlapping because a node belonging to multiple communities counts as an inaccurate result. Additionally, results other overlapping community detection algorithms had against the same benchmark (Lancichinetti 2009) also produced poor results.
9
The final publication is available at Springer via http://dx.doi.org/10.1007/s13278-012-0050-3
Our algorithm had difficulties against this benchmark even when there were no between-community edges, zout = 0. This was due to the detection of multiple overlapping communities within the base cluster. The algorithm slowly decreased in accuracy as the number of between-community edges increased, and thus as the number of overlapping communities increased. One reason for this poor performance, we believe, is related to the low density of the four communities. The density further decreased as the number of between community edges increased, due to the degree of each node being fixed at 16. The following figure highlights the decrease in density as the mixing parameter increased.
Figure 7: GN Benchmark Community Density
Additionally, our algorithm detects overlapping communities, and as more between community edges were added the number of detected overlapping nodes also increased. The overlap feature caused a large number of nodes to be classified in multiple communities, decreasing the computed accuracy in this test. For illustration, we used the JUNG1 toolkit as a means of plotting data. The following figure shows the base graph with µ = 0.1 and µ = 0.7. At a mixing parameter setting of µ = 0.7, 70% of the edges are between community edges which raises the question of rather or not four communities still exist.
Figure 8: GN Graph at Different Mixing Parameters
This benchmark, though important, has a critical flaw. The benchmark maintains a constant degree for every node and decreases internal connection while increasing external connection without regard for what those connections means. Every edge, or relationship, has a meaning and the potential of forming a new community. The random addition of edges within a pre-selected number of nodes does not constitute a community. 4.3 GN Benchmark Variant As a variant to the GN benchmark, we changed the parameters on the data generator so that the density of each community was kept constant as additional between-community edges were added. This meant that the degree of each node also increased as more edges were added.
1
http://jung.sourceforge.net/
10
The final publication is available at Springer via http://dx.doi.org/10.1007/s13278-012-0050-3
Figure 9: Fixed Density Variant of the GN Benchmark
We were not excepting our approach to score much better since it still detected multiple overlapping communities. With every node being in multiple communities, the average accuracy was slightly better that 50%. However, by keeping the density constant, the algorithm maintained the same accuracy until the between-community edges became so great that communities started to merge. 4.4 Zachary The Zachary (1977) karate club dataset is a widely studied real world network representing the portion of members that interacted outside of the karate club. Zachary observed the social interactions of members of his karate club over a period of two years. By chance a dispute broke out between two members that caused the club to split into smaller groups. Our algorithm detected four communities within the dataset. The following figure illustrates the communities we detected and the fusion of the club into two groups. The two fusion groups are represented as circles and hexagons for one group and squares and triangles for the other.
Figure 10: Zachary Karate Club Dataset Cluster A: [1, 17, 7, 11, 6, 5] Cluster B: [13, 33, 1, 4, 14, 3, 22, 20, 2, 9, 18, 8] Cluster C: [25, 32, 26] Cluster D: [29, 33, 1, 21, 3, 31, 9, 15, 34, 28, 24, 30, 16, 27, 32, 19, 23] Not a member of a community: 10, 12
The detection of four communities seems to contrast with the findings of Zachary, however, the focus of the Zachary paper was on group fission and not on community detection. Additionally, the Zachary paper presented a method for establishing edges based on the number of different social events members attend together outside of the Karate club. Each of these social events has the possibility of defining a community. In this case those events are used to define friendship between members. In detecting communities, the algorithm also identifies those nodes that form the overlap between communities. Those nodes act as brokers, or social bridges, between communities. Of particular interest from the karate club are nodes 1, 3, 9, and 33. Those four nodes appear to be the glue that held the groups together. The detection of more than two communities, within the Karate dataset, has been addressed by Zhang et al. (2007) using a variant of k-means clustering they uncovered three communities. Additionally by Donetti & Muñoz (2004) using a maximized modularity algorithm. Since the Donetti & Muñoz algorithm does not
11
The final publication is available at Springer via http://dx.doi.org/10.1007/s13278-012-0050-3
producing overlapping communities, a true comparison cannot be performed. Nevertheless, we can do a comparison looking at the similarity of each cluster and evaluate any differences in terms of overlap. Cluster A differs only with the overlapping node 1. Cluster B also differs with node 9 and 33 which we have classified as overlapping. Cluster C is were the largest difference occurs. Donetti & Muñoz identified the set containing six nodes {24, 25, 26, 28, 29, 32}, while we only identified {25, 26, 32}. The difference in Cluster C also affected the similarity of Cluster D. We had not identified nodes {24, 29, 28} as being overlapping, therefore we mark them as potentially being missed clustered. Lately, we identified nodes 10 and 12 as not being in any cluster. Donetti & Muñoz placed node 10 in Cluster D and left only node 12 as not in any cluster. The CFinder algorithm of Palla et al. (2005) only identifies three communities. With Cluster A and Cluster C being identical to our results. However CFinder merges the remaining nodes into a single large cluster – we could achieve the same result by relaxing the Non-Propagating threshold. 4.5 Other Datasets A number of other datasets were processed by our algorithm and are shown in the following table, Error! Reference source not found.. However, as the sizes of the graphs being examined grew, so did the complexity of displaying and analyzing the resultant communities. Table 1: Additional Datasets Dataset
Nodes
Edges
Avg. Degree
Density
Communities Detected
Runtime (seconds)
Fast Modularity
CFinder
Dolphins (a) 62 159 5.13 0.084 5 0.038 4 4 Zachary (b) 34 78 4.6 0.14 4 0.02 3 3 Football (c) 115 613 10.66 .0935 18 0.105 7 4 Jazz (d) 198 2,742 27.69 0.14 2 0.62 4 2 Email (e) 1,133 5,452 9.6 0.008 40 0.56 12 41 PGP (f) 10,680 24,316 4.55 0.26 791 1.93 698 734 (a) D. Lusseau, K. Schneider, O. J. Boisseau, P. Haase, E. Slooten, and S. M. Dawson, The bottlenose dolphin community of Doubtful Sound features a large proportion of long-lasting associations, Behavioral Ecology and Sociobiology 54, 396-405 (2003). (b) Zachary 1997 (c) Girvan, M., and Newman, M. E. 2002 (d) P.Gleiser and L. Danon , Adv. Complex Syst.6, 565 (2003). (e) Guimera, L. Danon, A. Diaz-Guilera, F. Giralt and A. Arenas, Physical Review E , vol. 68, 065103(R), (2003). (f) M. Boguña, R. Pastor-Satorras, A. Diaz-Guilera and A. Arenas, Physical Review E, vol. 70, 056122 (2004) datasets from http://deim.urv.cat/~Eaarenas/data/welcome.htm
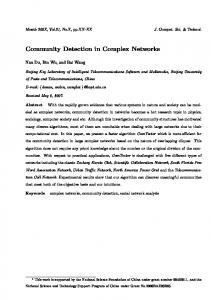
The table shows some basic metrics on each dataset, along with the number of detected communities and the number of nodes not assigned to any community, shown in parentheses. Additionally, results from running the FastModularity from Clauset and Newman (2004) and the CFinder algorithm of Palla et al. (2005) are shown for comparison. For CFinder, the results for k=3 were used. Each author on his or her respected web sites generously provided source code for each algorithm. 4.6 Performance The performance potential of using a swarm approach is one of the key benefits of this algorithm. The following figure, Figure 11, depicts the runtime performance on various test files. Test data was generated for graphs containing between 100 and 50,000 nodes. Performance was measured on a Mac Pro desktop with the application running inside of Eclipse in a single threaded environment. Each test file was run ten times and the average runtime computed. Additionally, it should be noted that each test for a given file produced the same results set. The raw values for the chart are shown in Table 2.
12
The final publication is available at Springer via http://dx.doi.org/10.1007/s13278-012-0050-3
Figure 11: Runtime Performance
Table 2: Runtime (seconds) and Graph Sizes Nodes
Edges
100 1,000 5,000 10,000 50,000 100,000
496 4,891 24,617 49,111 247,349 488,172
1Thread 0.15 0.40 2.06 2.97 15.11 415.14
2Threads 1.84 7.78 182.95
4Thread 1.72 6.06 100.31
8Thread 1.93 5.57 54.20
Due to memory limitation of the test server (8GB), processing of data file larger than 100,000 nodes was not possible. Processing 50,000 nodes required 6.9 GB of memory (real + virtual). At the 100,000 mark, the test system used all available real memory and performance was significantly degraded by virtual memory access. Lastly, for small graph sizes, under 5,000 nodes, there is no benefit to running more than one thread. The thread management overhead, more two or more threads, caused the algorithm to run slower on those smaller files. As a quick comparison of performance, we selected the two largest files used in our last paper [Rees 2010] and compared single-threaded runtime performance. The following Table, Table 3, shows the average runtime computed by processing each network ten times. Table 3: EgoClustering vs. Swarm Approach Runtimes Dataset Email (a) PGP (b)
Nodes
EgoClustering (seconds) 1,133 24.38 10,680 654.74 See Table 1 for references
Swarm (seconds) 0.56 1.93
5. FOLLOW-ON WORK In this paper we limited performance to a single thread running in a single Java VM on one server. However, the swarm nature of the approach lends itself to a multi-thread and/or distributed environment. We plan to test performance with multiple independent threads in a single server environment and with agents spread across a number of servers. The detection of communities within our framework is highly influenced by the selection of which nodes propagate their information. We presented two approaches, Off-By-One and Overlap Coefficient, to control propagation and allow for overlap. The former detects a large number of small tightly connected communities. The latter detects larger, loosely connected communities. Both metrics, however, use a reciprocal selection of non-propagating nodes - e.g. if node A is labeled as non-propagating be B, then node B is also non-propagating to A. We plan on investigating whether or not that reciprocal policy is valid. Additionally, we plan on testing various selection points to determine the optimal value. The goal of the
13
The final publication is available at Springer via http://dx.doi.org/10.1007/s13278-012-0050-3
algorithm is to consistently produce accurate overlapping communities with no prior knowledge of the graph or need for post-analysis tweaking of the algorithm. Additionally, we plan on analyzing a number of real networks with known community structures to better gauge performance and accuracy. Lastly, we plan on upgrading the amount of memory available on the test server so that larger datasets can be evaluated. 6. CONCLUSION The detection of communities within complex networks is a challenging problem [Lancichinetti 2009], made more difficult when nodes are allowed to realistically exist in multiple overlapping communities. In this work we presented a unique approach to the problem that uses each individual’s view of the communities, called Friendship-Groups, to allow the network to be analyzed in smaller pieces. The aggregation of individual perspective engenders an algorithm that shifts away from the traditional requirement of viewing the graph as a whole. That paradigm change allowed us to leverage swarm intelligence to further remove the need for a central control mechanism. The combination of those two items allows for overlapping communities to be detected with good performance, O(nlog2n), while being scalable to large data set sizes. 7. ACKNOWLEDGEMENT The authors are grateful to Graham Cruickshank for his proofreading skill. 8. REFERENCES Baumes, J., Goldberg, M., and Magdon-ismail, M. (2005). Efficient identification of overlapping communities. In IEEE International Conference on Intelligence and Security Informatics (ISI), pp. 27–36. Beni, G. and Wang, J. (1989). Swarm intelligence in cellular robotic systems. In NATO Advanced Workshop on Robots and Biological Systems, volume 102. Barabasi, A.-L. (2002) Linked. Perseus Publishing Brandes, U., Delling, D., Gaertler, M., Gorke, R., Hoefer, M., Nikoloski, Z. and Wagner, D. (2008) On modularity clustering, in IEEE Transactions on Knowledge and Data Engineering, vol. 20 (2), pp. 172–188 Buchanan, M. (2003) Nexus: Small Worlds and the Groundbreaking Theory of Networks. W. W. Norton & Company Chartrand, G. (1985 [1977]). Introductory Graph Theory. Dover Publications, Inc., New York, NY, USA. Clauset, A., Newman, M. E. J., and Moore, C. (2004) Finding community structure in very large networks. Physical Review E vol. 70, p. 066111+ Clauset, A., (2005) Finding local community structure in networks, Physical Review E, vol. 72, p. 026132+ Davis, G. and Carley, K. (2008) Clearing the fog: Fuzzy, overlapping groups for social networks, Social Networks, vol. 30, pp. 201–212 Der ́enyi, I., Palla, G., and Vicsek, T. (2005) Clique percolation in random networks. Physical Review Letters, vol. 94, p. 160202+ Donetti, L., and Munoz, M.A., (2004) Detecting network communities: a new systematic and efficient algorithm, Journal of Statistical Mechanics: Theory and Experiment, 2004 (10), p. 10012 Du, N., Wu, B., Pei, X., Wang, B., and Xu, L. (2007) Community detection in large-scale social networks, in WebKDD/SNA-KDD ’07: Proceedings of the 9th WebKDD and 1st SNA-KDD 2007 Workshop on Web Mining and Social Network Analysis, (New York, NY, USA), pp. 16–25, ACM Du, N., Wang, B., and Wu, B. (2008) Overlapping community structure detection in networks, in CIKM ’08: Proceeding of the 17th ACM Conference on Information and Knowledge Management, (New York, NY, USA), pp. 1371–1372, ACM
14
The final publication is available at Springer via http://dx.doi.org/10.1007/s13278-012-0050-3
de Oliveira, T. B. S. and Zhao, L. (2008). Complex network community detection based on swarm aggregation. In Proceedings of the 2008 Fourth International Conference on Natural Computation Volume 07, ICNC ’08, pp. 604–608, Washington, DC, USA. IEEE Computer Society. Everett, M. G., and Borgatti, S. P. (1998) Analyzing clique overlap, CONNECTIONS, vol. 21 (1), pp. 49– 61 Everett, M. G., and Borgatti, S. P. (2005) Ego network betweenness. Social Networks 27 (1), pp. 31–38. Ferber, J. (1999). Multi-Agent Systems: An Introduction to Distributed Artificial Intelligence. AddisonWesley Longman Publishing Co., Inc., Boston, MA, USA, 1st edition. Freeman, L. C. (1979) Centrality in social networks conceptual clarification. Social Networks 1 (3) Freeman, L. C. (1982) Centered graphs and the structure of ego networks. Mathematical Social Sciences (3), pp. 291–304. Fortunato, S. (2010). Community detection in graphs. Physics Reports, 486(3-5): pp. 75 – 174. Getoor, L., and Diehl, C. P. (2005) Link mining: a survey. SIGKDD Explorations. Newsletter. 7 (2), pp. 312 Girvan, M., and Newman, M. E. (2002) Community structure in social and biological networks. Proceedings of the National Academy of Science USA 99, 12, pp. 7821–7826. Granovetter, M.S., (1973) The strength of weak ties, The American Journal of Sociology, vol. 78 (6), pp. 1360–1380 Gregory, S., (2007) An algorithm to find overlapping community structure in networks, in PKDD 2007: Proceedings of the 11th European Conference on Principles and Practice of Knowledge Discovery in Databases, (Berlin, Heidelberg), pp. 91–102, Springer-Verlag Hartmann, V., (2005) Evolving agent swarms for clustering and sorting, in Proceedings of the 2005 conference on Genetic and evolutionary computation, GECCO ’05, (New York, NY, USA), pp. 217–224, ACM Hwang, W., Kim, T., Ramanathan, M., and Zhang, A., (2008) Bridging centrality: graph mining from element level to group level, in KDD ’08: Proceeding of the 14th ACM SIGKDD international conference on Knowledge discovery and data mining, pp. 336–344, ACM Kleinberg, J. (2000) The small-world phenomenon: An algorithmic perspective. In Proceedings of the 32nd ACM Symposium on Theory of Computing, pp. 163–170 Kossinets, G. and Watts, D. J. (2006). Empirical analysis of an evolving social network. Science, 311(5757): pp. 88–90. Lancichinetti, A., Fortunato, S., and Radicchi, F. (2008). Benchmark graphs for testing community detection algorithms, Physical Review E, vol. 78, p. 046110 Lancichinetti, A., Fortunato, S., and Kertesz, J. (2009). Detecting the overlapping and hierarchical community structure of complex networks, New Journal of Physics, vol. 11. Lancichinetti, A., and Fortunato, S. (2009). Benchmarks for testing community detection algorithms on directed and weighted graphs with overlapping communities, Physical Review E, vol. 80, p. 016118. Lancichinetti, A., and Fortunato, S., (2009). Community detection algorithms: A comparative analysis, Physical Review. E, vol. 80, p. 056117. Leung, H., Kothari, R., and Minai, A. A., (2003) Phase transition in a swarm algorithm for self-organized construction, Phys. Rev. E, vol. 68, p. 046111. Moody, J., and White, D. R., (2003). Structural cohesion and embeddedness: A hierarchical concept of social groups, American Sociological Review, vol. 68 (1), pp. 103–127. Newman, M. E. J. and Girvan, M. (2003). Finding and evaluating community structure in networks. Physical Review E, 69(12): p. 026113.
15
The final publication is available at Springer via http://dx.doi.org/10.1007/s13278-012-0050-3
Newman, M. E. and Park, J. (2003). Why social networks are different from other types of networks. Physical Review E, 68(3): p. 036122+. Newman, M. E. J. (2004). Fast algorithm for detecting community structure in networks.” Physical Review E , 69(6): p. 066133+. Noack, A., and Rotta, R., (2009). Multi-level algorithms for modularity clustering, in SEA ’09: Proceedings of the 8th International Symposium on Experimental Algorithms, (Berlin, Heidelberg), pp. 257–268, Springer-Verlag. Palla, G., Derenyi, I., Farkas, I., and Vicsek, T. (2005). Uncovering the overlapping community structure of complex networks in nature and society, Nature, vol. 435, p. 814. Radicchi, F., Castellano, C., Cecconi, F., Loreto, V., and Parisi, D. (2004). Defining and identifying communities in networks. Proceedings of the National Academy of Sciences of the United States of America, vol. 101 (9), pp. 2658–2663. Rees, B. S., and Gallagher, K. B., (2010) Overlapping community detection by collective friendship group inference, Conference on Advances in Social Network Analysis and Mining, International, vol. 0, pp. 375– 379. Rees, B. S., and Gallagher, K. B., (2011). EgoClustering: Overlapping Community Detection via Merged Friendship-Groups, in T. Özyer et. al, The Influence of Technology on Social Network Analysis and Mining, Springer Press, in press. Travers, J., and Milgram, S. (1969). An experimental study of the small world problem. Sociometry 32 (4), pp. 425–443. Wakita, K., and Tsurumi, T. (2007). Finding community structure in mega-scale social networks. In WWW ’07: Proceedings of the 16th international conference on World Wide Web, ACM, pp. 1275–1276. Wasserman, S. and Faust, K. (1994). Social network analysis: Methods and applications. Cambridge Univ Pr. Watts, D. J., and Strogatz, S. H. (1998). Collective dynamics of ’small-world’ networks.” Nature 393, 6684, pp. 440–442. Weiss, G. (1999). Multiagent systems: a modern approach to distributed artificial intelligence. MIT Press, Cambridge, MA, USA. Whitney, D. E. and Alderson, D. (2010). Are technological and social net- works really different? In Minai, A., Braha, D., and Bar-Yam, Y., editors, Unifying Themes in Complex Systems, pages 74–81. Springer Berlin Heidelberg. Zachary, W., (1977). An information flow model for conflict and fission in small groups, Journal of Anthropological Research, vol. 33, pp. 452–473. Zhang, S., Wang, R., and Zhang, X., (2007). Identification of overlapping community structure in complex networks using fuzzy cc-means clustering, Physica A: Statistical Mechanics and its Applications, vol. 374, pp. 483–490.
16