“Out Here” Forecasting: A Retail Case Study Curry W. Hilton, Tractor Supply Company, Christopher Houck, SAS ABSTRACT Faced with diminishing forecast returns from the forecast engine within the existing replenishment application, Tractor Supply Company (TSC) engaged SAS® Institute to deliver a fully integrated forecasting solution that promised a significant improvement of chain-wide forecast accuracy. The endto-end forecast implementation including problems faced, solutions delivered, and results realized will be explored.
INTRODUCTION This paper aims to describe the integration of SAS® Forecast Server™ into the current forecasting process for inventory replenishment. The business case, including problem awareness, solution design, and results will be thoroughly discussed. The necessary requirements for a successful forecasting implementation posed multiple challenges including scalability of forecasting, prevalence of intermittent demand, lack of consistent hierarchical structure, and inclusion of promotional demand. The designed solution embraced all such obstacles while level setting realistic forecast accuracy expectations. The forecasting results thus far have exceeded the projected returns on the project outlay. Overall forecast accuracy to the benchmark boasts a 9.6% improvement. The forecast accuracy improvements have provided positive network externalities, including better in-stocks and lower inventory holding costs.
PROBLEM The previous state of base demand forecasting at TSC for Store/SKU and DC/SKU levels relied on JDA® E3™ ASR (Store Replenishment) and AWR (Warehouse/DC Replenishment) replenishment systems. The one model fits all strategy (Exponentially Smoothed Model) employed by the JDA® E3™ forecasting engine proved to be inadequate across varied product assortments. The lack of model robustness, poor reactiveness to demand trends, blindness to promotional activity, and perceived need for excessive manual intervention supported a change in the forecasting and business processes for replenishment. Figure 1 represents the JDA® E3™ forecasting process for replenishment before SAS forecast integration: Figure 1: JDA® E3™ Forecasting Process for Replenishment at TSC JDA E3 ASR Application
Start Forecasting Process
Historical POS Base Demand
ETL
ASR Base Demand Forecasts
JDA E3 Application (Forecasting)
End Forecasting Process JDA E3 AWR Application
AWR Base Demand Forecasts
Store/SKU demand behavior at TSC is described as severely intermittent, where 99% of the store/SKU combinations possess less than 12 sales observations over 3 historical years. The lack of consistent history at the Store/SKU level combined with the business requirement to provide forecasts for 40 million Store/SKU groupings presented performance and modeling concerns. DC/SKU groupings account for 300 thousand required forecasts for JDA® E3™ AWR, where DC/SKU forecast are pure aggregations of Store/SKU forecasts in JDA® E3™ ASR. In addition to the challenge presented by the sheer magnitude of the forecasts necessary, promotional and price effects were required to be captured at the Store/SKU level. Dynamic promotional activity and the lack of fixed hierarchal pricing levels mandate special treatment of Store/SKU promotional forecasts.
1
SOLUTION SAS® Forecast Server™ generated the enormous number of Store/SKU and DC/SKU weekly forecasts for JDA® E3™ AWR and ASR consumption in the agreed upon service level agreement (24 hours). The business forecasting process including SAS® Forecast Server™ is as follows: Figure 2: TSC Forecasting with SAS Forecast Server
Historical POS Base Demand
Start Forecasting Process
Historical POS Promo Demand
Store/SKU Forecast
ETL
SAS Forecast Server
End Forecasting Process
Reconciliation
DC/SKU Forecast
Future Promotional Activity
ASR Base & Promo Demand Forecasts
AWR Base & Promo Demand Forecasts
STORE/SKU LEVEL FORECASTING Store/SKU level forecasts are modeled using multiple regression GLM procedures to account for price discounts, future promotional exposure (Multiple promotional vehicles), and promotional activity spanning multiple forecasting periods. In order to integrate forecast into the JDA® E3™ replenishment application and remain consistent with the 13, 4-weekly forecast periods, SAS developed 13 seasonal input variables to measure the desired seasonal effects. Time series clustering techniques are utilized to determine ‘like’ seasonal time series for seasonal effects in regression analysis. This procedure allows for dynamic groupings of SKU’s with similar seasonal behavior and shared seasonal predictability among defined groups. The following GLM regression High Performance Forecasting (HPF) code (Haxholdt & Houck, 2014) was utilized to generate the weekly Store/SKU forecasts: ods output ParameterEstimates=&outlibn..PEsts; PROC HPREG data=&outlibn..hp_regression; partition rolevar=partition(train='t' test='s'); by category; id &byvar category partition &datevar; class &class; model &y = &indep / noint; output out=&outlibn..model_full pred=predict_glm resid=residual copyvars=(&y promo_event DISC); RUN; PROC HPFENGINE data=&outlibn..model_full out=_NULL_ outfor=&outlibn..res_forecast(rename=(predict=predict_residual)) modelrepository=fs_dm.&model_repos globalselection=&global_select task = select( alpha=&HPF_FORECAST_ALPHA criterion=&HPF_SELECT_CRITERION holdout=&HPF_HOLDOUT minobs=&HPF_SELECT_MINOBS_NON_MEAN minobs=(season=&HPF_SELECT_MINOBS_SEASONAL) minobs=(trend=&HPF_SELECT_MINOBS_TREND)
2
intermittent=&HPF_DIAGNOSE_INTERMITTENT override)components=&HPF_COMPONENTS lead=&hpf_lead errorcontrol=(severity=HIGH, stage=(PROCEDURELEVEL)) EXCEPTIONS=CATCH; by &byvar; id &datevar interval=&timeint format=DATE9. notsorted horizonstart=&horizonstart; forecast residual / accumulate=total setmissing=&HPF_SETMISSING trimmiss=&HPF_TRIMMISS zeromiss=&HPF_ZEROMISS; RUN; DC/SKU LEVEL FORECASTING In order to provide a DC/SKU forecast for E3 AWR consumption and a more robust higher level hierarchal forecast, time series HPF procedures are utilized. Using aggregated data from Store/SKU demand history from ever-changing DC/Store/SKU relationships, the SAS generated time series models provide highly accurate results over the defined holdout periods. The forecasting process at the DC/SKU level is outlined below: Figure 3: Forecast Server Forecasting Process Start Forecasting Proess
Store/SKU Data Aggregation
Forecast Server Forecast Studio Reconciliaiton
DC/SKU Forecasts
End Forecasting Process
Variables available during the modeling process include: Table 1: Modeling Variables Variables
Variable Role
Description
total_qty
Dependent
Actual demand/forecast quantity
promo_var_(a,..., z)
Independent
Promo vehicles including, circular ads, special events, end caps, etc. (store count)
disc
Independent
Price discount factor
ppd_(1, …, 6)
Independent
Accounts for partial promo weeks
dummy_(1, …, 13)
Independent
Seasonal dummies for 13, 4-week periods
focus_page
Independent
Identifies circular focus page
In addition to the potential independent variable effects, promotional lifts derived during the Store/SKU regression are utilized as adjustments to the dependent variable, total_qty. The adjustments scraped from the GLM regression are treated as subtraction in the pre-operation and addition in the post-operation for the DC/SKU time series modeling. The primary adjustment leverages the circular advertisement adjustment where relevant promo_var_A, focus_page, ppd, and disc variables are used to adjust total_qty. The use of promotional effects from the Store/SKU regression in the DC/SKU time series modeling addresses inaugural SKU’s in promotional activity. The ability to tailor the forecast settings within SAS ® Forecast Server™ by department allows for more customization and ultimately better forecasts. In comparison to the sole, exponentially smoothed forecast model, within the JDA® E3™ forecasting engine, SAS® Forecast Server™ utilized a repository of 100’s of candidate models to diagnose the most appropriate fit according to seasonal behavior, trends, predictive input data, etc. The availability of different potentially selected models proved advantageous 3
when modeling across the varied product assortments at TSC. The TSC default forecast settings by department within SAS ® Forecast Studio™ for the DC/SKU time series modeling are as follows: Figure 4: Forecast Settings – DC/SKU – SAS® Forecast Studio™
The reconciliation within the DC/SKU modeling is bottom-up, with the following hierarchy: Figure 4: DC/SKU Reconciliation Hierarchy
Department xi
Category y1, …, yn
SKU z1, …, zn
DC k1, …, kn
4
During each weekly forecasting run, SAS ® Forecast Server™ generates Department, Category, SKU, and DC/SKU forecasts available for review and tuning via SAS® Forecast Studio™. Display 1 represents the user interface demand planners interact with after weekly forecasts have been executed. Display 1: Forecast Studio View
The model selection process within SAS® Forecast Server™ diagnoses demand history over a training period, evaluates potential model performance over a predefined holdout period, selects the most robust model, and uses such model to forecast over the required forecast horizon. Manual intervention by means of custom model addition to the model repository and overrides may be offered when deemed necessary. The model tuning executed by demand planners within department SAS® Forecast Studio™ projects persist from one week to the next. The “Scenario Analysis View” in SAS® Forecast Studio™ is utilized for ad-hoc promotional forecasting. Promotional forecasting scenarios are created for pre-planning purposes and reconciled to event forecasts once predictive data is loaded into SAS® Forecast Server™. ARIMAX models are the most widely used for promotional forecasting at TSC. The code below is representative of an ARIMAX model used in predicting a promo lift for a SKU in an upcoming circular advertisement. The parameter estimates (promo_var_A, ppd_2, and dummy_8) captured in the ARIMAX model are used to predict the expected promotional lift in the created scenario. The unit lift is harvested and applied for pre-planning purposes or overrides to the existing promotional forecasts. PROC HPFARIMASPEC /* Model: SUBSETARIMA_LABOR_DAY_AD Label: TOTAL_QTY = D=(1) NOINT + PT_A : NUM=( 1 ) D=(1) DEN=( 1 ) ... + dummy8 : NUM=( 1 ) LAG=11 D=(1) */ MODELREPOSITORY = fs_curry.cwmodel.rep SPECNAME=HPF1_12678 SPECLABEL="ARIMA: TOTAL_QTY ~ D = (1) NOINT + INPUT1: Dif(1) PT_A NUM = 1 DEN = 1 + ... + INPUT3: Lag(11)Dif(1) dummy8 NUM = 1" SPECTYPE=SUBSETARIMA SPECSOURCE=FSUI;
5
FORECAST SYMBOL = TOTAL_QTY TRANSFORM = NONE NOINT DIF = (1); INPUT SYMBOL = PT_A TRANSFORM = NONE DIF = (1) NUM = (1) DEN = (1); INPUT SYMBOL = PPD2 TRANSFORM = NONE DIF = (1); INPUT SYMBOL = dummy8 TRANSFORM = NONE DIF = (1) DELAY = 11 NUM = (1); ESTIMATE METHOD=CLS CONVERGE=0.001 MAXITER=50 DELTA=0.001 SINGULAR=1.0E-7; RUN; The following display portrays a scenario forecast for an upcoming promotional event: Display 2: Scenario Analysis for Promotional Forecasting
RECONCILIATION The high forecast accuracy realized at the DC/SKU level coupled with a DC-Store reconciliation method translates into better Store/SKU level forecasts.
6
The DC/SKU forecast output from SAS® Forecast Studio™ is reconciled against the regression forecasts at the Store/SKU level to produce the final forecast for JDA® E3™ consumption. The following figure represents the top-down reconciliation process from DC/SKU to Store/SKU: Figure 5: DC/SKU – Store/SKU Reconciliation
DC/SKU (DCi, SKUj)
Store/SKU (Storek...n, SKUj)
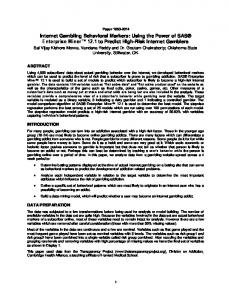
RESULTS Evaluating forecasting improvements relies on measuring the forecast accuracy of SAS generated statistical forecasts including manual overrides vs. a naïve model. The naïve model was constructed to be a proxy of the JDA® E3™ forecasting methodology. Since SAS forecast inception with the existing “live” departments, forecast accuracy compared to the naïve model has experienced a 9.6% improvement. Forecast accuracy results compared to the naïve model and the Forecast Value Add (FVA) at a sample department are reported below: Figure 6: Forecast Error: SAS vs. Naïve
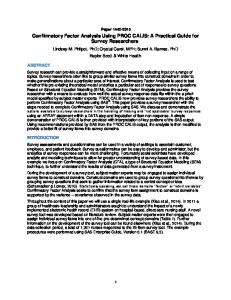
In addition to benchmarking forecast results to a naïve model, realistic forecast expectations were established by determining forecastablity of demand history. A coefficient of variation (CV) for each category was derived to map against the naïve and the SAS statistical forecast. The relationship between the SAS statistical forecast error and the coefficient of variation at the category level is as follows:
7
Figure 7: Forecast Error vs. Coefficient of Variation
The relationships between forecast error and demand variability allows for recognition of potential areas for forecast improvement. Categories (Represented by points on the scatter graph) with high MAPE and low CV represent latent forecast improvement opportunities. Categories with high CV and high MAPE can be understood to have low forecastablity. Establishing thresholds for realistic forecast accuracy returns have proved valuable for business adoption. Level setting prospective forecast and inventory goals by means of consistently monitoring forecast accuracy, inventory in-stocks, and holding cost align all affected business parties. Relying on statistical forecast performance to the naïve forecast and FVA analysis, the demand planning initiative has been well received and justified.
CONCLUSION Against all challenges present, the SAS analytical forecasting models partnered with TSC business integration processes delivered a significant improvement of forecast accuracy over the existing forecasting application. The use of best practice forecasting methodology, inclusion of promotional demand, hierarchal forecasting and reconciliation, and appropriate reporting ensures continued business acceptance and ROI on forecasting effort. Do work!
REFERENCES Haxholdt. C, & Houck, C. (2014, May). hpf_low.sas. Cary, NC, USA: SAS Institute.
ACKNOWLEDGMENTS Special thanks to Todd Kizer, SAS and Chris Houck, SAS for the encouragement to write this paper and the support during the design, build, and implementation phases of the demand planning project at Tractor Supply Company. Also, thanks to Hampton Smith, Tractor Supply Company, for giving me the opportunity to lead the demand planning initiative and always providing sound advice for navigating the business environment.
8
CONTACT INFORMATION Your comments and questions are valued and encouraged. Contact the author at: Curry W. Hilton Tractor Supply Company 615.290.3434
[email protected] Christopher Houck SAS Institute 469.401.6474
[email protected] SAS and all other SAS Institute Inc. product or service names are registered trademarks or trademarks of SAS Institute Inc. in the USA and other countries. ® indicates USA registration. Other brand and product names are trademarks of their respective companies.
9