Available online at www.sciencedirect.com Available online at www.sciencedirect.com
Procedia Engineering
Procedia Engineering 00 (2011) 000–000 Procedia Engineering 29 (2012) 2122 – 2126 www.elsevier.com/locate/procedia
2012 International Workshop on Information and Electronics Engineering (IWIEE)
Parameter Response Numerical Simulation of Resistivity LWD Instrument Based on Hp-FEM LI Huia, LIU De-Junb*, MA Zhong-huac, GAO Xin-shengd a,b,c,d
College of Geophysics and Information Engineering, China University of Petroleum-Beijing, Beijing 102249, China
Abstract Numerical simulation of electrical logging is important to the electrical logging instrument design and logging data interpretation and application. In this paper, we combine the hp finite element method (hp-FEM) analysis software HERMES and VC++ development platform as a tool to direct reflect the instrument drilling detection and distribution of induced electric field in the formation and it’s boundary, and the instrument parameter response by changing spacing, transmitting frequency and excitation current intensity have been studied based on self-adaptive hp-FEM algorithm. Because the performance of resistivity LWD instrument have decided by design parameters, thus study the electromagnetic response characteristics of resistivity LWD instrument has important significance to guide the high precision resistivity LWD instrument develop and improve the security of logging operation.
© 2011 Published by Elsevier Ltd.
Open access under CC BY-NC-ND license.
Keywords: Numerical simulation; LWD; hp-FEM algorithm; HERMES; transmitting frequency
1. Introduction In the field of oil well drilling, electrical logging-while-drilling (LWD) technology has become the key technology in real-time well site data collection and interpretation. At present, the electrical LWD technology is extensive development and plays an important role in geologic steer drilling, real-time formation comparative evaluation and complex oil reservoir development. Electrical LWD tools are commonly used in oil and gas exploration to estimate the conductivity (resistivity) of adjacent earth media, thus higher measurement precision of electrical LWD instruments should be developed as soon as possible. According to the measurement results of electrical LWD electromagnetic model, we can build the accurate electrical LWD measurement data interpretation theory, which has important significance to develop the high cost performance electrical LWD instruments [1]. Numerical simulation algorithms of electrical LWD include: forward numerical simulation and inver* Corresponding author: E-mail:
[email protected]
1877-7058 © 2011 Published by Elsevier Ltd. Open access under CC BY-NC-ND license. doi:10.1016/j.proeng.2012.01.273
2
LI Hui al. / Procedia Engineering 29 (2012)00 2122 – 2126 LI Hui, LIUetDe-jun, et al / Procedia Engineering (2011) 000–000
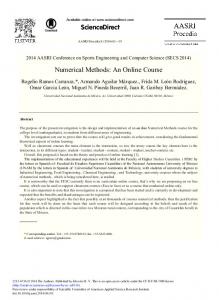
sion numerical simulation. Forward numerical simulation algorithms include: finite difference method, integral equation method, numerical mode matching method, successive approximation method, transmission line matrix, FFT Hank transform method, finite element method, etc. Although conventional forward numerical simulation algorithms obtained certain results in instrument response simulation, but problems still exist in solve the approximation accuracy and convergence speed. Meanwhile, low computational efficiency, narrow extended range, less numerical simulation software, dynamic numerical simulation hard to achieve still exist in electrical LWD field [2-3]. In the light of the deficiencies of these algorithms had, the self-adaptive hp-finite element method (hp-FEM) has been proposed to resistivity LWD numerical simulation based on HERMES [4] software and VC++ development platform. In this paper, the instrument parameter response characteristics by changing spacing, transmitting frequency and excitation current intensity have been studied based on self-adaptive hp-FEM algorithm. 2. Formulation 2.1. Self-adaptive hp-FEM algorithm During the last decades, different forward numerical simulation algorithms have been designed and implemented to generate optimal grids in the solution of relevant engineering problems. Among those algorithms, a self-adaptive, energy-norm based, hp-Finite Element (FE) refinement strategy has been developed at the Institute for Computational Engineering and Sciences (ICES) of The University of Texas at Austin. The strategy produces automatically a sequence of hp-meshes which independently of the number and type of singularities in the problem. Thus, it provides high accuracy approximations of solutions corresponding to a variety of engineering applications (see [4-5] for details). We use selfadaptive hp-FEM algorithm to establish the resistivity LWD electromagnetic response numerical simulation model. At first, on the basis of resistivity LWD theory we establish the instrument model and formation model. Secondly, use self-adaptive hp-FEM algorithm to descript the mathematical problems to the physical models. At last, we investigate the influence of measurement results based on changing spacing, transmitting frequency and excitation current intensity respectively. 3. Numerical results The basic structure of antenna system is three coils system as shown in Fig. 1. Where, T denotes transmitter coil, R1 and R2 denote receiver coils, the distance from T to R1 is L1, the distance from T to R2 is L2, IT is excitation current intensity in transmitter coil. Unless mentioned otherwise, the basic structure of resistivity LWD instrument is shown in Fig. 1. The amplitude ratio and phase difference of electromagnetic wave signal received by two receiver coils are investigated to reflect measurement results of resistivity LWD instrument [3-5]. 3.1. Spacing The coils system is the most important part of resistivity LWD instrument. In Fig. 1, the formation model is the tilted isotropic formation model, the conductivity of layer 1 is σ1 = 2S/m (low resistance layer), the conductivity of layer 2 is σ2 = 0.01 S/m (high resistance layer), the conductivity of layer 3 is σ3 = 2 S/m (low resistance layer). h denotes the horizontal depth of tilted isotropic formation model, h =3.1194m, z denotes the vertical depth, z = 6.0m, relative dielectric constant of formation ε = 1, this model considered as modelⅠ. The initial ranges of two receiver coils forward transmitter coil L1 = 0.36m and L2 = 0.2m, transmitting frequency f = 2MHZ, excitation current intensity IT = 0.5A. We fix the
2123
2124
LI Hui et al.et/ al Procedia Engineering 29 (2012) 2122 – 2126 LI Hui, LIU De-jun, / Procedia Engineering 00 (2011) 000–000
3
distance of two receiver coils and change the facing to investigate the measurement results of resistivity LWD instrument. When spacing L = 0.2m~1.2m, formation dip angle θ = 450, the amplitude ratio and phase difference shown in Fig. 2. 3.5
40
2.5
L = 0.2m L = 0.4m L = 0.6m L = 0.8m L = 1.0m L = 1.2m
30
p h a s e d if f e re n c e / ( °)
a m p lit u d e ra t io / (d B )
35
L = 0.2m L = 0.4m L = 0.6m L = 0.8m L = 1.0m L = 1.2m
3
2
1.5
25 20 15 10 5 0 -5
1
Fig. 1. Antenna system and formation model
0
1
2
3 4 formation depth / (m)
5
6
-10
0
1
2
3 4 formation depth / (m)
5
6
(a) amplitude ratio (b) phase difference Fig. 2. Amplitude ratio and phase difference
In Fig. 2, the amplitude ratio and phase difference have increased when spacing increased. When spacing is larger than 0.8m, the amplitude ratio would reduced obviously, but the phase difference in not strongly influenced by spacing. Meanwhile, when spacing L between 0.4m~0.8m the polarization angle would be emerged in formation interface. If spacing is larger than 0.8m the receiver coils would be influenced by skin effect obviously. Thus, the stratigraphic resolution would be reduced and hard to distinguish the thin layer. If reduce the transmitting frequency of transmitter coil we can obtain the similar results. When spacing L= 0.4m, formation vertical depth, z = 3.3m, formation dip angle θ = 450, according to self-adaptive hp-FEM method the position of resistivity LWD instrument and distribution of induced electric field produced by transmitter coil in formations can be real-time reflected, which shown in Fig. 3. In Fig. 3, electric field produced by transmitter coil has attenuated along horizontal and vertical direction respectively, in formation interface the electric field may rapidly attenuated and accompanied by electric field discontinuity. The main reason is that electromagnetic wave would appear attenuation when spreading in formation medium, the more formation resistivity lower the more electromagnetic wave decay faster. Changing spacing can adjust the detecting depth and precision of logging instrument, but if the spacing is too large, the receive coils may unable to receive a valid electromagnetic wave signal, conversely the detecting depth of the inctrument would be influenced. The distance between two receiver coils also affect the detect precision of instrument, if the distance is too large the thin layer would no conducive to distinguish and the strength of received signal may be affected. Conversely the amplitude and phase change have little changed, so it has not conducive to drilling geosteering. 3.2. Transmitting frequency We fix the distance of two receiver coils and spacing, changing transmitting frequency to investigate the measurement results. When transmitting frequency f = 2MHz~200KHz, formation dip angle θ = 450, the amplitude ratio and phase difference of two receiver coils shown in Fig. 4. In Fig. 4, the amplitude ratio and phase difference have increased when transmitting frequency increasing. When transmitting frequency is larger than 600KHz the polarization angle has been emerged in curves. When transmitting frequency f = 2MHz, receiving signal's amplitude ratio and phase difference shown that the two detecting curves are sensitive and have high resolution to low resistivity formation, compared with high resistivity
4
2125
LI Hui al. / Procedia Engineering 29 (2012)00 2122 – 2126 LI Hui, LIUetDe-jun, et al / Procedia Engineering (2011) 000–000
formation the dielectric constant would be the strongest influence factor. Table 1 shows the instrument response forward different transmitting frequency. Where, D denotes degree of freedoms, T denotes calculation time, N denotes iterative numbers, P denotes calculation errors. 2.6
40
2.4
f = 200KHz f = 400KHz f = 600KHz f = 800KHz f = 1MHz f = 2MHz
2
35
f = 200KHz f = 400KHz f = 600KHz f = 800KHz f = 1MHz f = 2MHz
30 25 p h a s e d if f e re n c e / ( °)
a m p lit u d e ra t io / (d B )
2.2
1.8 1.6 1.4
20 15 10 5 0
1.2 1
(a) electric field (b) mesh and order Fig. 3. Distribution of electric field, mesh and order
-5
0
1
2
3 4 formation depth / (m)
5
6
-10
0
1
2
3 4 formation depth / (m)
5
6
(a) amplitude ratio (b) phase difference Fig. 4. Amplitude ratio and phase difference
Table 1. Instrument response Algorithm hp-FEM f =2MHz f =800KHz f =400KHz
Measurement results (average) D T N P (%) 16722 1.72 6 0.758 22147 2.52 9 0.786 46065 3.78 10 0.902
In table 1, we can find when f = 2MHz the calculation errors is the lowest. However, increasing the transmitting frequency is well to resolute the formations, but it is not the large the better. If transmitting frequency increasing, the D, T and P would increased too, so the measurement errors must be increased. Meanwhile, if transmitting frequency increasing the two receiving coils may obviously influenced by skin effect so the measurement accuracy of the instrument must be decreased. 3.3. Current intensity and formation conductivity We fix the distance of two receiver coils and spacing L=0.4m, transmitting frequency f = 2MHz, changing current intensity to investigate the measurement results of resistivity LWD instrument. When current intensity J = 0.01A~1.5A, formation dip angle θ = 450, the amplitude ratio of two receiver coils shown in Fig. 5. In Fig. 5, when current intensity increased the amplitude ratio also increased. Thus, when excitation current intensity increased the amplitude ratio and resolution for different formation are all increased. But the detection precision and response time would be influenced if ecitation current intensity increased too fast. Meanwhile, high excitation current intensity may lead to the intensity of electromagnetic wave signal received by two receiver coils which would be approximation and hard to distinguish the thin layer. In model Ⅳ, we change electrical conductivity of formations to investigate the influence of amplitude ratio and phase difference. In Fig. 6, with the contrast of formation conductivity increasing, the amplitude ratio and phase curves displayed that the instrument sensitived to low resistivity layer and compared with high resistivity layer, it had high resolution ability. Meanwhile, the polarization angle may obviously affect when electrical conductivity contrast increasing. When electrical conductivity increase along the formation interface the electric field distributes density, while far away from formation
2126
LI Hui et al.et/ al Procedia Engineering 29 (2012) 2122 – 2126 LI Hui, LIU De-jun, / Procedia Engineering 00 (2011) 000–000 2 J = 0.01A J = 0.05A J = 0.1A J = 0.5A J = 1.0A J = 1.5A
a m p lit u d e ra t io / (d B )
2.2 2
σ1=0.2S/m σ1=0.05S/m σ1=0.007S/m σ1=0.0025S/m σ1=0.00125S/m σ1=0.001S/m
1.9 1.8 a m p lit u d e ra t io / (d B )
2.4
1.8 1.6
1.7 1.6 1.5
1.4 1.2
1.4
1
1.3
0
1
2
3 4 formation depth / (m)
amplitude ratio Fig. 5. Amplitude ratio
5
6
12 10
σ1=0.2S/m σ1=0.05S/m σ1=0.007S/m σ1=0.0025S/m σ1=0.00125S/m σ1=0.001S/m
8 p h a s e d iff e re n c e / ( °)
2.6
5
6 4 2 0 -2
0
1
2
3 4 formation depth / (m)
5
6
-4
0
1
2
3 4 formation depth / (m)
5
6
(a) amplitude ratio (b) phase difference Fig. 6. Amplitude ratio and phase difference
interface the electric field changed gently and emerged weakening tendency. Thus, by using the asymmetry of polarization angle emerged at formation interface in amplitude ratio and phase difference curves, we can judge the low resistivity layer or a high resistivity layer in instrument drilling process. 4. Conclusion In this paper, the electromagnetic response of resistivity LWD instrument has been simulated based on self-adaptive hp-FEM algorithm. Numerical results show that spacing changing would obvious influence the detecting depth and precision of instrument and changing the distance of receiver coils would effect the drilling geologic steering and thin layer distinguish, changing frequency would influence the judgment of low resistivity formation and the resolution of low resistivity formation may enlarge when frequency increasing, changing excitation current intensity can influence detection range. In practice, there are a lot of factors may affect design parameters and electromagnetic response of resistivity LWD instrument. Thus, study the electromagnetic modeling of LWD tools in tilted formations by using selfadaptive hp-FEM algorithm is important to guide the high precision resistivity LWD instrument developing and improving the security of logging operation. Acknowledgements This work is supported by the National Natural Science Foundation of China (No. 41074099). References [1] Chen Q, Pardo D, Li H B, et al. New post-processing method for interpretation of through casing resistivity (TCR) measurements[J]. Journal of Applied Geophysics, vol.74, pp. 19-25, 2011. [2] Sun X Y , Nie Z P, Zhao Y W, et al. The electromagnetic modeling of logging-while-drilling tool in tilted anisotropic formations using vector finite element method[J]. Chinese Journal of Geophysics, vol. 51, no.5, pp. 1600-1606, 2008. [3] Hwa O L, Fernando L, Cylindrical FDTD analysis of LWD tools through anisotropic dipping-layered earth media[J]. IEEE Transactions on Geoscience and Remote Sensing, vol. 45, no. 2, pp. 383-388, 2007. [4] Tomáŝ V, Pavel S, Martin Z et al. Modular hp-FEM system HERMES and its application to Maxwell’s equations[J]. Mathematics and Computers in Simulation, vol. 76, pp. 223-228, 2007. [5] Pardo D, Demkowicz L, Torres-Verdín C. A self-adaptive goal-oriented hp-finite element method with electromagnetic applications. Part II: Electrodynamics[J]. Computer Methods in Applied Mechanics and Engineering, vol.196, pp.3585-3597, 2007.