Pattern matching and associative artificial neural networks for water distribution system time series data analysis. S. R. Mounce, R. B. Mounce, T. Jackson, ...
617
© IWA Publishing 2014 Journal of Hydroinformatics
|
16.3
|
2014
Pattern matching and associative artificial neural networks for water distribution system time series data analysis S. R. Mounce, R. B. Mounce, T. Jackson, J. Austin and J. B. Boxall
ABSTRACT Water distribution systems, and other infrastructures, are increasingly being pervaded by sensing technologies, collecting a growing volume of data aimed at supporting operational and investment decisions. These sensors monitor system characteristics, i.e. flows, pressures and water quality, such as in pipes. This paper presents the application of pattern matching techniques and binary associative neural networks for novelty detection in such data. A protocol for applying pattern matching to automatically recognise specific waveforms in time series based on their shapes is described together with a system called Advanced Uncertain Reasoning Architecture (AURA) Alert for autonomous determination of novelty. AURA is a class of binary neural network that has a number of advantages over standard artificial neural network techniques for condition monitoring including a sound theoretical basis to determine the bounds of the system operation. Results from application to several case studies are provided including both hydraulic and water quality data. In the case of
S. R. Mounce (corresponding author) R. B. Mounce J. B. Boxall Pennine Water Group, Department of Civil and Structural Engineering, University of Sheffield, Sheffield, S1 3JD, UK E-mail: s.r.mounce@sheffield.ac.uk T. Jackson J. Austin Advanced Computer Architecture Group, Department of Computer Science, University of York, Deramore Lane, York, YO10 5GH, UK
pattern matching, the results demonstrated some transferability of burst patterns across District Metered Areas; however limitations in performance and difficulties with assembling pattern libraries were found. Results for the AURA system demonstrate the potential for robust event detection across multiple parameters providing valuable information for diagnosis; one example also demonstrates the potential for detection of precursor information, vital for proactive management. Key words
| asset monitoring, auto-associative neural network, event detection system, pattern matching, water distribution systems
INTRODUCTION Population growth, urbanisation, industrialisation and cli-
potable water hydraulic and quality variables within water
mate change are placing increasing pressure on water
distribution systems (WDSs) (Wu et al. ). Obtaining
resources. The water-energy-food nexus is a term being
system information from these data can facilitate proactive
used to describe the complex linkages and dependencies
system operation and maintenance. For water quality in
among water, energy and food security (Olsson ).
particular, online data are generally not as reliable as labora-
Global demand for water is forecast to outstrip supply by
tory-based discrete sample analysis with many associated
40% by 2030 due to factors such as population growth and
problems that include absolute accuracy, maintenance,
climate change (Parliamentary Office of Science and Tech-
calibration, connectivity issues and local disturbances
nology ). This building pressure on water availability is
(Aisopou et al. ). This situation is compounded by the
driving a greater consideration of optimal management of
ever increasing volumes of data being collected at a higher
clean water resources. Continuous online monitors and sen-
than ever seen before frequency of sampling and with
sors are increasingly being used to measure a wide range of
coverage of hundreds or even thousands of sites.
doi: 10.2166/hydro.2013.057
618
S. R. Mounce et al.
|
Pattern matching and associative ANNs for WDS time series analysis
Data from online monitors potentially provide a wealth of information about what is happening within
Journal of Hydroinformatics
|
16.3
|
2014
are helping to solve various problems in the water resources domain.
WDSs and intelligent algorithms can be applied to turn
A number of approaches from the fields of artificial
these data into information for water utility companies.
intelligence and statistics have been applied for detecting
Many companies are not making effective use of what
abnormality in WDSs from time series data. Alert systems
is being collected in this regard and are missing an
that convert flow and pressure sensor data into usable
opportunity to better understand and assess current
information in the form of timely alerts (event detection
system status. Any data interpretation system employed
systems) have been developed with a focus on burst detec-
must be able to deal with ‘dirty data’ such as inherent,
tion to help with the issue of leakage reduction. Some of
though improving data variability and quality limit-
the most recent approaches are summarised in Table 1.
ations. Hence systems need to include strategies for
Most of these systems are for detecting leaks/bursts at Dis-
handling missing values and dealing with noise, e.g.
trict Metered Area (DMA) level. DMAs are designed to be
Branisavljevic´ et al. (). Analysis systems need to pro-
hydraulically isolated areas that are generally permanent in
vide useful classifications of system status, events and
the system.
conditions and not provide an onerous amount of
Interest is growing in applying similar event detection
alerts or alarms to system operators who will otherwise
systems to online water quality measurements, including
ignore warnings hence compromising the value of the
from WDSs. The detection of anomalous events is of inter-
information.
est for both daily operational management, with a focus
This paper presents the application of pattern matching
on maintaining high water quality, as well as for identifi-
techniques and binary associative artificial neural networks
cation of intentional or ‘natural’ contamination events.
(ANNs) for novelty detection in time series data collected
Jarrett et al. () explore data processing and anomaly
from WDSs. Algorithms are described and a protocol devel-
detection techniques for data from WDSs including con-
oped for applying the approach to case study data, both
trol charting, time series analysis, Kriging techniques
hydraulic and water quality, from water supply systems in
and Kalman filter techniques. They concluded that no
the UK.
single methodology could be judged to always be the best choice. Open source software known as CANARY (McKenna et al. ) has been developed by the United
APPROACHES FOR EVENT DETECTION IN WDS MEASURED TIME SERIES DATA Table 1
|
Leak event detection techniques applied to DMA data
A water distribution network is a complex, distributed, Technique
Reference
Time Delay Neural Network
Mounce & Machell ()
Belief Rule Based System
Xu et al. ()
Self Organising Map Neural Network
Akselaa et al. ()
Mixture Density Neural Network and Fuzzy Inference System
Mounce et al. ()
of not requiring a detailed understanding of the interacting physical, chemical and/or biological processes that affect a
Kalman Filtering
Ye & Fenner ()
system before model inputs can be mapped to outputs.
Support Vector Regression with Novelty Detection
Mounce et al. ()
Multilayer Perceptron, Bayesian System and Statistical Process Control
Romano et al. ()
Principal Component Analysis
Palau et al. ()
non-linear dynamic system, and thus it may not be effectively or satisfactorily described using purely linear methods or models. It is not possible to build an accurate non-linear model completely describing the system from data due to the uncertainties present. However, datadriven modelling is highly applicable. It has the advantage
Data-driven models can complement and sometimes replace deterministic models (Solomatine ). Recent developments in the field of computational intelligence (sometimes termed soft computing or machine learning)
619
S. R. Mounce et al.
|
Pattern matching and associative ANNs for WDS time series analysis
States Environmental Protection Agency for the analysis
Journal of Hydroinformatics
|
16.3
|
2014
THEORETICAL BACKGROUND
of water quality time series data. CANARY uses statistical and mathematical algorithms to identify the onset of
Pattern matching
periods of anomalous water quality data, while at the same time, limiting the number of false alarms that
The problem of finding patterns of interest in time series
occur. A two-step process is adopted: state estimation
databases (termed ‘query by content’, i.e. to search for an
for future water quality value and a second stage of
occurrence of a particular pattern within a longer sequence)
residual classification for determination of expected or
is an important one, with applications in many diverse fields
anomalous value (an outlier).
of science. Application areas include: patterns associated
The aforementioned event detection systems generally have the following features in common:
with growth in stock and share prices (Zhang et al. ), in neuroscience for analysing the nervous system (Fletcher et al. ), for space shuttle sensor monitoring (Keogh &
(i) They learn from training data in some way to make a
Smyth ) and in transportation for signal timing in traffic management (Mounce et al. ). In diagnosis and fault
prediction about expected future values. (ii) They have some type of methodology or rules for decid-
detection applications an engineer may wish to query a pat-
ing when sufficient deviation from normality constitutes
tern database in real-time to determine what past situations
an abnormal event.
(contexts) are most similar to the current sensor profile. Pattern matching can thus be used for identifying anomalies in
Common difficulties with their application include an
an online monitoring system. As well as detecting that data
often large number of parameters to be tuned, poor quality
are abnormal, it is also useful to be able to determine in
data and how to define the appropriate training data
what way the data are abnormal and ideally to be able to
(‘normal’ data). Failure signatures often overlap with com-
classify the event type which the data correspond to.
plex
spatio-temporal
processes
that
occur
in
water
One approach (called sequential scanning or subse-
distribution networks, for example network configuration
quence matching) is to use brute force and ‘slide’ the
changes and abnormal demands (such as industrial
shorter query sequence Q against the longer reference
processes). This makes differentiation difficult. Another
sequence R, calculating the error term at each point based
limitation of these techniques is that they generally focus
on some similarity measure. A number of steps are required
only on anomaly detection being interpreted as outlier
for a general scheme in which we consider a univariate
detection (Hodge & Austin ). However, this simplifica-
signal uniformly sampled in time, which is the case with
tion produces methods that cannot necessarily discover
WDS time series data:
novel patterns formed by subtle changes across multiple variables over multiple time instances. It is hypothesised
1. Data pre-processing. The data must be processed into
that precursor features of a smaller magnitude than such
such a form so that data from different sensors can be
outlier thresholds may be present in some sensor time
compared on a like-for-like basis. The data for each vari-
series datasets, which could be potentially picked up
able may need normalising both with respect to a mean
before a major failure event (such as a catastrophic burst). Two approaches are considered here for dealing with
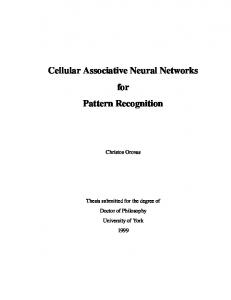
and with respect to the amplitude. 2. Populating the libraries. Each library needs to be popu-
these difficulties. (i) Pattern matching – i.e. how to identify
lated with data from profiles corresponding to that
generalised features of a pattern corresponding to classes of
event type. Firstly, the key variables for this event type
WDS events. (ii) Associative memories – how a monitoring
need to be identified and then profiles for these variables
system stores representation of normal distribution system
from past events placed into the library. Figure 1 illus-
operation and issues warnings when parameters are deviat-
trates some example burst profiles from a library for
ing from this behaviour so as to detect abnormality and
flow
possibly precursors.
respectively).
and
pressure
variables
(top
and
bottom,
620
Figure 1
S. R. Mounce et al.
|
|
Pattern matching and associative ANNs for WDS time series analysis
Journal of Hydroinformatics
|
16.3
|
2014
Burst patterns for WDS hydraulic data (flow top, pressure bottom).
3. Searching the libraries. This search is over each of the vari-
where τ(u) ¼ τ(t) means that times u and t are at the
ables in the data stream. A similarity-based search is used
same time of day and n is the number of measurements
so that similar-shaped profiles of different amplitudes are
u that meet the criteria in the summation.
matched (within a given scaling factor). Matches that are over a given threshold score are returned.
Secondly, we need to normalise these differences by the standard deviation over the same time series window as the mean is calculated from, so that overall
Data pre-processing xt ! It is necessary to pre-process the data in order to be able to compare patterns from different sensors and at different times on a more equal basis. Suppose that the time series for a particular variable is represented by ðxt Þt∈T . Firstly,
xt � μt σt
(4)
where σ t is the standard deviation of the values on which the mean is calculated.
we transform the time series to differences from the mean, i.e.
Populating the libraries
xt ! xt � μt
(1)
The libraries need to be populated with profiles for the different relevant variables. These profiles consist of con-
for each time t, where μ(t) is either:
secutive measurements
(i) the current average on some moving window [t�tA, t], i.e.
over
possibly
different
event
window lengths. It is important to use profiles that are typical and indicative of the given event type. A level of expert
P μt ¼
t�tA �u�t
knowledge and/or water network records may be required
xu (2)
n
where tA is the length of the time window for averaging
to obtain these exemplars.
Searching the libraries
and n is the number of time series values in the interval [t�tA, t].
Define t(E) to be the duration of event E. At each time t, the
(ii) the average for that time of day, i.e. P μt ¼
t�tA �u�t τ(u)¼τ(t)
n
time series profiles used for comparison with event library L are the time series
xu (3)
n o ðxu Þt�tl �u�t jtl ∈ ft(E)jE ∈ Lg
(5)
621
S. R. Mounce et al.
|
Pattern matching and associative ANNs for WDS time series analysis
Journal of Hydroinformatics
|
16.3
|
2014
so that if the event library has profiles of length 30, 60 and
on manual review, it is useful to have some form of auto-
90 minutes, at each time step we would perform a search
mated analysis system, which can scan the time series
over the last 30, 60 and 90 minutes worth of data
generated by monitoring sensors, and report any abnormal
respectively.
observations. This can be crucial in safety-critical environ-
The distance between profiles (which must be of the
ments. Novelty detection is a two class problem in that it
same length in terms of time) is found using the l 2 norm
needs to be ascertained whether acquired data come from
(Euclidean distance), i.e. the distance between the two
a normal operating condition or not. There are many tech-
n-vectors x ¼ (x1 , x2 , . . . xn ) and y ¼ (y1 , y2 , . . . yn ) then
niques for novelty detection including using outlier
d(x � y) ¼ jjx � yjj ¼
n X
analysis, however some types of faults do not involve any
!1=2 (xi � yi )2
one variable departing from normal operating range. (6)
i¼1
this is a challenging problem and rules out the use of many
Match scores can then be generated by calculating (assuming we are comparing profile x with library pattern y),
score(x, y) ¼
jjxjj � d(x, y) jjxjj
Since the classification of novelty is a priori unknown, supervised techniques. There is often no clear-cut boundary between novel events and normal events in real-world applications and a lack of meta-data (such as information about water treatment or process changes, maintenance events,
(7)
industrial processes, etc.) in WDSs is a particular problem. We can treat the WDS, or sub-areas (such as individual
so that if d(x, y) ¼ 0 then the match score is 1. A threshold
DMAs) in the context of real-time condition monitoring
can then be used above which two time sequences are
(CM), where it is critical to identify deviations from normal
said to be similar.
behaviour in sensor readings. A key element of CM is the
In order to calculate similarity with profiles that are of a
early detection of potential faults in the monitored system
similar shape but different magnitude we can calculate
or asset (such as a building, an engine or a pipeline), allowing
instead
preventative action to be taken before major damage occurs (for example a catastrophic burst). The CM system has to
dS (x, y) ¼ min d(x, αy) α∈[A,B]
(8)
where [A, B] determines the amplitudes of the patterns to compare with, i.e. if this were [0.5, 2] we would compare with patterns of amplitude between half and double that of the library pattern. For practical purposes, the minimum in Equation (8) has to be estimated from a number of intermediate points between A and B. This research uses this type of pattern matching for populating a pattern library and then comparing a new data stream against it for detecting faults.
identify these potential faults based on the values of a (possibly large) number of variables. In the field of ANNs, an associative memory is a network
which
stores
mappings
from
specific
input
representations to specific output representations. Hence, a system that ‘associates’ two patterns is one that, when presented with only one of these patterns later, can reliably recall the other. There are two types of associative memory: auto-associative and hetero-associative. Autoassociative memories are capable of retrieving a piece of data upon presentation of only partial information from that piece of data, while hetero-associative memories can recall an associated piece of data from one category upon
Associative memories
presentation of data from another category. Auto-associative mapping can be created by training an ANN to reproduce its
Novelty detection is the identification of new or unknown
input at its output (Masters ). A set of reference signal
data that a machine learning system has not been trained
patterns (e.g. parts of a time series) are learned by the
on or previously seen. Many applications exist for analysing
auto-associative network. When presented with an input
temporal sequences (Keogh et al. ). Rather than relying
pattern resembling one of the reference patterns, but
622
S. R. Mounce et al.
|
Pattern matching and associative ANNs for WDS time series analysis
Journal of Hydroinformatics
|
16.3
|
2014
contaminated with noise, the network’s output should be
data channels and enables the user to examine the details
close to the learned pattern that most closely represents
of one or more features extracted from the time series
the trial input. Thus if the trial input were very close to a
data. The SDE also contains efficient spike detection and
reference signal (e.g. part of a diurnal flow pattern), with
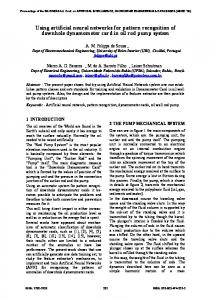
dynamic filtering functionality. An example of the SDE
the addition of noise (or missing parts of the signal), the
opening a WDS water quality sensor file is shown in
auto-associative network will act as a noise filter (or perform
Figure 2. Using the SDE, a user can explore and view any
pattern completion). A standard Multilayer Perceptron with
portion of the data rapidly. The output of the data processing
D inputs, D outputs and M hidden units can be used in this
tools can be viewed immediately and compared to the raw
manner albeit if M < D then additional hidden layers are
data by displaying them in the same window. Pattern match-
required to perform non-linear dimensionality reduction
ing is one of the primary functions of the SDE. The pattern
(Bishop ).
matching functions allow a user to search for particular pat-
Recurrent networks allow recurrences through feedback
terns within or across variables in datasets. The SDE
connections. This feature is used in associative memories
generates a search index based on binary vectors, in a
such as the Bidirectional Associative Memory and Hopfield
similar fashion to a conventional text search engine.
network. The former are ANNs that are used for performing
The SDE provides an interactive and intuitive search
hetero-associative recall (Kosko ). Hopfield networks
capability, which is feature driven, in that the user can high-
(Hopfield ) have been shown to act as associative
light a region of interest in a time series signal or select an
memories – after a network trains on a set of examples, a
instance from the pattern template library (as described ear-
new stimulus will cause it to settle into an activation pattern
lier) and request a pattern matching process to be carried
corresponding to the example in the training set that most
out against the target datasets. Similarity measures are
closely resembles the new stimulus.
used to provide a ranking system that can score results for
This research uses binary associative neural networks
the search process. The search process is scalable to terabyte
for detecting faults, by storing a representation of normal
datasets. Application domains for the SDE have included
behaviour and monitoring when the asset’s activity deviates
engine vibration data (frequency-power spectra from aircraft
from this behaviour. They are an example of a hetero-
engines searching for events such as bird strikes), structural
associative memory (although can also be used in an
data (e.g. environmental ‘shake and bake’ tests) and medical
auto-associative fashion).
data (for finding events in electrocardiography and electroencephalography) (Fletcher et al. ).
METHODOLOGY AND SOFTWARE
Correlation Matrix Memories (CMMs) and Advanced Uncertain Reasoning Architecture (AURA) Alert
Signal Data Explorer AURA is a set of general-purpose methods for searching The Signal Data Explorer (SDE) is a general purpose data
large unstructured datasets (Austin ). AURA is a class
browser and search engine for time series signal data
of binary neural network built on CMMs, as an underpin-
(Fletcher et al. ). The SDE allows a user to specify the
ning technology for efficient, scalable pattern recognition
signal event to be searched by supplying a short example
in complex and large scale CM applications. During asset
of that event (query by content). This can be specified
operation, the current state of the system can be compared
using manually created examples, historical sample inputs,
to the stored normal operating behaviour (in the CMM) to
or examples imported from other systems. The user is then
see if that combination of variable values has been seen pre-
able to select the (possibly large) datasets for the search.
viously. If not, this could be indicative of a problem, even if
The search returns a number of potential hits for particular
no individual variables have deviated from their normal
classes of events that can then be browsed using a powerful
value range (Austin et al. ). Firstly, a quantisation pro-
viewer which assists in the visualisation of multiple signal
cess (binning) is used with each potential value for each
623
Figure 2
S. R. Mounce et al.
|
|
Pattern matching and associative ANNs for WDS time series analysis
Journal of Hydroinformatics
|
16.3
|
2014
Signal Data Explorer opening a water quality sensor data file.
variable assigned to a bin and each bin corresponding to a
where Mk and Mk-1 are the CMM after and before the train-
different bit that will be set in the binary pattern – with
ing (with M0 ¼ 0 and ∪ denoting a logical OR operation
only one bit set (as illustrated as part of Figure 3). The
between the vectors). The recall vector Si associated to the
simplest binning method is to use bins of equal width,
input Ii is defined as:
although AURA allows the option to set a threshold for the number of values that can be placed in the extreme
Si ¼ Ii M
(10)
bins and, once exceeded, the bin values are reset and the memory retrained. The codes for each variable are then con-
This recall vector is generally an integer vector and the
catenated to create a binary representation of the state,
value of each element of the recall vector is called the
which is stored in a binary CMM (Willshaw et al. ) of
‘score’ of the CMM matching on the relevant column
an AURA associative memory. A binary CMM is a single
vector. The recall vector can then be thresholded to a
layer, fully connected network that is capable of very fast
binary output vector by either using a fixed threshold or
storage and retrieval of data. A CMM with input width n
selecting the L closest matches. This process is shown in
and output width m can be represented as a n × m binary
Figure 3 using small vectors for illustrative purposes (fixed
matrix M. For a given input binary vector Ik and associated
threshold of 2).
binary output vector Ok, the kth training update of a CMM
In practice, the recall system needs to factor in not only the number of bins that match exactly, but also the distance
is defined as:
between the assigned bins when they differ since this will Mk ¼ Mk�1 ∪
ITk Ok
(9)
provide important information on the closeness of match.
624
Figure 3
S. R. Mounce et al.
|
|
Pattern matching and associative ANNs for WDS time series analysis
Journal of Hydroinformatics
|
16.3
|
2014
Input variable binning and the CMM recall process.
This can be achieved by weighting the inputs. Hence AURA
This scoring system now more accurately reflects the
scores can be used to apply weights to the bins, according to
actual distance between each stored point and the recalled
their distance from the current values. A vector of scores
vector and hence the current and recorded asset states.
(rather than a binary pattern) is created, which defines a
Some modifications are then necessary to the threshold
set of kernels that quantify the distance of each bin from
technique (Austin et al. ). AURA k-Nearest Neighbour
the value. For example this could be a triangular shaped
(k-NN) can then be used as a filter to reduce a large
kernel centred around the recall value. Weeks et al. ()
number of stored states to a more manageable quantity of
discuss various kernels that can be used to provide different
closer matches (Hodge & Austin ).
approximations of distance. However, a kernel which
The k-NN pattern matching method is widely used in
approximates to the Euclidean distance between two
data clustering, classification and prediction. Based on a
points is described in Equation (11) and has been found to
specific distance metric or similarity measure, k-NN exam-
provide good results for fixed binning (Hodge et al. ).
ines vector distances to determine the nearest neighbours
"� Parabolicbinsk ¼
!# � 2 maxðnÞ 2 2 maxðnÞ �ðbinst � binsk Þ 2 n2f (11)
(Cover & Hart ). One approach could be to use k-NN on the raw values of each variable at each time interval and compare the recalled points to each of these. However, the resultant time complexity of performing these separate comparisons would severely limit the number of states that
where the output is the value of bin number k (binsk) and the
can be stored in the system. The standard algorithm is com-
value of the variable has been assigned to bin t (binst),
putationally slow for large datasets. A binary neural
max(n) is the number of bins for any variable and nf is the
network-based k-NN has been developed (Zhou et al.
number of bins for this variable.
; Hodge & Austin ) which can search millions of
625
S. R. Mounce et al.
|
Pattern matching and associative ANNs for WDS time series analysis
Journal of Hydroinformatics
|
16.3
|
2014
states very quickly. AURA k-NN is efficient and scalable,
with a zero code indicating the absence of data – particu-
and has shown to be up to four times faster than the tra-
larly useful for dealing with instrumentation or telemetry
ditional k-NN (Hodge et al. ). AURA Alert is the
problems in online systems.
implementation of AURA within the SDE.
AURA Alert is then provided with data from an
Using this approach, the system will locate the nearest k
extended period of time (at least 2 weeks) during which
matching patterns. The score associated with the most clo-
the WDS sensor has been known to perform correctly
sely matching column(s) can then be used to determine
with ‘normal’ conditions in the distribution system. At regu-
how different the current state is to any that have been
lar time intervals during this period, the values of a
seen before, to provide a measure of the novelty of the
representative set of variables from the data are converted
event. The AURA Alert software can thus continuously pro-
into a pattern, which represents the state of the WDS zone
vide a measure of novelty across a time series. Note that
at that time instance. This pattern is then stored in an
only an outline of CMMs and AURA Alert has been pro-
AURA associative memory.
vided here. An in-depth description of CMMs, AURA and AURA k-NN can be found in: Austin (), Zhou et al. (), Liang & Austin (), Hodge et al. (),
RESULTS AND DISCUSSION
Hodge & Austin (), Furber et al. () and Fletcher et al. ().
Pattern matching
Water distribution system time series data
Data analysis was conducted using the SDE and a query by content approach for pattern matching. In addition, pattern
Data streams from WDSs can be somewhat different to other
matching software was developed in C# using Microsoft
domains such as found in engine or power plant monitoring.
Visual Studio. Libraries of event profiles were created
Some variables, particularly hydraulic parameters, such as
from .csv data to allow batch processing. Ten DMA inlet
flow and pressure, possess a diurnal pattern which reflects
flows (A to J) were obtained for a large water supply
the daily demand profile dominated by residential use,
system, with a mixture of urban and rural areas, for an
pressure in Figure 2 illustrates this. Some water quality
approximate 8 month period for use in selecting burst pro-
measurements also reflect this, so that chlorine concentration
files (industry standard 15 minute sampled data) along
for example will (generally) have a periodic sinusoidal like
with the Work Management System (WMS) mains repairs
profile. However, other water quality parameters such as con-
record. A pattern library of known bursts for these DMA
ductivity are more similar to those measurements usually
flow inlets using the SDE was assembled from this dataset.
encountered in CM. Finally, some can have both character-
These were identified from within the 10 DMA flow inlet
istics, such as turbidity (as seen in Figure 2).
datasets (normalised as described previously in order to
In order to use AURA alerts on data with periodic (e.g.
allow generalisation from the DMA flow values) by using
daily) cycles, it is necessary to introduce an extra ‘time of
WMS information to confirm large burst events and hence
day’ variable (e.g. the number of elapsed hours of the day).
creating a set of profiles consisting of a number of consecu-
This enables AURA alerts to detect patterns in the data
tive measurements (described in the pattern matching
that are unusual at that time of day. The data collected
section). These were chosen to capture the significant first
from sensors are first formatted into input files for a
features of change in parameter due to an event – using
MATLAB pre-processing program which identifies and fills
between one and two hours of data. The SDE allows search-
in any missing timestamps or values so as to provide a con-
ing for similar patterns in this library. One DMA (G) was
tinuous stream of data. The data are finally reformatted into
held back for testing using the pattern library. An example
an appropriate comma delimited format required by the
is provided in Figure 4 of a detected burst in this DMA,
SDE. Note though that for non-periodic data streams, the
which was matched with a very high probability to a burst
AURA system is able to deal with completely missing data,
from another DMA.
626
S. R. Mounce et al.
|
Pattern matching and associative ANNs for WDS time series analysis
Journal of Hydroinformatics
|
16.3
|
2014
Although this example illustrates the transferability of the concept of a ‘burst’ pattern, a limitation in the approach is in the manual assembly of the pattern library and the uncertainty prevalent in defining event classes for WDS. Even when limited to burst only patterns, performance on the test DMA was found not as accurate as an AI system utilising outlier detection. Accurate selection of precursor patterns is also far from obvious. Using AURA Alert to automatically calculate a novelty score for any type of event, possibly never encountered before, was thus identified as a Figure 4
|
Pattern matching bursts in DMA flow data.
more attractive technique with the possibility of detecting precursor features before major failure.
Three other matches of above 90% match score were
AURA Alert
obtained for DMA G for the whole period of analysis – summarised in Table 2. In the case of each of the detections,
The AURA Alert system utilising CMMs has been used for
visual analysis revealed that the profile was briefly unusual,
the detection of irregularities in highly complex assets in a
although there was only one correlation found with WMS
variety of different industries. Applying AURA Alert on
history. The results for an Artificial Intelligence (AI) analysis
real data from two different WDSs to explore the capabili-
system and all mains burst repairs (MR) for the same DMA
ties of the method and results obtained are now described.
are also reported in Table 2 (after Mounce et al. ). Table 2 reports three MR in the period of which two were
Flow data analysis
detected by the AI system (the other having no significant impact on the nightline). In particular, a burst was repaired
The DMA inlet flows A – J, used in the pattern matching test,
on 24/12/05 of significant duration detected by the AI
were each analysed by the AURA system and performance
system (a total of three AI detections > 85% confidence)
compared to WMS and the aforementioned AI system
but not resulting in a hit using pattern matching.
(a 4 week period was used to create the CMM model).
Table 2
|
Pattern matching results for DMA G compared to AI system
WMS record Pattern matching (PM) positive classification period
repair date
AI positive classification period
None
MR 24/12/05
23/12/05 14:00–24/12/05 06:15 (96% confidence, burst est. 0.74)
Match at 15/04/2006 07:30 in PM library with Burst DMA E flow 190406 0000-0130 (score 91%)
None
None > 85% confidence
Match at 16/04/2006 06:00 in PM library with Burst DMA E flow 190406 0000-0130 (score 93%)
None
None > 85% confidence
None
MR 09/02/06
None >85% confidence
Match at 12/05/2006 00:00 in PM library with Burst DMA F flow 170206 0000-0045 (score 98%)
MR 12/05/06
11/05/06 21:15–12/05/06 11:45 (99% confidence, burst est. 3.13)
Match at 29/05/2006 08:45 in PM library in with Burst DMA E flow 190406 0000-0130 (score 91%)
None
None >85% confidence
None
None
03/06/06 14:30–04/06/06 05:30 (99% confidence, burst est. 0.60)
627
S. R. Mounce et al.
|
Pattern matching and associative ANNs for WDS time series analysis
Journal of Hydroinformatics
|
16.3
|
2014
A match score threshold of 85% was used to identify reason-
can be calculated and reported along with the matching
ably large deviations from normality resulting in 20 overall
strength. The reported novelties (not shown here) indicate
detections (in comparison to 16 for the AI system). Of these,
that the turbidity, pressure and conductivity are deviating
four detections corresponded well to WMS burst repairs (for
from their expected values, suggesting a burst event.
the AI based system this number was five – with three of
Although a burst has been used for illustration, the prolifer-
these detected by both systems). Of the remainder, 13 were
ation in measured parameter options in new WDS water
correlated visually with abnormal temporary increases in
quality instrumentation paves the way for detection and
flow and three with likely short sensor drop outs to zero.
classification (based on which parameters are novel) for
Overall the performance was thus comparable to the AI detection as reported in Mounce et al. (). AURA offers
other types of abnormality such as contamination events (intentional or accidental) (e.g. Leeder et al. ).
other possible advantages such as across multi-parameter analysis or potential short precursor event detection as
Pre-cursor example
further explored in the next two examples. The final example presented is in the use of AURA Alert to Water quality example
identify novelties in multiparameter data several days before a catastrophic failure in a complex asset, without any prior
A multi-parameter water quality dataset was obtained for a
knowledge of similar failures. A flow and pressure dataset
measuring instrument based at a DMA inlet in an urban
was assembled for a DMA. The data consisted of 15
WDS deployed as part of a pilot study. Parameters measured
minute readings, the WMS record and any associated custo-
were water temperature, pH, conductivity, turbidity and
mer contacts (CC) (complaints to call centres). These data
pressure at a 5 minute resolution. Data from a period of sev-
include pressure data from the DMA inlet in addition to
eral weeks when the DMA was considered to be operating
two specific point pressure loggers located at critical (deter-
normally were presented to the AURA Alert system and
mined by expert judgement) locations in the DMA.
the learned configurations encountered were stored in the
Hydraulic data were utilised, with AURA trained using sev-
AURA memory. Figure 5 shows the five channels corre-
eral weeks of normal data, and a test period with known
sponding to the raw data. The AURA Alert output can be
multiple events and supporting information has then been
seen in the ‘Match Strength’ channel (bottom axes), which
used to illustrate the possibility of precursor detection.
has a value of 100 when in a previously seen state and
Figure 6 provides the Match Strength output with WMS
drops down when a novelty is detected. In Figure 5 note
and CC information overlaid and in addition the online
how the matching strength remains high during the period
detection from an online AI system (Mounce & Boxall ).
of normal activity earlier in the period (the greyed out sec-
Figure 6 plots a period of 9 days during which two
tion indicating the end of the training data) but later
water main burst repairs were flagged and marked as
reports the presence of novelty, indicating that the asset
repaired in the DMA. Information in the WMS reveals
state has departed from its usual operating behaviour (in
that one repair had a start date of 20th September and a
fact this was a known burst affecting the DMA being
completion on 24th September. The second had a start
monitored).
date of 24th September and a completion date the day
In addition to reporting the matching strength of the
after. We see from the flow plot, that a burst main repair
state of the system at each time instance, AURA Alert is
resulted in a drop of the nightline on 23rd September
able to indicate which channels are the likely causes of
once completed. Before this, a new burst was first detected
the irregularities. By using an L-Max threshold (the metric
by an online AI system 06:00 23/9, which preceded a
where L highest sums are set to 1 and all others to 0) on
number of CCs (11 customers complaining of no water,
the AURA output, the most similar stored pattern to the cur-
and two of discolouration). The Match Strength drops
rent asset state can be obtained. By comparing the current
below 90 several hours before this. However, of more inter-
state to the most similar state, the causes of the differences
est is the large drop in Match Strength on 18th September
628
Figure 5
S. R. Mounce et al.
|
|
Pattern matching and associative ANNs for WDS time series analysis
Journal of Hydroinformatics
|
16.3
|
2014
AURA Alert for abnormal event in water quality data.
around midnight prior to any other warning of a problem
later. The fact that the water company noted a repair
and corresponding to short duration drops in both pressure
start date to the WMS database on 20th September sup-
and flow; this may be a burst precursor indicative of a
ports this. Whilst Figure 6 shows the potential for
developing problem or some activity on the network
precursor detection, confirmation can be rather subjective
which subsequently caused the major burst several days
due to the resolution of data and in particular the
629
Figure 6
S. R. Mounce et al.
|
|
Pattern matching and associative ANNs for WDS time series analysis
Journal of Hydroinformatics
|
16.3
|
2014
AURA Alert Match Strength and supporting information for potential precursor.
supporting information. Validation of this capability would
sector can and should be penetrated by Information and Com-
require a more extensive bespoke study.
munications Technologies and Internet-like technologies. It is
It has been demonstrated that the AURA Alert system
easy to anticipate that the environment may before very long
has the potential for detecting changes across multiple par-
be teeming with tens of thousands of small, low-power, wire-
ameters, allowing robust detection and information for
less sensors. Each of these devices will produce a stream of
interpretation, and offering scope for detection of event pre-
data, and those streams will need to be monitored and com-
cursors. Timely event detection and diagnosis offer
bined to detect changes of interest in the environment. The
significant improvements in service delivery with a move
easier it is to collect and analyse large datasets the more
towards proactive maintenance, while the implication of
water utilities will collect and, in a decade, tens or even hun-
precursor information is to provide network engineers
dreds of petabytes of data may be routinely available.
additional time to investigate the cause of abnormal con-
Demands for solutions and tools will become more urgent to
ditions and perhaps prevent major asset failure before
meet the aspiration for intelligent water networks, proactively
customers are impacted. Of course, datasets with more
managed through access to timely information. Permanent
exhaustive information (such as known artificial hydrant
installation of high frequency (several hundred or even thou-
flushing) could be used to evaluate more rigorous
sand Hz) pressure monitoring devices may also become
quantifiable error metrics such as the level of false-positives.
routine and pilot studies using these have demonstrated how the arrival times of the burst induced wave at the measurement
General discussion
points can be used to derive the location of the burst using transients (Misiunas et al. ). The data compression facilities of
WDS sensors monitor assets (reservoirs, pipes, valves, etc.)
systems such as AURA could prove very useful for these future
with the performance of these assets being indicated by the col-
data quantities.
lected measurements. At the present time, the granularity, i.e.
This proliferation of monitoring will facilitate the con-
number of devices and sampling interval, is quite limited
tinuous and simultaneous monitoring of the complete
compared to other industries. However, the quantity and com-
WDS (or at least significant sub-areas). By evaluating devi-
plexity of sensor and environmental data are growing at an
ation from normality from a set of distributed sensors,
increasing rate and it seems clear that in the future the water
both detection and location of abnormal events will be
630
S. R. Mounce et al.
|
Pattern matching and associative ANNs for WDS time series analysis
Journal of Hydroinformatics
|
16.3
|
2014
possible – such as using multiple pressure loggers to locate a
for many applications. The transferability (i.e. not tuned
burst (e.g. Farley et al. ; Romano et al. ). The moni-
per DMA) of burst patterns was demonstrated here to
toring of sewerage systems has not progressed as far as for
some extent. However, overall the performance was
WDSs, however there is increasing interest and deployment
found to be not as high as when using outlier detection
of instrumentation for example for Combined Sewer Over-
based methods for this type of WDS time series data. A
flow level measurement and pump station flows. There are
limitation of the approach is in the manual assembly of
many other potential applications in the water resources
the pattern library and the uncertainty prevalent in defin-
domain.
ing event classes for WDS.
AURA Alert is being developed as an online system which automates the training data selection (by selecting
•
AURA Alert (Advanced Uncertain Reasoning Architecture, utilising a class of binary neural network built on
data with high Match Strength) and use of validation data
CMMs) can rapidly learn and model the normal operat-
for selecting Match Strength thresholds for alert generation.
ing envelope for a system, with the ability to search
This can be deployed by the cloud as a Software as a Service,
through complex high-dimensional multivariate spaces
leveraging Grid technology and permitting secure, rapid
to detect deviations from normal conditions. The novel
delivery of information to the viewer.
use of AURA Alert in WDS so as to automatically calculate a continuous novelty score for every time step and hence enable the detection of any type of event, possibly
CONCLUSIONS
never encountered before, was proposed, explored and demonstrated. Examples have demonstrated successful early detection of abnormality in systems using multi-par-
The effective and efficient operation of WDSs is essential for
ameter data as well as significant potential for precursor
three important reasons: maintaining safe and continuous
event
supply to consumers, avoiding loss of water resources
approaches. These precursors could be linked to appro-
through leaks and bursts in the pipe network, and reducing
priate maintenance requirements for water infrastructure.
detection
beyond
typical
outlier
detection
the energy and other resources input to the system and so minimising the carbon footprint of water system operations. To achieve this efficiency, information is continually required about current system performance, so adjustments can be made where necessary and interventions can occur
ACKNOWLEDGEMENTS
before any fault or failure impacts on the customer. This
This work was supported by the Pennine Water Group –
paper has presented the use of pattern matching and
Urban Water Systems for a Changing World Platform
binary associative neural networks using time series from
Grant (EP/I029346/1) and by the Pipe Dreams project
WDS. Using AURA Alert, time series data from sensors
(EP/G029946/1), both funded by the UK Science and
(variables) are converted into vectors using a quantisation
Engineering Research Council. The authors would like to
process. Vectors are then stored in a historical database in
thank Yorkshire Water Services for data provision.
the correlation matrix memory. New data presented as vectors can either be used to generate the k best matching historical patterns or alternatively a measure of novelty (termed Match Strength) can be generated. One of the major features of the system is its ability to search small and very large datasets very quickly. The key conclusions of this research are as follows:
•
A pattern matching approach can be proficient at finding known patterns in data and has been applied successfully
REFERENCES Aisopou, A., Stoianov, I. & Graham, N. In-pipe water quality monitoring in water supply systems under steady and unsteady state flow conditions: a quantitative assessment. Water Research 46, 235–246. Akselaa, K., Akselab, M. & Vahalaa, R. Leakage detection in a real distribution network using a SOM. Urban Water 6 (4), 279–289.
631
S. R. Mounce et al.
|
Pattern matching and associative ANNs for WDS time series analysis
Austin, J. Distributed associative memories for high speed symbolic reasoning. International Journal on Fuzzy Sets and Systems 82, 223–233. Austin, J., Brewer, G., Jackson, T. & Hodge, V. J. AURA-Alert: The use of binary associative memories for condition monitoring applications. In: Proceedings of 7th International Conference on Condition Monitoring and Machinery Failure Prevention Technologies: (CM 2010 and MFPT 2010), vol. 1, pp. 699–711. Bishop, C. M. Pattern Recognition and Machine Learning. Springer, New York. Branisavljevic´, N., Prodanovic´, D. & Pavlovic´, D. Automatic, semi-automatic and manual validation of urban drainage data. Water Science and Technology 62 (5), 1013–1021. Cover, T. & Hart, P. Nearest neighbor pattern classification. IEEE Transactions on Information Theory 13 (1), 21–27. Farley, B., Mounce, S. R. & Boxall, J. B. Development and field validation of a burst localization methodology. ASCE Journal of Water Resources Planning and Management 139 (6), 604–613. Fletcher, M., Liang, B., Smith, L., Knowles, A., Jackson, T., Jessop, M. & Austin, J. Neural network based pattern matching and spike detection tools and services in the CARMEN neuroinformatics project. Neural Networks 21, 1076–1084. Furber, S. B., Brown, G., Bose, J., Cumpstey, J. M., Marshall, P. & Shapiro, J. L. Sparse distributed memory using rankorder neural codes. IEEE Transactions on Neural Networks 18 (3), 648–659. Hodge, V. & Austin, J. A survey of outlier detection methodologies. Artificial Intelligence Review 22, 85–126. Hodge, V. & Austin, J. A binary neural k-Nearest Neighbour technique. Knowledge and Information Systems 8 (3), 276–292. Hodge, V., Lees, K. J. & Austin, J. A high performance k-NN approach using binary neural networks. Neural Networks 17 (3), 441–458. Hopfield, J. J. Neurons with graded response have collective computational properties like those of two-state neurons. Proceedings of the National Academy of Sciences of the United States of America (PNAS) 81 (10), 3088–3092. Jarrett, R., Robinson, G. & O’Halloran, R. On-line monitoring of water distribution systems: data processing and anomaly detection. In: Proceedings of the 8th Water Distribution System Analysis Symposium, Cincinnati, USA, August 27–30. Keogh, E., Lonardi, S. & Chiu, W. Finding surprising patterns in a time series database in linear time and space. In: Proceedings of the 8th ACM SIGKDD International Conference on Knowledge Discovery and Data Mining, July 23–26, 2002, Edmonton, Alberta, Canada, pp. 550–556. Keogh, E. & Smyth, P. A probabilistic approach to fast pattern matching in time series databases. In: Proceedings of the Third International Conference on Knowledge Discovery and Data Mining — KDD 97, pp. 24–30. Kosko, B. Bidirectional associative memories. IEEE Transactions On Systems, Man, And Cybernetics 18 (1), 49–60.
Journal of Hydroinformatics
|
16.3
|
2014
Leeder, A., Mounce, S. R. & Boxall, J. B. Analysis of multiparameter water quality data using event detection software on laboratory simulated events. In: Proceedings of WDSA 2012 Conference, Australia. Liang, B. & Austin, J. Improved high performance k-NN classifier using a binary neural network. In: Eighth International Conference on Engineering Applications of Neural Networks (EANN-03), Spain, pp. 148–153. Masters, T. Practical Neural Network Recipes in C þ þ. Academic Press, San Diego, CA. McKenna, S. A., Hart, D., Klise, K., Cruz, V. & Wilson, M. Event detection from water quality time series. In: Proceedings of World Environmental and Water Resources Congress, ASCE, Reston, VA. Misiunas, D., Vítkovský, J., Olsson, G., Simpson, A. & Lambert, M. Pipeline burst detection and location using a continuous monitoring of transients. Journal of Water Resources Planning and Management, ASCE 131 (4), 316–325. Mounce, R. B., Hollier, G., Smith, M., Hodge, V. J., Jackson, T. & Austin, J. A metric for pattern-matching applications to traffic management. Transportation Research Part C: Emerging Technologies 29, 148–155. Mounce, S. R. & Boxall, J. B. Implementation of an on-line artificial intelligence district meter area flow meter data analysis system for abnormality detection: a case study. Water Science and Technology: Water Supply 10 (3), 437– 444. Mounce, S. R., Boxall, J. B. & Machell, J. An artificial neural network/fuzzy logic system for DMA flow meter data analysis providing burst identification and size estimation. In: Water Management Challenges in Global Change (B. Ulanicki, K. Vairavamoorthy, D. Butler, R. Bounds & F. Memon, eds). Taylor and Francis, London, pp. 313–320. Mounce, S. R., Boxall, J. B. & Machell, J. Development and verification of an online artificial intelligence system for burst detection in water distribution systems. Journal of Water Resources Planning and Management 136 (3), 309–318. Mounce, S. R. & Machell, J. Burst detection using hydraulic data from water distribution systems with artificial neural networks. Urban Water Journal 3 (1), 21–31. Mounce, S. R., Mounce, R. B. & Boxall, J. B. Novelty detection for time series data analysis in water distribution systems using Support Vector Machines. Journal of Hydroinformatics 13 (4), 672–686. Olsson, G. Water and Energy: Threats and Opportunities. IWA Publishing, London. Palau, C. V., Arregui, F. J. & Carlos, M. Burst detection in water networks using principal component analysis. Journal of Water Resources Planning and Management 138 (1), 47–54. Parliamentary Office of Science and Technology Water in Production and Products. POSTnote 345. Romano, M., Kapelan, Z. & Savic´, D. A. Geostatistical techniques for approximate location of pipe burst events in
632
S. R. Mounce et al.
|
Pattern matching and associative ANNs for WDS time series analysis
water distribution systems. Journal of Hydroinformatics 15 (3), 634–651. Romano, M., Kapelan, Z. & Savic´, D. A. Automated detection of pipe bursts and other events in water distribution systems. Journal of Water Resources Planning and Management 140 (4), 457–467. Available from: http://ascelibrary.org/doi/abs/ 10.1061/(ASCE)WR.1943-5452.0000339. Solomatine, D. Data-driven modelling: paradigm, methods, experiences. In: Proc. 5th International Conference on Hydroinformatics. pp. 1–5. http://www.unesco-ihe.org/hi/hi/ staff/sol/HI2002-DDM-76transp.pdf. Weeks, M., Hodge, V., O’Keefe, S., Austin, J. & Lees, K. Improved AURA k-Nearest Neighbor approach. In: Proceedings of IWANN–2003, International Workconference on Artificial and Natural Neural Networks, Mahon, Menorca, Balearic Islands, Spain. Lecture Notes in Computer Science (LNCS) 2687, Springer Verlag, Berlin. Willshaw, D. J., Buneman, O. P. & Longuet-Higgins, H. C. Non-holographic associative memory. Nature 222, 960–962.
Journal of Hydroinformatics
|
16.3
|
2014
Wu, Z. Y., Farley, M., Turtle, D., Kapelan, Z., Boxall, J. B., Mounce, S. R., Dahasahasra, S., Mulay, M. & Kleiner, Y. Water Loss Reduction (Z. Wu, ed.). Bentley Systems, Exton, PA. Xu, D. L., Liu, J., Yang, J. B., Liu, G. P., Wang, J., Jenkinson, I. & Ren, J. Inference and learning methodology of beliefrule-based expert system for pipeline leak detection. Expert Systems with Applications 32, 103–113. Ye, G. & Fenner, R. Kalman filtering of hydraulic measurements for burst detection in water distribution systems. ASCE Journal of Pipeline Systems Engineering and Practice 2 (1), 14–22. Zhang, Z., Jiang, J., Liu, X., Lau, R., Wang, H. & Zhang, R. Real time hybrid pattern matching scheme for stock time series. ADC ’10 Proceedings of the Twenty-First Australasian Conference on Database Technologies 104, 161–170. Zhou, P., Austin, J. & Kennedy, J. Chapter 9, Online monitoring and detection. A high performance k-NN classifier using a binary correlation matrix memory (M. J. Kearns, S. A. Solla & D. A. Cohn eds). In: Advances in Neural Information Processing Systems, Vol. 11. MIT Press, CA.
First received 13 May 2013; accepted in revised form 13 August 2013. Available online 8 October 2013