Volume 4, June 2012
Journal of Physical Sciences and Innovation © 2012 Cenresin Publications www.cenresinpub.org
PERFORMANCE EVALUATION OF UNSUPERVISED NEURAL NETWORK IN FRAUD DETECTION *Ismaila W.O. 1 Alese B. K.2 Adeosun O. O.1 Arulogun O. T. 1 1
Ladoke Akintola University of Technology, Ogbomoso. 2 Federal University of Technology, Akure.
[email protected]
ABSTRACT Despite significant efforts by merchants, card issuers and law enforcement to curb fraud, online fraud continues to plague electronic commerce web sites. More advanced solutions are desired to protect merchants from the constantly evolving problem caused by fraud. The supervised machine learning technique for the most well known fraud detection algorithms makes them inadequate for an online system. This paper presents an automated credit card fraud detection system based on the unsupervised neural network technology. The proposed system is based on Self-Organizing Map algorithm that creates a model of typical cardholder’s spending profiles to detect suspicious transactions. The results were evaluated with performance metrics to determine its effectiveness. Keywords: Payment System, Credit card, Spending profiles, Fraud Detection, Self Organizing Map. INTRODUCTION For some time, there has been a strong interest in the ethics of banking as well as the moral complexity of fraudulent behavior. Fraud means obtaining services/goods and/or money by unethical means, and is a growing problem all over the world nowadays. Fraud deals with cases involving criminal purposes that, mostly, are difficult to identify. Credit cards are one of the most famous targets of fraud but not the only one. Furthermore, the face of fraud has changed dramatically during the last few decades as technologies have changed and developed. A critical task to help businesses and financial institutions including banks is to take steps to prevent fraud and to deal with it efficiently and effectively, when it does happen. Transactions are made with credit cards through payment systems (PS) viz; physical cards such as Automated Teller Machine (ATM) and Point-on Sales terminals (POS); virtual cards (card-not-present) such as phone, fax, Internet etc. Suk-Hoon and YongMoo (2009), Srivastava et al (2008). Nowadays, one of the most important and challenging problems for PS and its members becomes credit card fraud – the illegal use of credit cards by third parties. The fraud begins with either the theft of the physical card or the compromise of data associated with account, including the card account number or other information that would routinely and necessarily be available to a merchant during a legitimate transaction. That compromise can occur by many common routes and can usually be conducted without typing off the card holder’s merchant or the bank, at least until the account is ultimately used for fraud. Any PS is characterized by a high level of risk in its different domains caused by great volume and number of operations, a lot of complex relations between clients and increasing speed of data transmission. In order for detection and prevention of fraud to be effective, banks should develop and use in their practice special fraud detection systems targeted to 54
Performance Evaluation of Unsupervised Neural Network in Fraud Detection
Ismaila W.O., Alese B. K., Adeosun O. O. and Arulogun O.T.
reveal among stream of transactions the fraudulent ones and thus to prevent banks as well as their clients from the illegal activities of fraudsters. Zaslavsky and Strizhak (2006). Motivation Credit card fraud is the act of making purchase using someone else’s card credit card information. Sound like something that would be difficult to do, it has been realized that despite all the advantages and conveniences brought by the invention of credit card, fraudsters accomplish their mission through the aid of forged objects. The number of different variants of fraud is great enough, they change continuously, and new ways of fraud appear as far as protection of credit cards is improved. In the past, banks—members of PS— had solved fraud prevention problems by means of organizational measures: limits on number and amounts of cardholder’s operations, monitoring of transactions in high risk countries, use of various methods for card verification, etc. Several methods, which are supervised and unsupervised based, exist and have been used or employed to detect the fraud. (Aleskerov et al. 1997; Ghosh and Reilly 1994; Dorronsoro et al. 1997; Zaslavsky and Strizhak 2006). To process real-time data for classification, we consider SOMs to be best suited due to their high speed and fast conversion rates, as compared with other learning techniques Jon et al., (2008). In addition to this, SOMs also preserve topological mappings between representations, a feature which is preferred when categorizing fraud vs non-fraud for credit card data (Hamdan, 2010). Zaslavsky and Strizhak (2006) employed self-organizing maps to model and detect fraud credit card transactions in a simulated cardholder profile but the performance was not adequately evaluated with standard performance metrics and also the technique was based on fixed threshold. However, many classification systems developed were tested with performance metrics to establish their accuracy and relevance in the application domain. Azimi et al (2011) formalized SOMs to classify intrusion detection system alerts to reduce false positive alerts. Anitha, et al (2009) employed accuracy metric and convergence time to compare the performance of generic algorithm based SOMs and particle swarm optimization based SOM on an artificial neural network based abnormal retinal image classification system. Also, Weiming (2004) proposed self-organizing method for learning activity patterns for anomaly detection and activity prediction demonstrated the effectiveness with recognition rate, misdetection rate and false alarm rate metrics. METHODOLOGY
Self-Organizing Map One particularly interesting class of unsupervised system is based on competitive learning, in which the output neurons compete amongst themselves to be activated, with the result that only one is activated at any one time. This activated neuron is called a winner-takes all (WTA) neuron or simply the winning neuron. Such competition can be induced/implemented by having lateral inhibition connections (negative feedback paths) between the neurons. The result is that the neurons are forced to organise themselves. For obvious reasons, such a network is called a Self Organizing Map. The principal goal of an SOM is to transform an incoming signal pattern of arbitrary dimension into a one or two dimensional discrete map, and to perform this transformation adaptively in a topologically ordered fashion. Kohonen 55
Journal of Physical Sciences and Innovation
Volume 4, June 2012
(2001). When input vector (a pattern) is presented, a distance to each neuron's synaptic weights is calculated. The neuron whose weights are most correlated to current input vector is the winner. Correlation is equal to scalar product of input vector and considered synaptic weights. Only the winning neuron modifies it's synaptic weights to the point presented by input pattern. Synaptic weights of other neurons do not change. The learning process can be described by the following equation: Wi ← Wi + η (x – Wi) where i ϵ [0... number of neurons], Wi represents all synaptic weights of the winning neuron, η is learning rate and x stands for current input vector. The further the neighboring neuron is from the winner, the smaller the modification which is applied to its weights. This adaptation process can be described as: Wi ← Wi + η N(I, x)(x – Wi) for all neurons i that belong to winner's neighborhood. Wi stands for synaptic weights of neuron i and x is current input vector. η stands for learning rate and N(i, x) is a function that defines neighborhood. Classical Self Organizing Map (SOM) can be created when function N(i, x) is defined as:
where d(i, w) is Euclidean distance between winning and i-th neuron. λ is neighborhood radius. To train Kohonen SOM Euclidean distance between input vectors and all neural weights has to be calculated. Neuron that has the shortest distance to input vector (the winner) is chosen and it's weights are slightly modified to direction represented by input vector. Then neighboring neurons are taken and their weights are modified in the same direction. η and λ are multiplied with ∆η and ∆λ respectively during each learning iteration. These two last parameters are always less than one. Therefore, η and λ become smaller during learning process. At the beginning SOMs tries to organize itself globally and with following iterations it performs more and more local organization, because learning rate and neighborhood get smaller. John (2004). Basic SOM algorithm can be described as follows:
Procedure train_SOM begin randomize weights for all neurons for (i = 1 to iteration_number) do begin take one random input pattern find the winning neuron find neighbors of the winner modify synaptic weights of these neurons reduce the η and λ end end Mapping of PS database unto SOM Banks-members of PS keep databases (DB) of all their cards issued in PS. For each card, the database holds card number, account number, operational limits, current state of account 56
Performance Evaluation of Unsupervised Neural Network in Fraud Detection
Ismaila W.O., Alese B. K., Adeosun O. O. and Arulogun O.T.
(account balance) and some other data about the cardholder. Let Cn = {c1, …,ck,.., cn} be a set of records in DB that contains information about all cards used in PS; ck = (ck1,ck2,….ckm) is a record in DB, which contains information about the card ck and its component ck1 is a unique card number. The processing centre of PS constantly receives information about operations carried out by cardholders (such as cash withdrawal, balance statement, purchase, etc.). In the process of building fraud detection based SOM, we adopt the approach employed by Zaslavsky and Strizhak (2006). Cardholder’s profile Wck is a typical cardholder behavior model, which represents a generalized pattern of the transactions executed earlier by the holder of card ck. The components of the characteristics vector pi Pck cardholder’s transactions is divided into two parts viz; current transactions and transaction history. The characteristics pi1,…, pim of the current transaction xi Xck, which i Xck: are the values of the appropriate components x
The function I(xij ) is built using a statistics-based indexing method. Each symbolic value is associated with a numeric index according to its frequency in the training set, which is later used in the training of the neural network. Examples of characteristics pi,1…, pim are transaction amount, transaction time, transaction type, terminal number, terminal city, etc. The characteristics pim-1,pim+2,….,pim of the transaction history on card ck , calculated on the basis of the set of transactions Xck , executed earlier with card ck.. Examples of characteristics pi1,…, pim are the same with the characteristics of current transaction. The resultant set is the training set used for creating cardholder’s profile Wck. As a result of SOM learning with the training set Pck a matrix of neuron weights of the trained map is obtained, which is actually the cardholder’s profile for card ck.
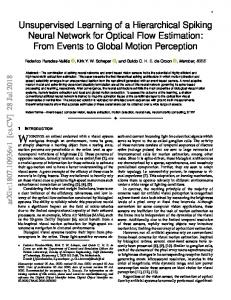
Design of SOM Algorithm This method adopts the algorithm proposed by Zaslavsky and Strizhak (2006) with little modification for transaction analysis as represented as a block diagram in Figure 1. The process of transaction monitoring consists of three stages: data accumulation, training (building of cardholder’s profile) and prediction stage. At the stage of data accumulation, the data about the transactions on card ck are collected in the database DB. If the size of Xck exceeds some predefined level, sufficient to build an adequate profile, then the monitoring process goes to stage two. At stage two, the training stage, the cardholder’s profile Wck is created as follows: i. The set Pck is built; ii. The neural network is trained on the basis of set Pck iii. The profile Wck is built as a result of training. After the training stage, the process goes to the stage of transaction control, which consists of the following: i. The vector Pn+1 is built and applied to every new transaction xn+1 ii. The current transaction xn+1 and the profile Wck is learned and predicted with SOM of neural network; 57
Journal of Physical Sciences and Innovation
Volume 4, June 2012
iii. If the output is zero then transaction xn+1 is considered legal and the vector xn+1 is added to the set Xck; iv. If the output is one then transaction xn+1 is considered fraud and is discarded.
Transaction x
n+1
Output Building & no = 0 n+1 p 3. training Prediction stage
yes legal
Figure 1: Block Diagram of SOM based Fraud Detection. fraud
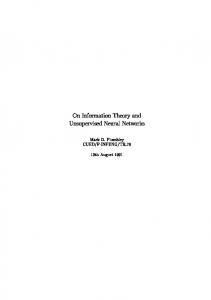
Discussion of results Transactional data is confidential information; therefore, the initial data set was simulated (a list of real transaction parameters and a range of their values were used). The following characteristics (features) were chosen to analyze the transactions: p1– transaction amount, p2 – transaction type, p3 – terminal identifier, p4 – city, p5 – country etc. The number of fraudulent transactions in a given length of mixed transactions is normally distributed with a user specified mean and standard deviation, taking cardholder’s spending behavior into account. Mean specifies the average number of fraudulent transactions in a given transaction mix and hence means for true positive (TP) and false positive (FP) were 0.5 and 1.0. In a typical scenario, an issuing bank, and hence, its payment system receives a large number of genuine transactions sparingly intermixed with fraudulent transactions. Standard deviation of TP was 0.1 and that for FP was 0.005. We set the target 95 percent Confidence Interval for TP and FP, respectively. By employing Srivastava et al (2008), the profile (l, m, h) consists of low spenders (l), medium spenders (m) and high spenders (h). The profiles are (80 10 10), (70 20 10), (55 35 10) and (34 33 33). For example, (80 10 10) profile means that there is 80% of low cost goods, 10% of medium cost and 10% of high cost of goods in a fifteen different transactions of a credit cardholder. We assume that the same results will be obtained if medium spenders or high spenders’ profiles dominate the transactions. The SOM of neural network in MATLAB 7.0 is employed for training and learning 400 historical data and for predicting processes, that is, every new transaction xn+1 on card ck is checked for fraud or legal. Figure 2 shows the results in form of a map (SOMs) of a cardholder’s profile after training. The clusters on the map show colour black represents legal and colour yellow represents fraud.
58
Performance Evaluation of Unsupervised Neural Network in Fraud Detection
Ismaila W.O., Alese B. K., Adeosun O. O. and Arulogun O.T.
Figure 2: SOM training of a Cardholder’s Behaviour Model (Cardholder 10) The results of the training are analysed by the metrics true positives rate, TPR, false positive rate, FPR, precision (prec) and accuracy (Accy). Table 1: Performance evaluation of credit card fraud detection system based SOMs (M. D. – Malicious Distribution)
95 3 2
M. D. 0.5 1.0
70 20 10
0.5 1.0
55 35 10
0.5 1.0
34 33 33
0.5 1.0
FP R 0.7 7 0.2 0.6 3 0.4 2 0.3 6 0.7 5 0.2 9 0.4 2
TP R 0.8 9 0.8 3 0.9 4 0.7 6 0.7 9 0.8 1 0.7 3 0.7 0
Pre c. 0.80
Acc y 0.75
0.9 5 0.76
0.8 3 0.76
0.79
0.74
0.89
0.80
0.70
0.63
0.79
0.74
0.69
0.65
From table 1, it can be seen that the fraud detection based SOM produced false-positive rates that decrease as the rate of transactions intermix increase at malicious distribution of 0.5, and when malicious distribution is 1.0, false-positive rates increase as the rate of transactions intermix increase except at profile 34 33 33 that produced 0.42 lower that 59
Volume 4, June 2012
Journal of Physical Sciences and Innovation
profile 55 35 10. The system produces a highest TPR of 0.94 at profile 70 20 10 with M.D. of 0.5 and least TPR of 0.70 at profile 34 33 33 with M.D. of 1.0. Also, the fraud system produces 0.95 and 0.83 for precision and accuracy respectively at profile 95 3 2 with M.D. of 1.0. CONCLUSION Conclusively, applications and transactions can be falsified by humans. In the case of application fraud, these fraudsters apply for insurance entitlements using falsified information, and apply for credit cards services using non-existent identity information or someone else’s identity information. In the case of transactional fraud, these fraudsters take over or add to the usage of an existing legitimate credit account. However, SOM’s goal is to simulate/model a cardholder spending profile in order to detect fraud in credit card transaction. The results of the fraud detection system based SOM looks encouraging as being analysed by different performance metrics. However, further study can include how its performance can be compared with other fraud detection methods and also how its inclusion in meta-classifier can improve the effectiveness of the fraud system. REFERENCES Aleskerov, E., Freisleben, B. & Rao, B. (1997). CARDWATCH: A Neural Network-Based Database Mining System for Credit Card Fraud Detection. Proc. of the IEEE/IAFE on Computational Intelligence for Financial Engineering, 220-226. Anitha J., C. Kezi S. Vijila and D.J. Hemanth (2009). Comparative Analysis of Genetic Algorithm & Particle Swarm Optimization Techniques for SOFM Based Abnormal Retinal Image Classification, International Journal of Recent Trends in Engineering, Vol 2, No. 3. Azimi A, Ahrabi A., Navin H., Bahrbegi H.,(2011). “A New System for Clustering & Classification of Intrusion Detection System Alerts Using SOM”, International Journal of Computer Science & Security, Vol: 4, Issue: 6, pp-589-597, 2011. Dorronsoro, J., Ginel, F., Sanchez, C. & Cruz, C. (1997). Neural Fraud Detection in Credit Card Operations. IEEE Transactions on Neural Networks 8(4): 827-834. Ghosh, S. & Reilly, D. (1994). Credit Card Fraud Detection with a Neural Network. Proc. of 27th Hawaii International Conference on Systems Science 3: 621-630. Hamdan.O., R. Md Noor, B. Zaidan, A. Zaidan (2010) Intrusion Detection System: Overview, Journal of Computing, Vol. 2, Issue 2, ISSN 2151-9617, https://sites.google.com/site/journalofcomputing/ John A. Bullinaria, (2004) Self Organizing Maps: Fundamentals, Introduction to Neural Networks: Lecture 16. 60
Performance Evaluation of Unsupervised Neural Network in Fraud Detection
Ismaila W.O., Alese B. K., Adeosun O. O. and Arulogun O.T.
Jon T., Quah S., Sriganesh M., (2008). “Real-time Credit Card Fraud Detection using Computational Intelligence”, Expert Systems with Applications, 35(4), pp.17211732. Kohonen T. (2001), Self-Organizing Maps, Springer, Berlin. Suk-Hoon C., YongMoo S., (2009) “Estimating the utility value of individual credit card delinquents”, Expert Systems with Applications, 36(2), pp.3975-3981. Srivastava A., Kundu A., Sural S., Majumdar A., (2008). Credit Card Fraud Detection Using Hidden Markov Model, IEEE Transactions on Dependable and Secure Computing, Vol. 5, No. 1. Weiming Hu, Dan Xie, Tieniu Tan, and Steve Maybank. (2004). Learning Activity Patterns Using Fuzzy Self-Organizing Neural Network. IEEE Transactions on Systems, MAN, and Cybernetics—Part B: CYBERNETICS, vol. 34, no. 3, 1618-1626. Yue Zhou, Y., Yan, S., Huang, T.S. (2007): Detecting Anomaly in Videos from Trajectory Similarity Analysis. IEEE International Conference on Multimedia and Expo, 2007 14. Duque, D., Santos. Yeh H., Yang M. and Lee L., (2007). “An Empirical Study of Credit Scoring Model for Credit Card”, Proceedings of the Second International Conference on Innovative Computing, Information and Control, pp. 216-219. Zaslavsky V. and Strizhak A. (2006). Credit Card Fraud Detection using Self Organizing Maps Information & Security. An International Journal, Vol.18, 48-63.
61