Bulent Bolat and Tulay Yildirim. Electronics and Telecommunication Engineering Department. Yildiz Technical University, Besiktas, Istanbul 34349, Turkey.
Pakistan Journal of Information and Technology 2 (3): 250-255, 2003 ISSN 1682-6027 © 2003 Asian Network for Scientific Information
Performance Increasing Methods for Probabilistic Neural Networks Bulent Bolat and Tulay Yildirim Electronics and Telecommunication Engineering Department Yildiz Technical University, Besiktas, Istanbul 34349, Turkey Abstract: Through this paper, some performance increasing methods for probabilistic neural network (PNN) are presented. These methods are tested with the glass benchmark database which has an irregular class distribution. Selection of a good training dataset is one of the most important issue. Therefore, a new data selection procedure was proposed. A data replication method is applied to the rare events of the dataset. After reaching the best accuracy, a principal component analysis (PCA) is used to reduce the computational complexity of PNN. Better classification accuracy than the reference work using Bayesian EM model was achieved by PNN using these methods. Key words: Probabilistic neural networks, data replication, data selection, principal component analysis, active learning Introduction The PNN introduced by Specht (Specht, 1990) is essentially based on the well-known Bayesian classifier technique commonly used in many classical pattern-recognition problems. As an example for these problems, Goh (Goh, 2002) used a PNN as a classifier for evaluating seismic liquefaction potential. In another work, Avci and Yildirim (Avci and Yildirim, 2002) reported that PNN is the best classifier for Escheria Coli benchmark. Ganchev, Tsopanoglou, Fakotakis and Kokkinakis (Ganchev et al., 2002b) used a PNN for speaker recognition over fixed telephone channels. Ganchev, Fakotakis and Kokkinakis (Ganchev et al., 2002a) used a PNN as a classifier for a speaker verification system. Romero, Touretzky and Thibadeau (Romero et al., 1997) used a PNN for recognition of Chinese characters. Albanis and Batchelor (Albanis and Batchelor, 1999) used a PNN as a predictor for predicting long term ratings of bonds. Like E. coli dataset, glass dataset has a lot of difficulties during the classification task. The dataset has 214 instances divided into 6 classes, but class 5 has 13 instances and class 6 has only 9 instances which are rare events make the classification task harder. The previous results for the glass benchmark (Ruda and Snorasson, 1995; Holst, 1997; Agre and Koprinska, 1996; Ventura and Martinez, 1995) have been obtained by adaptive resonance theory (ART), Bayesian EM classifier, 1-nearest neighborhood (1-NN), correction neural network by case and C4.5. The most accurate one is Bayesian EM method with 87.7% accuracy. The main criticism of the PNN algorithm is the very rapid increase in memory and computing time when the dimension of the input vector and the quantity of training samples increase (Goh, 2002). In this work, to reduce the computational cost, a dimensionally reduction technique, 250
Pak. J. Inform. and Technol., 2 (3): 250-255, 2003 principal component analysis (PCA), was applied to the input vector. Furthermore, to increase the performance of PNN, a new data selection procedure and data replication were proposed. Probabilistic neural networks Consider a pattern vector x with m dimensions that belongs to one of two categories K1 and K2. Let F1(x) and F 2(x) be the probability density functions (pdf) for the classification categories K1 and K2, respectively. From Bayes’ decision rule, x belongs to K1 if F 1 (x) F 2 (x)
>
L1 P2
(1)
L2 P1
Conversely, x belongs to K2 if F 1 (x) F 2 (x)
>
L1 P2
(2)
L2 P1
where L1 is the loss or cost function associated with misclassifying the vector as belonging to category K1 while it belongs to category K2, L2
is the loss function associated with
misclassifying the vector as belonging to category K2 while it belongs to category K1, P1 is the prior probability of occurrence of category K1, and P 2 is the prior probability of occurrence of category K2. In many situations, the loss functions and the prior probabilities can be considered equal. Hence the key to using the decision rules given by (1) and (2) is to estimate the probability density functions from the training patterns (Goh, 2002). In the PNN, a nonparametric estimation technique known as Parzen windows (Parzen, 1962) is used to construct the class-dependent probability density functions for each classification category required by Bayes’ theory. This allows determination of the chance a given vector pattern lies within a given category. Combining this with the relative frequency of each category, the PNN selects the most likely category for the given pattern vector. Both Bayes’ theory and Parzen windows are theoretically well established, have been in use for decades in many engineering applications, and are treated at length in a variety of statistical textbooks. If the jth training pattern for category K1 is xj, then the Parzen estimate of the pdf for category K1 is
F 1 (x) '
1 (2B)m / 2 Fm n
n
( x !x j )T ( x !x j )
j'1
2 F2
j ex p !
(3)
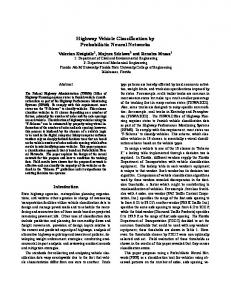
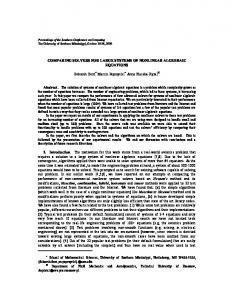
where n is the number of training patterns, m is the input space dimension, j is the pattern number, and F is an adjustable smoothing parameter (Goh, 2002). Figure 1 shows the basic architecture of the PNN. The first layer is the input layer which is represents the m input variables (x1, x2,...,xm ). The input neurons merely distribute all of the variables x to all neurons in the second layer. The pattern layer is fully connected to the input layer, with one neuron for each pattern in the training set. The weight values of the neurons in this layer are set equal to the different training patterns. The summation of the exponential 251
Pak. J. Inform. and Technol., 2 (3): 250-255, 2003
Fig. 1: The basic architecture of the PNN term in (3) is carried out by the summation layer neurons. There is one summation layer neuron for each category. The weights on the connections to the summation layer are fixed at unity so that the summation layer simply adds the outputs from the pattern layer neurons. Each neuron in the summation layer sums the output from the pattern layer neurons which correspond to the category from which the training pattern was selected. The output layer neuron produces a binary output value corresponding to the highest pdf given by (3). This indicates the best classification for that pattern (Goh, 2002). Principal component analysis In general, principal component analysis is a statistical method which can determine an optimal dimensional linear transformation matrix W such that given an input vector x, which is considered to be from a zero mean, wide sense stationary stochastic process, the data in x can be compressed according to Y= Wx
(4)
where y 0 Rmx1. Therefore, PCA projects the input data from the original n-dimensional vector space onto a m-dimensional output space, through the transformation matrix W. Dimensionally reduction is thus performed by PCA, where y contains most of the essential information that is resident in the input vector x (Ham, 2001).
252
Pak. J. Inform. and Technol., 2 (3): 250-255, 2003 Glass data benchmark Glass dataset (Murphy and Aha, 1994) was created in the Central Research Establishment, Home Office Forensic Science Service Reading, Berkshire. The dataset has 214 instances separated into 6 classes. Each instance in the dataset is identified by an id number, nine chemical measurements (where Ri: refractive index, Na: sodium, Mg: magnesium, Al: aluminum, Si: silicon, K: potassium, Ca: calcium, Ba: barium and Fe: iron. All measurements are weight percent in corresponding oxide except refractive index.) and a class number between 1 and 7. Class number 4 is reserved and never used in this dataset. Distribution of the dataset is given in the Table 1. Table 2 shows the recent works based on the glass data. Table 1: Class Distribution of Glass Database Class 1
Class 2
Class 3
Class 5
Class 6
Class 7
76
17
13
9
29
70
Total 214
Table 2: Recent Works Based on Glass Database Author
Network Type
Agre and Koprinska
Correction NN by case
Accuracy (%) 68.3
1-NN
78.8
Ventura and Martinez
C4.5
68
Holst
Bayesian EM
87.7
Ruda and Snorasson
ART Less then 65
Performance increasing methods A. Selection method of spread value and training set The classifying process consists of two steps. The first step is to find the optimal spread value. The optimum spread was found as 0.03 by a trial-and-error process. Second step of the classifying process is to find a good training set which can give a good accuracy both in training and testing. In this work, a trial-and-error method was proposed to choose the best training group. The process starts with a randomly chosen training set. After first training process, the test data was applied to the network. A randomly selected true classified instance in the training set (I1) is thrown into the test set and a wrong classified instance in the test set (I2) was put into the training set and the network was re-trained. If training accuracy was not improved or reduced, I1 and I2 were put into the original locations and the process was repeated by using another two instances. If the accuracy was improved, the exchange process was applied to another training and test pairs. The process was repeated until reaching the maximum training and test accuracy. B. Data replication method After finding the best training data, the rare events of the dataset were considered. Since the class 6 has only nine instances, it is hard to classify a test data if network is trained by using only six training data (70% of dataset is used as training data). For that reason, a data replication process is applied to raise the performance of the network. As seen in the Table 1, class 3 and
253
Pak. J. Inform. and Technol., 2 (3): 250-255, 2003 class 5 are the other rare events of the dataset. Data replication was also applied to these classes. C. PCA method After reaching the best accuracy, next task was to reduce the computational complexity. Since the easiest way of doing this is to reduce the size of the feature vector, a PCA was applied to the entire dataset. By applying PCA, length of the feature vector was reduced from 9 to 6 without any change of accuracy of the test set. Results The simulations were realized by using MATLAB 6.5 Neural Network Toolbox. 70% of the dataset is used as training data and 30% is reserved to the test set. After finding the best training data, the rare events of the dataset were considered. Class 3, 5 and 6 are the rare events of the glass dataset which have 17, 13 and 9 instances. The training data of the class 6 has been repeated four times and testing accuracy of class 6 was raised from 66 to 100%. As for class 5, testing accuracy raised to 100% by repeating the training set twice. As for class 3, training set was repeated three times and testing accuracy raised from 50 to 100%. Table 3 shows the distribution of the training and test sets after data replication. By applying PCA, size of the feature vector was reduced from 9 to 6. Accuracy of the entire training set is reduced from 100 to %98.67 after PCA operation, but accuracy of the test set was not changed. Table 4 shows the results for both training and test subsets before and after PCA. Accuracies of 98.67% for the training and 95.31% for test were achieved by improved PNN. Table 3: Instance Distribution of the Dataset after Replication Training Test Total Original
Class 1
Class 2
Class 3
Class 5
Class 6
49 21 70 70
52 24 76 76
39 4 43 17
20 3 23 13
24 3 27 9
Class 7 20 9 29 29
Table 4: Accuracy of PNN Class 1
Class 2
Class 3
Class 5
Class 6
Class 7
PCA
Training Test
100% 95.2%
100% 91.7%
100% 100%
100% 100%
100% 100%
100% 100%
No No
Overall Training Test
98.6% 97.9% 95.2%
97.4% 98.1% 91.7%
100% 100% 100%
100% 100% 100%
100% 100% 100%
100% 100% 100%
No Yes Yes
Overall
97.1%
96.1%
100%
100%
100%
100%
Yes
In this work, several performance rising methods were applied for PNN by using glass dataset. According to the simulation results, it is seen that the good selection of the training data boosts the accuracy of the network. Data replication also offers an improvement on the classes which have relatively less instance numbers. By using PCA, although dimension of the feature vector was
254
Pak. J. Inform. and Technol., 2 (3): 250-255, 2003 reduced, test performance was not changed. By applying all these methods for PNN, benchmark result using the Bayesian EM model was improved to the 95.31% correct classification rate. References Agre, G. and I. Koprinska, 1996, Case-based refinement of knowledge based neural networks, Proc. of the International Conference on Intelligent Systems: A Semiotic Perspective, Gaithersberg, MD, USA, pp: 221-226. Albanis, G.A. and R.A. Batchelor, 1999, Using probabilistic neural networks and rule induction to predict bond ratings, in Proc. of the 5th Annual Conference on Information Systems Analysis and Synthesis, M.Torres Ed., IIIS, Orlando. Avci, M. and T. Yildirim, 2002, Classification of E. coli bacteria by artificial neural networks, IEEE Int. Symposium on Intelligent Systems, Varna, Bulgaria, 3: 16-20. Ganchev, T., N. Fakotakis and G. Kokkinakis, 2002, Speaker verification system based on probabilistic neural networks, NIST Speaker Recognition Evaluation Workshop, Virginia, USA. Ganchev, T., A. Tsopanoglou, N. Fakotakis and G. Kokkinakis, 2002. Probabilistic neural networks combined with GMMs for speaker recognition over telephone channels, 14th Int. Conf. On Digital Signal Processing, Greece, 2: 1082-1084. Goh, T.C., 2002. Probabilistic neural network for evaluating seismic liquefaction potential, Can. Geotech. J., 39: 219-232. Ham, F.M., 2001. Principles of Neurocomputing for Science and Engineering, McGraw-Hill, NewYork, USA. Holst, A., 1997. The use of a bayesian neural network model for classification tasks, Dissertation Thesis at Stockholm University. Murphy, P.M. and D.W. Aha, 1994. UCI Repository of machine learning databases, Department of Information and Computer Science, University of California. Parzen, E., 1962. On estimation of a probability density function and model, Annals of Mathematical Statistics, 36: 1065-1076. Romero, R., D. Touretzky and R.H. Thibadeau, 1997. Optical Chinese character recognition using probabilistic neural networks, Pattern Recognition, 30: 1279-1292. Ruda, H. and M. Snorasson, 1995. Adaptive preprocessing for on-line learning with adaptive resonance theory (ART) networks, IEEE Workshop on Neural Networks for Signal Processing, Cambridge, Massachusetts, USA. Specht, D.F., 1990. Probabilistic neural networks, Neural Networks, 3: 109-118. Ventura, D. and T.R. Martinez, 1995. An empirical comparison of discretization methods, Proc. Tenth International Symposium on Computer and Information Sciences, pp: 443-450.
255