Platelet-based MPLE Algorithm for Denoising of SPECT Images: Phantom and Patient Study Abbas Takavar PhD1, HR Ghiasi MSc3, Naghmeh Alibabaei MSc2, Nader Riyahi-Alam PhD2, Armaghan Fard-Esfahani MD1, Mehdi Sohrabi MSc1, Ahmad Bitarafan Rajabi MSc3 1
Research Institute for Nuclear Medicine, 2Department of Medical Physics, Faculty of Medicine, Medical Sciences/University of Tehran, 3Department of Medical Physics, Tarbiat Modares University, Tehran, Iran (Received 20 April 2006, Revised 19 November 2006, Accepted 19 December 2006)
ABSTRACT Introduction: In this study the evaluation of a Platelet-based Maximum Penalized Likelihood Estimation (MPLE) for denoising SPECT images was performed and compared with other denoising methods such as Wavelets or Butterworth filtration. Platelet-based MPLE factorization as a multiscale decomposition approach has been already proposed for better edges and surfaces representation due to Poisson noise and inherent smoothness of this kind of images. Methods: We applied this approach on both simulated and real SPECT images. Monte Carlo simulations were generated with the SIMSET package to model the physical processes and instrumentation used in emission imaging. Cardiac, brain and NEMA phantom SPECT images were obtained using a single-head, Argus model SPECT system. The performance of this method has been evaluated both qualitatively and quantitatively with power spectrum, SNR and noise level measurements on simulated and real SPECT images. Results: For NEMA phantom images, the measured noise levels before (Mb) and after (Ma) denoising with Platelet-based MPLE approach were Mb=2.1732, Ma=0.1399. In patient study for 32 cardiac SPECT images, the difference between noise level and SNR before and after the approach were (Mb=3.7607, SNRb=9.7762, Ma=0.7374, SNRa=41.0848) respectively. Thus the Coefficient of variance (C.V) of SNR values for denoised images with this algorithm as compared with Butterworth filter, (145/33%) was found. For 32 brain SPECT images the Coefficient Variance of SNR values, (196/17%) was obtained. Conclusion: Our results shows that, Platelet-based MPLE is a useful method for denoising SPECT images considering better homogenous image, improvements in SNR, better radioactive uptake in target organ and reduction of interfering activity from background radiation in comparison to that of other conventional denoising methods. Key words: Platelets, MPLE, Denoising, SPECT. Iran J Nucl Med 2007; 15(27): 8-13 Corresponding Author: Naghmeh Alibabaei (MSc), Department of Medical Physics, Faculty of Medicine, Tehran University of Medical Sciences, Tehran, Iran. E-mail:
[email protected]
Takavar et al.
Platelet-based MPLE algorithm for denoising of SPECT images
INTRODUCTION In photon-limited applications such as PET, SPECT, Infrared (IR) imaging, astronomical imaging, and the basic problem is low S/N ratio compared to other imaging systems because of small number of detected photons. The sources of noise are low count level scatter, attenuation and electronic noises in the detector/camera (1). Maximum Likelihood Estimator (MLE) is the most popular tool for photon-limited image denoising but because of the noise in the imaging process, the MLE image appears noisy and has a large variance about its true mean. Also filtering of the MLE reduces the noise at the expense of blurring important details in image (edges in the image) (2). Willett et al proposed a multiscale approach for recovering edges and surfaces in photon limited medical imaging (3). Platelet-based maximum penalized likelihood criterion has been introduced for image denoising and deblurring in this field of imaging systems. A review of this method can be seen in appendix. METHODS
9
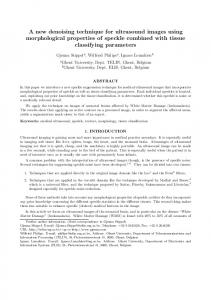
Fig 1 shows a typical high noise hot simulated phantom. All the phantoms were reconstructed by Filtered Back projection (FBP) algorithm using MATLB software (Fig 2).
Fig 1- Image of a hot simulated phantom: 1) without scattering image, 2) scattering image
a
b
c
d
Phantom Study We applied the platelet-based maximum penalized algorithm on two kinds of Phantoms and compared the results with wavelet and Butterworth filtration. Monte Carlo Simulated Phantoms All Monte Carlo simulations were generated with the SIMSET package to model the physical processes and instrumentation used in emission imaging (4, 5). We made hot and cold bar phantoms in both low noise state (high activity and big time of imaging) and high noise state (low activity and short time of imaging). For cold phantoms the target cylinder is 8cm long with a radius of 20cm that is filled with activated water (usually 20mCi of 99mTc). Inside, there is a cylinder with thickness of 8 .5 cm was all made of iron to indicate cold defect. For hot phantoms the target cylinder is 8cm long with a radius of 20cm filled with water. There is a cylinder with radius of 8.5 cm made of iron and filled by activated water to indicate hot defect.
Iran J Nucl Med 2007; Vol 15, No 27
Fig 2- (a) Reconstructed image of hot phantom, (b) denoised image of (a) with platelets, (c) reconstructed image of cold phantom, (d) denoised image of (c) with platelets.
The evaluation was performed quantitatively on phantom data with Power spectrum and noise level measurements between reconstructed image and denoised image with Platelet-based MPLE, wavelet and butterworth filtration. Estimation of the noise level can be made by Median Absolute Deviation method using:
1386 ﺳﺎل،27 ﺷﻤﺎره،15 دوره،ﻣﺠﻠﻪ ﭘﺰﺷﻜﻲ ﻫﺴﺘﻪ اي اﻳﺮان
10
σˆ =
Takavar et al.
1 MAD ({ d 0 . 6745
Platelet-based MPLE algorithm for denoising of SPECT images
j ,k
, 0 ≤ k ≤ 2 j })
(1)
In Eq (1), MAD is Mean Absolute Deviation and dj,k is the wavelet coefficients of the finest level. Real phantom We used the NEMA phantom which meets the specifications for measuring the system’s Line Spread Function according to NEMA protocol (Fig 3). Phantom consists of a cylindrical tank, (20.3 x 20.3 cm) diameter, made of acrylic with three stainless steel tubes with 200 mm height, 200±5mm diameter and 10±2 mm wall thickness. They were filled by 2 mCi of 99mTc in such as amount of counts were less than 20000 counts per second.
clinical practice about 20mCi of 99mTc is injected into patient.
RESULTS AND DISCUSSION Reviewing platelet analysis Platelets are localized atoms at various locations, scales and orientations that can produce accurate, piecewise image approximations to images consisting of smooth regions separated by smooth boundary(3). In Haar analysis the image is approximated on each cell of the partition by a constant. In platelet analysis it can be approximated with a planar surface by defining a platelet f(x,y) to be a function of the form
f s ( x , y ) = ( AS x + B S y + C S ) I S ( x , y )
(2)
Where AS , B S , C S ∈ IR, S is a dyadic square associated with a terminal node of an RP (Recursive Partition), and I S denotes the indicator function on S . Each platelet requires three coefficients, compared with the one coefficient for piecewise constant approximation. Fig 3- NEMA phantom
The tank was filled with water to provide proper gamma-ray scattering and was positioned in the way that the longitude axis of phantom was matched with the longitude axis of the bed of SPECT system and the longitude axis of detector rotation. Imaging was performed using a singlehead, Argus model SPECT system. Images were recorded over 360˚ in 128×128 matrices with an acquisition time of 5 seconds per projection. 32 SPECT images were obtained.
Image denoising By adding a penalizing function to the loglikelihood function in maximum likelihood criteria, Maximum Penalized Likelihood criteria are produced. The penalizing function measures the smoothness of the intensity image and assigns weaker penalties to smoother intensities and stronger penalties to more irregular intensities. Goal here is to maximize the penalized likelihood function Lγ ( μ ) ≡ log p ( x μ ) − γ {≠ θ }
(3)
Patient study 32 cardiac SPECT images were obtained using a dual-head, ADAC model SPECT system .A low energy general purpose collimator was used for this purpose. Images were recorded over 180˚ from 45˚ right anterior oblique to 45˚ left posterior oblique in 64×64 matrices with an acquisition time of 25 seconds per projection. In
Where p(x|µ) is the likelihood factorization ; γ is a smoothing parameter and {#θ} is the number of parameters in the vector θ. So, the MPLE is as following equation:
Iran J Nucl Med 2007; Vol 15, No 27
1386 ﺳﺎل،27 ﺷﻤﺎره،15 دوره،ﻣﺠﻠﻪ ﭘﺰﺷﻜﻲ ﻫﺴﺘﻪ اي اﻳﺮان
( Pˆ , θˆ) ≡ arg max Lγ ( μ ( P, θ )) p ,θ
(4)
Takavar et al.
Platelet-based MPLE algorithm for denoising of SPECT images
This yields a maximum estimator (MPLE). Larger smoother, less complex values of γ produce estimators.
penalized likelihood values of γ produce estimators; smaller more complicated
11
one study (6). Figures 4-5, show the results of Power Spectrum calculations for cold and hot phantom which show better denoising with platelet-based MPLE in compared with wavelet and butterworth filtration. As could be seen high frequency noise was removed well according to the original power spectrum whereas it remained in resulting image for butterworth filtration. Table 1 shows values obtained for noise level measurements for hot and cold phantoms.
(a) power spectrum of the cold phantom 1
Fig 5- Calculated power spectrum for reconstructed phantom (original) and denoised with platelet-based MPLE, wavelet and butterworth filtration of hot phantom.
0.8 0.6 0.4
Table 1- Noise level measurements for hot and cold simulated phantoms
0.2 0
0
20
40
(b)
60
Original
Butterworth
Plateletsbased MPLE
D4 wavelets
Cold
0.0733
0.0647
4.327e-004
0.0027
Hot
0.0698
0.0528
3.602e-004
0.0024
80
Fig 4- (a) Calculated power spectrum for reconstructed phantom and denoised with plateletbased MPLE, wavelet and butterworth filtration of cold phantom. (b) power spectrum of the main object.
Monte Carlo simulated phantoms Simulations were carried out with the number of simulation 10^5 and the activity 2mCi to simulate a high noise bar phantom .For all of the images in this study, we experimentally chose D4 Wavelets at level 2 .Also for butterworth filtration we chose butterworth filter with order 7 and cutoff frequency of 0.45 recommended in
Iran J Nucl Med 2007; Vol 15, No 27
Table 2- Results of mean of noise level for NEMA images
Mean of noise level SD
Original
Butterworth
Plateletsbased MPLE
D4 wavelets
2.3298
1.4380
0.0536
0.6989
±0.1750
±0.1040
±0.0154
±0.0705
1386 ﺳﺎل،27 ﺷﻤﺎره،15 دوره،ﻣﺠﻠﻪ ﭘﺰﺷﻜﻲ ﻫﺴﺘﻪ اي اﻳﺮان
12
Takavar et al.
Platelet-based MPLE algorithm for denoising of SPECT images
60
NEMA phantom For 32 images of NEMA phantom we calculated the Mean and Standard Deviation of noise level as shown in Table 2.
50
Heart
40
SNR
Patient study Cardiac SPECT images results for denoised images with 3 different techniques (Butterworth, Platelet-based MPLE and Wavelet) are shown in Fig 6. Results of measured noise levels and SNR values for cardiac SPECT images are shown in Fig 7. Also Table 3 shows the clinical evaluation of cardiac images by nuclear medicine specialists.
Brain 1:noisy image 2:butterworth 3:platelet-based MPLE 4:wavelet
Brain
30
Heart Brain
20 Heart 10
0
Heart
Brain
1
2 3 Deferent Methods Of Denoising
4
4.5 Brain
Measured values for Noise Level
4
1:noisy image 2:butterworth 3:platelet-based MPLE 4:wavelet
Heart
3.5 Brain
3 Heart
2.5 2
Brain
1.5
Heart
1
Heart
Brain
0.5
(a)
0
(b)
1
2 3 Deferent Methods Of Denoising
4
Fig 7- Results of measured noise levels and SNR values for cardiac SPECT images
CONCLUSION (c)
(d)
Fig 6- Cardiac SPECT image denoised with 3 techniques: (a) initial; (b) butterworth; (c) plateletbased MPLE; (d) wavelet
Table 3- Clinical evaluation of cardiac images by nuclear medicine specialists Original
Butterworth
Platelets-based MPLE
D4 wavelet
Very poor
good
Excellent
Acceptable
Iran J Nucl Med 2007; Vol 15, No 27
Our results showed that Platelet-based MPLE as a multiscale decomposition method is useful for denoising SPECT images considering improvements in representing edges and smooth regions, better homogenous image, better radioactive uptake in target organ and reduction of interfering activity from background radiation (statistical fluctuation) in compare with that of other conventional denoising methods. Wavelets and Butterworth filtration techniques do not perform well on this class of images with inherent smoothness and Poisson noise due to the quantum nature of the photon detection process.
1386 ﺳﺎل،27 ﺷﻤﺎره،15 دوره،ﻣﺠﻠﻪ ﭘﺰﺷﻜﻲ ﻫﺴﺘﻪ اي اﻳﺮان
Takavar et al.
Platelet-based MPLE algorithm for denoising of SPECT images
13
REFERENCES 1.
2.
3.
4.
5.
6.
Synder D, Miller M. Random Point Processes in Time and Space. New York: Springer-Verlag, 1991;67-69. Nowak RD, Hellman R, Nowak D, Bararduk RG. Wavelet domain filtering for nuclear medicine imaging. IEEE Trans Inform.1996; 45: 846-862. Willett R, Nowak R. Platelets: A Mutiscale Approach for Recovering Edges and Surfaces in Photon Limited Medical Imaging, IEEE Trans Med Imag. 2004; 22: 332-350 Harrison RL, Haynor DR, Gillispie SB, VAnnoy SD, Kaplan MS, Lewellen TK. A public-domain simulation system for emission tomography: photon tracking through heterogeneous attention using importance sampling. J Nucl Med. 1993; 42:34-60. Kaplan MS, Harrison RL, Vannoy SD. Coherent scatter implementation for SimSet, IEEE Trans Nucl SCI.1998; 45:3064-3068. Bitarafan Rajabi A, Rajabi H, Yaghoobi N, Rustgou F, Firouzabadi H. Filter selection for 99mTc – sestamibi myocardial perfusion SPECT imaging. Iran J Nucl Med. 2003; 15:13-16.
Iran J Nucl Med 2007; Vol 15, No 27
1386 ﺳﺎل،27 ﺷﻤﺎره،15 دوره،ﻣﺠﻠﻪ ﭘﺰﺷﻜﻲ ﻫﺴﺘﻪ اي اﻳﺮان