Population Studies for the Gate Matrix Layout Problem Alexandre Mendes1, Paulo França1, Pablo Moscato2 and Vinícius Garcia1 1
Faculdade de Engenharia Elétrica e de Computação Universidade Estadual de Campinas C.P. 6101, 13083-970, Campinas, Brazil {smendes, franca, jacques}@densis.fee.unicamp.br 2
School of Electrical Engineering and Computer Science University of Newcastle Callaghan, NSW, 2308, Australia
[email protected]
Abstract. This paper addresses a Very Large Scale Integrated (VLSI) design problem that belongs to the NP-hard class. The Gate Matrix Layout problem has strong applications on the chip-manufacturing industry. A Memetic Algorithm is employed to solve a set of benchmark instances, present in previous works in the literature. Beyond the results found for these instances, another goal of this paper is to study how the use of multiple populations and different migration strategies affects the algorithm’s performance. This comparison has shown to be fruitful, sometimes producing a strong performance improvement over single population approaches.
1 Introduction The use of multiple populations in Evolutionary Algorithms (EAs) gained increased momentum when computer networks, multi-processors computers and distributed processing systems (such as workstations clusters) became widespread available. Regarding the software issue, the introduction of PVM, and later MPI, as well as web-enabled, object-oriented languages like Java also had their role. As most EAs are inherently parallel methods, the distribution of the tasks is relatively easy for most applications. The workload can be distributed at an individual or a population level; the final choice depends on how complex are the computations involved. In this work we do not use parallel computers, or workstations networks. The program runs in a sequential way on a single processor, but populations evolve separately, simulating the behavior of a parallel environment. With several populations evolving in parallel, larger portions of the search space can be sampled, mainly because each population will inspect a different part of it. Furthermore, any important information found can be shared between them through migration of individuals. These factors make the parallel search much more powerful than the single populationbased one.
2
A VLSI Optimization Problem: Gate Matrix Layout
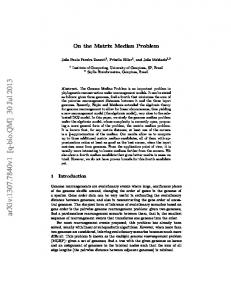
The Gate Matrix Layout problem is a NP-hard problem [3] that arises in the context of physical layout of Very Large Scale Integration (VLSI). It can be stated as: suppose that there are g gates and n nets on a gate matrix layout circuit. Gates can be described as vertical wires holding transistors at specific positions with nets interconnecting all the distinct gates that share transistors at the same position. An instance can be represented as a 0-1 matrix, with g columns and n rows. A number one in the position (i, j) means a transistor must be implemented at gate i and net j. Moreover, all transistors in the same net must be interconnected. The superposition of interconnections will define the number of tracks needed to build the circuit. The objective is to find a permutation of the g columns so that the superposition of interconnections is minimal, thus minimizing the number of tracks. The figure below shows a possible solution for a given instance, with 7 gates and 5 nets, and how to go from the 0-1 matrix representation to the circuit itself.
Fig. 1. The translation from a given instance’s solution into the real circuit.
In the example, the permutation of the columns was . After the interconnection of all transistors, represented by the horizontal lines, we calculate the number of tracks needed to build each gate. This number is the sum of positions used in each column. The number of tracks needed to build the circuit is its maximum. More detailed information on this problem can be found in [4].
3
Memetic Algorithms
Since the publication of John Holland’s book, “Adaptation in Natural and Artificial Systems”, the field of Genetic Algorithms, and the larger field of Evolutionary Computation, were definitely established as new research areas. Other pioneer works would also be cited, but since Holland’s work they became increasingly conspicuous in many engineering fields and in Artificial Intelligence problems. In the mid 80's, a
new class of knowledge-augmented GAs, also called hybrid GAs, began to appear in the computer science literature. The main idea supporting these methods is that of making use of other forms of “knowledge”, i.e. other solution methods already available for the problem at hand. As a consequence, the resulting algorithms had little resemblance with biological evolution analogies. Recognizing important differences and similarities with other population-based approaches, some of them were categorized as Memetic Algorithms (MAs) in 1989 [7][9]. 3.1 Population Structure It is illustrative to show how some MAs resemble the cooperative problem solving techniques that can be found in some organizations. For instance, in our approach we use a hierarchically structured population based on a complete ternary tree. In contrast with a non-structured population, the complete ternary tree can also be understood as a set of overlapping sub-populations (that we will refer to as clusters). In Figure 2, we can see that each cluster consists of one leader and three supporter individuals. Any leader individual in an intermediate layer has both leader and supporter roles. The leader individual always contains the best solution – considering the number of tracks it requires – of all individuals in the cluster. This relation defines the population hierarchy. The number of individuals in the population is equal to the number of nodes in the complete ternary tree, i.e. we need 13 individuals to make a ternary tree with 3 levels, 40 individuals to have 4 levels, and so on. n The general equation is (3 – 1)/2, where n is the number of levels.
Fig. 2. Diagram of the population structure.
Previous tests comparing the tree-structured population with non-structured approaches are present in [1]. They show that the ternary-tree approach leads to considerably better results, and with the use of much less individuals. In this work, we decided not to address this issue again due to space limitations. 3.2 Representation and Crossover The representation chosen for the VLSI problem is quite intuitive, with the chromosome being composed of alleles assuming different integer values in the [1, n] interval, where n is the number of columns of the associated 0-1 matrix. The crossover
tested is a variant of the well-known Order Crossover (OX) called Block Order Crossover (BOX). After choosing two parents, fragments of the chromosome from one of them are randomly selected and copied into the offspring. In a second phase, the offspring's empty positions are sequentially filled using the chromosome of the other parent. The procedure tends to perpetuate the relative order of the columns, although some modifications in this order might occur.
Fig. 3. Block Order Crossover (BOX) example.
In Figure 3, Parent A contributes with two pieces of its chromosome to the offspring. These parts are thus copied to the same position they occupy in the parent. The blank spaces are then filled with the information of Parent B, going from left to right. Alleles in Parent B already present in the offspring are skipped; being copied only the non-repeated ones. The average contribution percentage of each parent is set at 50%. This means that the offspring will be created using information inherited in equal proportion from both parents. The number of new individuals created every generation is two times the number of individuals present in the population. This crossover rate, apparently high, is due to the offspring acceptance policy. The acceptance rule makes several new individuals be discarded. Thus after several tests, with values from 0.5 to 2.5 we decided to use 2.0. The insertion of new solutions in the population will be later discussed (see section 3.6). 3.3 Mutation A traditional mutation strategy based on the swapping of columns was implemented. Two positions are selected uniformly at random and their values are swapped. This mutation procedure is applied to 10% of all new individuals every generation. We also implemented a heavy mutation procedure. It executes the job swap move 10.n times in each individual - where n is the number of gates - except the best one. This procedure is executed every time the population diversity is considered to be low, i.e. it has converged to individuals that are too similar (see section 3.6). 3.4 Local Search Local search algorithms for combinatorial optimization problems generally rely on a neighborhood definition that establishes a relationship between solutions in the
configuration space. In this work, two neighborhood definitions were chosen. The first one was the all-pairs. It consists of swapping pairs of columns from a given solution. A hill-climbing algorithm can be defined by reference to this neighborhood: starting with an initial permutation of all columns, every time a proposed swap reduces the number of tracks utilized, it is confirmed and another cycle of swaps takes place, until no further improvement is achieved. As the complexity to evaluate each swap is considerably high, we used a reduced neighborhood, where all columns are tested for a swap, but only with the closer ones. Following this, we try swapping all columns only with their 10 nearest neighbors, to the left and to the right. This number is not so critical, but we noticed a strong degradation in performance when values around 5 or lower were utilized. The second neighborhood implemented was the insertion one. It consists of removing a column from one position and inserting it in another place. The hillclimbing iterative procedure is the same regardless the neighborhood definition. In this case, we also utilized a reduced neighborhood. Each column was tested for insertion only in the 10 nearest positions. Given the large size of the all-pairs and insertion neighborhoods, and the computational complexity required to calculate the objective function for each solution, we found it convenient to apply the local search only on the best individual, located at the top node of the ternary tree, after each generation is completed. 3.5 Selection for Recombination The recombination of solutions in the hierarchically structured population can only be made between a leader and one of its supporters within the same cluster. The recombination procedure selects any leader uniformly at random and then it chooses - also uniformly at random - one of the three supporters. 3.6 Offspring Insertion into the Population After the recombination and the mutation take place, the acceptance of the new offspring will follow two rules: • •
The offspring is inserted into the population replacing the supporter that took part in the recombination that generated it. The replacement occurs only if the fitness of the new individual is better than the supporter.
If during an entire generation no individual was accepted for insertion, we conclude that the population has converged and apply the heavy mutation procedure. Moreover, after the each generation the population is restructured. The hierarchy states that the fitness of the leader of a cluster must be lower than the fitness of the leader of the cluster just above it. The adjustment is done comparing the supporters of each cluster with their leader. If any supporter is found to be better than its respective leader, they swap their places. Considering the problem addressed in this
work, the higher is the position that an individual occupies in the tree, the fewer is the number of tracks it requires to build the circuit it represents.
4
Migration Policies
For the study with multiple populations, we had to define how individuals migrate from one population to another. There are three population migration policies: • •
•
0-Migrate: No migration is used and all populations evolve in parallel without any kind of communication or solutions exchange. 1-Migrate: Populations are arranged in a ring structure. Migration occurs in all populations and the best individual of each one migrates to the population right next to it, replacing a randomly chosen individual – except the best one. Every population receives only one new individual. 2-Migrate: Populations are also arranged in a ring structure. Migration also occurs in all populations, but the best individual of each one migrates to both populations connected to it, replacing randomly chosen individuals – except the best ones. Every population receives two new individuals.
Fig. 4. Diagrams of the two migration policies.
5
Computational Tests
The population tests were executed in two different ways. The first one was to verify the influence of the number of populations on the algorithm’s performance. For this evaluation, the number of populations varied from one up to five. The second test evaluated the influence of migration, with the three migration policies being applied. The tests are divided into five instances and for each one we executed the whole set of configurations ten times. The stop criterion was a time limit, fixed as follows: 30 seconds for W2, V4470 and X0; 90 seconds for W3 and 10 minutes for W4. The difference between the maximum CPU times is due to the dimension of the instances and takes into account the average time to find high-quality solutions. If
larger CPU times were utilized, especially for the smaller instances, most configurations would return excellent results, weakening any performance comparison among them. In Table 1, we show some information on the instances we utilized in this work. We have one small, three medium and a large instance. In the literature it is difficult to find hard instances. In ref. [4], we found the most extensive computational tests, with a total of 25 instances. However, most of them were too small and easy to solve using the MA. Considering their sizes, only V4470, X0, W2, W3 and W4 had more than 30 gates and for this reason we concentrated our studies on them. Table 1. Information on the instances. Instance
Gates
Nets
W2 V4470 X0 W3 W4
33 47 48 70 141
48 37 40 84 202
Best known solution 14 9 11 18 27
Next we show the results of the MA implemented (see Tables 2 to 6). Four numbers are utilized to describe the results for each configuration (see Figure 5). In clockwise order we have: in boldface, the best solution found for the number of tracks for that instance. Next in the sequence, we display the number of times this solution was found in ten tries. Below it, there is the worst value found for the configuration, and finally, in the lower-left part of the cell, is the average value found for the number of tracks.
Fig. 5. Data fields for each configuration. Table 2. Results for the W2 instance. W2 1 0-Migrate 1-Migrate 2-Migrate
14 14.1
2 9 15
14 14.0 14 14.0 14 14.1
Number of populations 3 4 10 14 8 14 9 14 14.2 15 14.1 15 10 14 9 14 8 14 14.1 15 14.2 15 9 14 5 14 6 15 14.5 15 14.4 15
5 14 14.5 14 14.5 14 14.6
5 15 5 15 4 15
Table 3. Results for the V4470 instance. V4470 1 0-Migrate
2 2 11
9 10.1
1-Migrate 2-Migrate
9 10.0 9 10.1 9 9.9
Number of populations 3 4 1 2 10 9 10 10 10.0 11 10.0 10 2 1 2 9 9 11 10.0 11 9.9 11 2 1 1 9 9 11 10.2 11 10.1 11
5 9 11 8 11 6 11
10 10.1 10 10.2 10 10.4
Table 4. Results for the X0 instance. X0 1 0-Migrate
11 11.4
2 7 13
1-Migrate 2-Migrate
11 11.4 11 11.5 11 11.5
Number of populations 3 4 6 11 7 11 7 12 11.3 12 11.5 13 6 11 6 11 6 13 11.6 13 11.4 12 7 11 4 11 3 13 12.0 13 11.9 13
5 11 11.7 11 11.9 11 11.8
3 12 3 13 5 14
Table 5. Results for the W3 instance. W3 1 0-Migrate
18 21.1
2 1 26
1-Migrate 2-Migrate
18 20.1 18 20.0 18 20.2
Number of populations 3 4 2 18 1 19 1 23 20.1 22 20.3 22 3 18 1 18 2 23 20.1 23 20.2 22 1 18 2 18 1 23 21.1 25 20.3 23
5 19 20.8 18 20.0 18 21.3
2 22 2 22 1 23
Table 6. Results for the W4 instance. W4 1 0-Migrate 1-Migrate 2-Migrate
29 31.5
2 3 36
29 31.1 28 31.4 29 32.5
Number of populations 3 4 2 29 2 30 4 33 31.4 35 32.1 36 2 28 1 28 2 34 31.2 35 30.6 35 2 29 3 29 1 36 31.7 35 33.4 35
5 32 33.7 29 31.9 31 35.1
1 35 3 36 1 38
Firstly, we should explain two aspects of randomized search algorithms: exploitation and exploration. Exploitation is the property of the algorithm to thoroughly explore a specific region of the search space, looking for any small improvement in the current best available solution(s). Exploration is the property to explore wide portions of the search space, looking for promising regions.
With no migration, we observed more instability in the answers, expressed by worst solutions and averages found for the instances W3 and W4. On the other hand, the 1-Migrate appeared to better balance exploitation and exploration, with good average and worst solution values. The 2-Migrate policy did not perform so well, with a clear degradation of these two parameters. A too strong exploitation, in detriment of the exploration shall have caused this. Thus we concluded that migration should be set at medium levels, represented by the 1-Migrate. The second aspect to be analyzed is the number of populations. Although it is not clear what configuration was the best, the use of only one is surely not the best choice since several multi-population configurations returned better values. All the best values previously found in the literature, presented in Table 1, were reached by the MA, except the W4. An increase in the CPU time, from 10 to 60 minutes, trying to reach the 27-track value did not work out, too. That time limit was fixed after we verified that the best results for W4, presented in [5], took several hours to be found using an equipment which performance was comparable to ours. As even with a longer CPU time the algorithm did not succeed, we decided to enlarge the local search neighborhood, increasing the number of positions to be tested from 10 to 20 (see section 3.4). With this change the algorithm finally succeeded to find the best solution in three times out of ten. Table 7. Results for instance W4 with a 60-minute CPU time limit and the augmented local search neighborhood. Test # 1 2 3 4 5 6 7 8 9 10
6
Best solution found 27 28 29 29 27 29 28 31 27 28
CPU time required to reach the solution 2,141.0 1,791.9 855.7 532.4 1,788.7 560.8 1,791.0 2,908.1 3,002.5 600.9
Conclusions
This work presented a study on multiple-population approaches to solve the gate matrix layout problem. We used a Memetic Algorithm as the search engine. The results were very encouraging and the best multi-population configuration found was four populations evolving in parallel and exchanging individuals at a medium rate. The five instances utilized were taken from real-world VLSI circuit layout problems and the solutions rivaled with those previously found in the literature. Another strong point is that the method utilized is included in a framework for gen-
eral optimization called NP-Opt [6]. That means a general purpose MA was successful in solving a very complex optimization problem, competing head to head with a specific method, especially tailored for this problem. Future works should include the use of parallel techniques to distribute the populations and/or individuals through a computer network and the extension of this study to other NP problems to verify if the results hold as well.
Acknowledgements This work was supported by “Fundação de Amparo à Pesquisa do Estado de São Paulo” (FAPESP – Brazil) and “Conselho Nacional de Desenvolvimento Científico e Tecnológico” (CNPq – Brazil). The authors also thank Alexandre Linhares, for his relevant remarks and comments, and for providing us with the VLSI instances.
References 1. França, P. M., Mendes, A. S. and Moscato, P.: A memetic algorithm for the total tardiness Single Machine Scheduling problem. European Journal of Operational Research, v. 132, n. 1 (2001) 224-242 2. Hu, Y. H. and Chen, S. J.: GM_Plan: A gate matrix layout algorithm based on artificial intelligence planning techniques. IEEE Transactions on Computer-Aided Design, v. 9 (1990) 836-845 3. Lengauer, T.: Combinatorial algorithms for integrated circuit layout. John Wiley & Sons, New York (1990) 4. Linhares, A.: Synthesizing a Predatory Search Strategy for VLSI Layouts, IEEE Transactions on Evolutionary Computation, v. 3, n. 2 (1999) 147-152 5. Linhares, A., Yanasse, H. and Torreão, J.: Linear Gate Assignment: a Fast Statistical Mechanics Approach. IEEE Transactions on Computer-Aided Design on Integrated Circuits and Systems, v. 18, n. 12 (1999) 1750-1758 6. Mendes, A. S., França, P. M. and Moscato, P.: NP-Opt: An Optimization Framework for NP Problems. Proceedings of POM2001 - International Conference of the Production and Operations Management Society (2001) 82-89 7. Moscato, P.: On Evolution, Search, Optimization, Genetic Algorithms and Martial Arts: Towards Memetic Algorithms. Caltech Concurrent Computation Program, C3P Report 826. (1989) 8. Nakatani, K., Fujii, T., Kikuno, T. and Yoshida, N.: A heuristic algorithm for gate matrix layout. Proceedings of International Conference of Computer-Aided Design (1986) 324327 9. Moscato, P. and Norman, M. G.: A ‘Memetic’ Approach for the Traveling Salesman Problem. Implementation of a Computational Ecology for Combinatorial Optimization on Message-Passing Systems, Parallel Computing and Transputer Applications, edited by M. Valero, E. Onate, M. Jane, J.L. Larriba and B. Suarez, Ed. IOS Press, Amsterdam (1992) 187-194