Power Management using Model Predictive Control in a hydrogen-based microgrid 2 ' ' L. Valverde , C. Bordons , Member, IEEE, and F. Rosa I Energy Engineering Department, School of Engineering, University of Seville, Seville, Spain 2 System Engineering and Automation Department, School of Engineering, University of Seville, Seville, Spain
[email protected],
[email protected],
[email protected]
Abstract- Due to the intermittent feature of renewable energies, microgrids usually require additional energy sources to operate when the stored energy or the renewable energy supply is scarce or are not present. Then, hybrid systems obtained by combining several sources and means of storage can be used. In order to draw the best performance of such systems, a proper energy management is essential. A key factor is to try to adapt the energy production to the demand, where Model Predictive Control
(MPC)
and
supervision
techniques
can
play
an
important role. The problem is more interesting when several possibilities for necessary
to
using the produced
select
how
the
energy exist,
energy
is
and it
distributed
is
among
subsystems. Hence different objectives can arise (minimizing the use of conventional energy sources, energy saving, economic and quality aspects...). In
this
paper
a
supervisory
MPC
for
optimal
power
management and control in a hydrogen-based Micro-Grid (MG) is designed. The system operation under appropriate constraints is
also
taken
into
account
in
the
problem
formulation.
Simulations are carried out over experimentally validated models to demonstrate the goodness of the controller.
Keywords-
Microgrid,
model
predictive
control,
power
management, electrolyzer, electricity storage, fuel cell, hydrogen, metal hydride.
I. INTRODUCTION
M
ICROGRIDS comprising different types of renewable energies and hydrogen storage represent an area of growing interest due to the possibility to integrate clean and reliable power into to household and industries. It is clear that the proper decision making regarding operation of the system is closely related to the system efficiency. The mUltiple sources and loads in a MG make the efficient operation a rather complicated task. However it is commonly necessary to combine different kind of sources, loads and storage technologies in order to ensure both long-term and short-term energy storage. The combination of hydrogen and batteries configures the hybrid storage system where the key
978-1-4673-2421-2/12/$31.00 ©2012
IEEE
control parameter is usually the battery State Of Charge (SOC). Previous works in MG control are based on heuristic control algorithms, such us "hysteresis band control" [1]. Some authors consider other key parameters and control variants such as the hydrogen inventory level as the key control variable [2], but as long as the MG system involves more components, the control requests more complexity. Then, heuristic algorithm results a thorny issue. Fuzzy control gives some hope, due to contribute with more simple formulation control rules. Some experiences of fuzzy control report improvement in the system efficiency through intermediate decision levels [3], [4]. The results of the fuzzy controllers are satisfactory for keeping the batteries around a defmed SOC, although forcing the electrolyzer and the fuel cell (the necessary elements to storage and use hydrogen) to excessive intermittent operation. Since this has a very negative impact on their lifetimes, these constraints should be considered in the future control strategies. Model Predictive Control is a good candidate to solve this problem, since it integrates optimal control, control of processes with dead time, multivariable processes and it can use the future references when available. By using a strategy with finite control horizon allows the consideration of constraints and nonlinear processes [5]. Thus, MPC has been widely adopted in industry, although there are few works regarding MPC implementation in MGs. Zervas et al. [6] use MPC for energy scheduling on a hydrogen-based MG without batteries. Wei Qi et al. [7] apply MPC for renewable energy power management with battery storage in a water desalination plant. Another example is the work of Khalid [8], where MPC is performed for a plug-in renewable energy source with battery storage. The electrical power transferred to the network and stored are the control variables that are considered. Del Real et al. [9] present the application of hybrid modeling control for a Photovoltaic-fuel cell power plant. The aim of this paper is to contribute to applications of MPC techniques on MG hydrogen-based systems comprising hydrogen storage, batteries and grid connection. This paper is organized as follows. Section II describes the MG physical system. In section III the non-linear model for the plant is presented. The MPC control strategy design is
5669
TABLE II
addressed in section IV. Simulations to evaluate the controller are carried out in section V. Finally concluding remarks and future work are drawn in section VI.
NOMENCLATURE
Variable F U Irrad m MHL n p P I V Ts Subscripts ez dmd gen net
II. MICROGRID SYSTEM DESCRIPTION A block diagram of the system is shown in Fig. 1. The main energy source of this MG is a photovoltaic field (PV). The electricity produced is delivered to the load when possible. Excess power can be shunted to the electrolyzer and the battery bank to be stored for later use. If power is unavailable from the renewable source, back-up power sources (fuel cell and battery) continue delivering electricity to the loads. Additionally the grid connection allows power transfer enhancing more system reliability. Notice that by doing this, the MG can work in island mode or connected to the grid. A battery bank is commonly used for short-term energy storage due to its high round-trip efficiency and to take care of the effects caused by instantaneous load ripples/spikes, electrolyzer transients [10]. The electrolyzer is a Proton Exchange Membrane (PEM) type. The hydrogen production is stored in metal hydrides, which is a very suitable and safe medium of storage due to the low-pressure storing. A PEM fuel cell type uses the hydrogen to produce electricity. Converters are used as power interfaces allowing energy transfer between the different devices. All the units are connected through a DC bus whose voltage is held by the battery bank.
Irrad
� �
0
act ohm conc fc
description Faraday constant (C mor ) Vector of control actions Solar irradiance (W1m') Control horizon Metal hydride level (Nm') Number stack cells Prediction horizon Electric Power (W) Current (A) Voltage (V) Sample time (s) Electrolyzer Demand Generated Net power Open circuit Activation Ohmic Concentration Fuel cell
III. MICROGRID PLANT MODEL A.
Renewablepower source
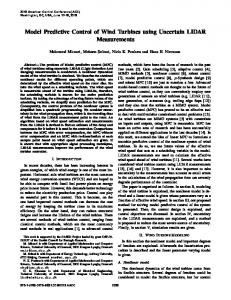
To calculate the power generated by the solar field from the irradiance input, the equations for a solar cell used in this paper have been taken from [11]. The PV-field equations aforementioned drive to obtain the V-I solar cell curve showed in Fig. 2. Since this equation is widely known and validated, the problem is not to elaborate an appropriate model, but the method for determining the model parameters.
1
l
7�----�----�----�--r=======� 1 --- 1000W/m2' 800W/m2 --- 500W/m2
storage
Fuel cell
�
Fig. I MG system Layout comprising Photovoltaic (PV) field as renewable energy source.
The MG depicted in Fig. 1 has been installed in the facilities of The School of Engineering from the University. Main equipment features are summarizing in Table I. For realistic control design purposes, the real equipment has been modeled and validated through experimental tests. TABLE I LABORATORY RENEWABLE ENERGY MG EQUIPMENT System component PEM Electrolyzer Metal hydride Storage PEM fuel cell Lead-acid Battery bank
Rated Capacity 0.23 Nm'lh, I kW 7 Nm3, 5 barg 1.5 kW, 20 NUm C12o=367 Ah
4f---- =�
1 L-----�----�--� o 10 15 20 25 v(V)
Fig. 2. Solar cell V-I curve for different irradiance values generated using the model.
The power produced by the PV-field is modeled as Pgen• Considering the power demand, the constraints referred to the net power available in the DC bus are set as:
Manufacturer HAMILTON-STD LABTECH MES-DEA EXIDE
Pnet
5670
=
Pgen - Pdemand
(1)
This value, called net power is the available power in the DC bus, which should be balanced through storage devices and the external grid for energy saving considerations. This power will not reach more than 6 kW, corresponding to the maximum PV-field power (emulated by an electronic power supply in the lab) and it will have a minimum of (-) 2.S kW, corresponding with zero generation and full demand. This value is set by the maximum power of the available electronic load in the lab. B.
Electrolyzer model
The electrolyzer's manufacturer provides the equation that expresses the hydrogen production rate as a function of the current consumption. This hydrogen production is given by:
C.
Fuel cell model
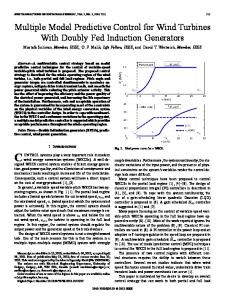
Concerning the fuel cell, the polarization curve represented in Fig. S is given by the equation: (3) It is based on the same and extensively general equation used in the literature. The experimental validation has been carried out based on the work of Del Real et al. [13], where an algorithm allows adapting the polarization curve to the specific fuel cell used.
"�"
65 .---�--�---, 60
(2)
activation
•• '"
55
0 � 5 � '"
�
_
o h mic res istance
45
concentration polarization
40 35
10
25
40
60
3
80
Fig.3. Hydrogen production curve: approximation data (blue solid +) and experimental data (red dashed line).
Also temperature dynamic behavior has been considered in the non-linear model. Fig. 4 shows the temperature effect in the V-I curve and therefore the electrolyzer power consumption is affected as it is described in [12].
Q) 1>0
1.6
Qj u
1.4
:::J "tl ' :;
1.2
iii '5 .S
....
2
.�.
Ii"
1 0
500
1000
'-� --c:' --, O ------"c O 2 0--�3 0,----4� 0 ---� 50 --�60-- 70 current (A.)
Fig. 5 V-I PEM fuel cell polarization curve: experimental data (x) and approximation (solid line).
Current (A)
�
0
7
bar
P
=
x
80 Q(
•
50 Q(
•
20 Q(
Fuel cell power constraints have also been considered for model set-up and control problem formulation. The fuel cell can deliver a maximum power of 900 W and the maximum power slew rate it is limited to 20 Wis. D.
Metal hydride model
The hydrogen storage is based on LaNiS metal hydrides alloy. The physical equipment comprises a cooling-heating water system for hydrogen absorption and desorption respectively. The mathematical model developed is a control oriented model, where theoretical equations [14] and experimental relations are used to obtain the semi-empirical model.
1500
Current density (A/m2) Fig. 4. V-I Electrolyzer curves at different temperatures.
Operational constraints must be described for control considerations. The electrolyzer power consumption is limited to 900 W due to manufacturer recommendations. Furthermore, at least a power of 100 W is strongly recommended to be fed to the electrolyzer in order to ensure safe electrolysis operation, avoiding flammable blends. The power rate constraint has been set to 20 Wis.
0 'o'----5�OO�-� = �� O --�3000 , OOO�� 15�OO--�20�O��2 time (5)
Fig. 6. Comparison between experimental (blue line) and mathematical model (red line) pressure inside metal hydride bed.
Metal hydride kinetics is highly dependent on heat transfer. Fig. 6 shows the hydrogen pressure inside the metal hydride
5671
where an impulse in water temperature inlet of 60°C is applied. E.
Battery bank model
The laboratory battery bank includes 24 mono-blocks of 2 V each one. The batteries are advanced stationary Lead-acid type, and with a total capacity of CI2o = 367 Ah. 70
deals with the second control level. The MPC will allow on line set-point calculation through optimization algorithms. The MPC control strategy has the inherit ability to handle efficiently constraints and uncertainties in multivariable dynamic systems. MPC computes at each discrete time instance the control action by solving a finite-horizon open loop optimal control problem.
'-�-��-�-��-�-rr==m=:Od:=.'el===]l -exp - step current (A)
60
Off-line calculation
Plant global controller.
Onboard equipment
Seasonal schedule
Power management
control (air flow control,
control
(With or without set
pressure control,
pOint calculations).
temperature, humidity ...
2: 40 E � 30 20 10
Fig. 8. Scheme of control levels in a MG system.
°0��������+ 5 ��6�������0' �� 11 Time (hour)
Fig. 7. Battery experimental voltage versus battery model voltage while discharging test is carried out.
The battery model validation has been carried out analysing the current step response. The results of the validation tests are shown in Fig. 7. The manufacturer prevents intensive use of the batteries and also to protect them from a deep discharging or overcharging. The batteries can support a peak current of Cs. But smooth operation is strongly recommended. To finalize with the plant model considerations, the converter efficiency curves have been taken into account in the plant model. However, static behaviour is assumed for the DC converters. This assumption can be done since the dominant dynamics (such as hydrogen production, hydrogen consumption, battery charging and discharging) are several orders of magnitude slower.
The supervisor control target is to determine the optimal operating power references for the electrolyzer (Pez) the fuel cell (Pre) and the power purchased or sold to the grid (Pgrid) as auxiliary power reservoir. The receding horizon guarantees that only the optimal values are applied to the system. In the MPC design, the following considerations have been explicitly taken into account: Protect the battery bank from deep discharging and overcharging; Limit the Power slew rate of the fuel cell and electrolyzer in order to protect such expensive equipment from intensive use; Take into account energy savings: Use the battery bank as first way of energy storage and using the hydrogen path for long-term energy mismatch. Smooth operation of all equipment is guaranteed by setting soft weights for tracking SOC references and Metal Hydride Level (MHL).
IV. MrCROGRID CONTROL PROBLEM FORMULATION AND
NON-LINEAR
CONTROLLER DESIGN A.
PLANT
Problem formulation
This section deals with the control problem formulation and approach. The overall control objective is set to satisfy the user power demand. As the renewable energy will typically differ from the local demand, the control must calculate the power reference signals to the electrolyzer, the fuel cell and the grid in order to balance the power generated and consumed by the loads. The second objective is that the controller should operate the plant under optimal considerations. The MPC computes the power references taking into account equipment duty cycles, operational constraints and energy savings.
---+
soc
---+
MHL
Pic +--
-
Pez +--
MPC
Pgrid+--
CONTROLLER
+-Pnet
{pgen - Pdem)
Fig. 9. Control Scheme.
The controller is designed to set Pnet to zero. In this way, the
B.
MPC design
In this section, the MPC controller for the MG power management is designed. It is based on Generalized Predictive Control formulation [5]. Notice that there are different levels in a MG control strategy that are shown in Fig. 8. This work
{ Pgen-Pdem } adds a perturbation on this variable that the
controller must balance using the rest of control variables (Pre, Pez, Pgrid) in order to track the reference outputs. All the constraints aforementioned can be summarized for the control problem formulation as:
5672
P ez,min
=
Ptc,min
=
Pgrid,min Pnet,min
100 W �
Pez
�
900 W
=
100 W ;:::
Pfc
;::: 900 W
=
(4)
Ptc,max
(5)
-10 kW ;::: pgrid ;::: 10 kW
=
-2500 W ;:::
=
Pez,max
;::: 6 kW
Pnet
=
Pgrid,max
=
(6) (7)
Pnet,max
Considering both equipment are PEM types, the constraints regarding the power slew rate for the manipulated variables can be formulated as: dPgrid,min d
�
=
-1000 W/s ;:::
;::: 1000 W/s
dPgrid
=
�
�=
dPfc,min
=
dPez,min
-20 W/s ;:::
dPfc
-20 W/s �
dPez
=
dPnet,min
-2500 W/s �
=
dPnet,max
;::: 20 W/s �
20 W/s
dPnet
�
(9)
dPfc,max
=
=
(10)
dPez,max
6000 W/s
(11)
And lastly the output variables constraints are imposed as follows: SOCmin
40 % �
=
MHLmin
0,1 Nm3 �
=
dSOCmin dSOCmax
SOC
=
�
85 % �
MHL
-4.16-3 SOC/s �
=
dSOC
�
=
=
-55 A �
Ibat
�
55 A
=
D.
Linearize plant model for control
The model presented in Section III has been transformed into state-space form through linearization. The non-linear equations have been linearizing over the working point of: SOCini= 70 % MHLini=3 Nm3
(13)
MHLmax
4.16-3
SOC/s
=
(l4a)
In fact, equation (14a) represents the constraint in the current drained or applied to the batteries: Ibatmin
technology. The grid has been more penalized intending to minor its use. The following four terms penalize the increments on manipulated variables and are set to �1=O.l; �2=1.5; �3=0.0001; �4=0.0001. Notice that the electrolyser power rate is the most bounded because experience advices to prevent frequent set point changes due to the removable source volatility. The last two weighting factors strongly configure the system behavior. These values are set to: Yl= 10; Y2= 10. They were set equal, for not to favor any of the control references more than the others. To finalize the controller set up, the parameters of sample time, prediction and control horizon must be chosen. For this controller, the values have been set to: Ts=l sec.; p=lO; m=2 . . It has been found that shorter sampling time do not give any advantage but heavy computational burden. In the same way, increasing the control horizon above the selected value does not improved the system response.
(12)
SOCmax
6,9 Nm3
PEM
Ibatmax
(14b)
Uini
Cost function
In this section, the cost function used in the MPC controller is presented.
[Ptc ,Pez, Pgrid, Pnet ]
rhHZ
=
=
0.00407778 -0.01202
.
Z
(
+ h SOCk - SOCret
) z + yz ( MHLk - MHLret ) z
(15)
Where N is the control horizon. In this cost function, the four first terms penalize the use of the manipulated variables. The manipulated variables weighting factors have been set to: ul=0.005; u2=0.005; u3=0. 008; u4=1O; Thus, the penalization of the Pnet variable drives the system to set Pnet to zero. Then the power balance is satisfied. The weighting factors choice allows some flexibility. Hence, they can be selected by trial and error approach. Fuel cell and electrolyser weighting factors have been chosen equal; due to both have the same
[100 - 200 200 2000]
.
Pez
Ptc
(16) (17)
The battery model has also linear behavior close to the working point. Consequently, the linearization model obtained approximates the original curve very well.
V.
d Pnet k
=
Regarding the electrolyzer and fuel cell, as it is shown in Fig. 3 and Fig. 5, they have almost linear behavior. Thus, the hydrogen consumption and production can be written as:
rhHZ c.
=
SIMULATIONS RESULTS
In order to evaluate the applicability and the behavior of the control on the MG, representative tests were conducted. The performance of the MG system was simulated over 24 hours for the examples of a sunny day and cloudy day. This allows to show the controller behavior when constraints are reached. For both case studies the SOC and MHL references were set to 75% and 3 Nm3 respectively. The performance of the MG is plotted in Fig. 10(a)-(d) for the sunny day case study.
MPC
5673
2�
1'-''-''-'''-''-''-''-''-''-''rc�CI� - Demand
2000
./
0
�
l
1
2
3
4
5
6
7
8
9
10
11
12
time
13
14
(hours)
15
16
17
I l
18
40 - 0 __ 19
ro
�
�
�
2
3
4
5
6
7
8
9 10 11 12 13 14 15 16 17 18 19 20 time (hours)
�
22 23
�
Fig. 10. MG power profiles and storage device levels during the sunny day case study
0
.�
·
1
(d)
�
-EZ - - Fe - Grid
�
�
/
(a)
"-
\...---
0
-'�
�
Battery current
---,
.'\
-PV
,�O:C---7,-,�,-,�,----:,;, ----: ---o- ,;--, ----! ---o- 1O;:---!;- "�,, ----!:"�,, ----!:,, ;-C;, , ----!:,,;-,C;-, ----!:",cc,o-, ----!: ,,---c"'�,,---' 11 ----! time (hours)
(b)
() 065 (f)
M3.4 E �3.3 --" I :::2;3.2
Fig. 10(a) shows that the net energy was positive for the fIrst stage of test. As Fig. 1O(c) shows, the SOC was growing up until the SOC upper limit is reached. Then the control actuated successfully switching the electrolyzer in order to control de SOC level while the demand was supplied as it can be seen in Fig. lO(b). Simultaneously, the controller transfers excess power to the grid in order to avoid the intensive use of the electrolyzer. Notice that at the second stage of the simulation the net power became negative. Thus, the battery was discharged until the SOC level was nearby the lower limit. Fig. 10(b) shows how the controller decided to switch on the fuel cell while at the same time the system took power from the grid in order to reach the reference. Fig. lO(d) indicates how the controller ensured the battery discharging and charging current limits. The cloudy day case study is performed in Fig. II(a)-(d). The weather conditions and the weight factors chosen prevented the system to reach the storage level references. Fig. II(a) shows a huge power mismatch event from power generated and demanded at simulation time of 10 hours. Thus, the MPC starts the fuel cell delivering power to the load. Fig. II(c) represents when the battery lower limit was reached. At this time, the fuel cell power was increased to prevent the battery degradation. - Demand -PV
o
1
2
3
4
5
6
7
8
9 10 11 12 13 14 15 16 17 18 19 20 21 22 23 24 Time (hours)
[ 1500
(C)
�
"- '000 o
l
I
10 11 12 13 14 15 16 17 18 19 20 21 22 23 24 time (hours)
(a)
5674
� Z - - FC Grid
I..... - l I I
-EZ - - FC - Grid
-
-
- - -=-\.- :::....::::..- ::....:::...:
,�,�,-� , ,,-,� , �,, �7 ,, �,, � ,,�,, � ,,�,� ,� ,,�� ro ,,�� � ��,�,� ',C==�===,� time (hours)
1000
0
1
2
3
4
5
6
7
8
9
10
11
(b)
0
1
2
3
4
5
6
7
8
13
14
15
16
17
18
19
�
�
�
23
24
(a)
70 35
12
time (hours)
0
,
2
3
4
5
�
7
a
g
05 . 0
,
2
3
4
5
6
7
a
g
,0
"
9
r: �
Time
(hours)
(b)
1.8
0
1
2
3
4
5
6
7
8
9
10
11
12
13
14
Time (hours)
15
16
17
18
19
20
21
22
23
24
Fig. 12. MG control variables (a) and storage device leves forcing tracking SOC level.
(C)
-
Notice that the MPC tracks very well the SOC reference of 75%. While at the same time a non-excessive use of the electrolyzer and the fuel cell is performed by the controller.
Battery curren!
VI. CONCLUSIONS
-35
0
1
2
3
4
5
6
7
8
9
10
11
12
13
14
time (hours)
15
16
17
18
19
�
�
�
23
24
(d) Fig. I I . MG power profiles and storage device levels during the cloudy day case study
Finally Fig. 12(a)-(b) shows a simulation performed for the same power profiles as in Fig lO(a), but the battery duty cycle is reduced by changing the weighting factor to 1,= 100. This forces the system to track the reference SOC level more encouraging.
In this paper, the MPC has been successfully applied for MG electric power management. The simulation results show smooth operation of equipment. This will benefit the equipment's lifetime while the power demand and operational constraints are always respected. Weighting factors enable to change the operational MG behavior. This allows protecting battery intensive use or electrolyzer and fuel cell intensive use. According to convenience, optimal agreement level can also be achieved. Future work will focus on experimental validation of the controller designed on this paper.
VII. ACKNOWLEDGEMENTS The authors acknowledge MCYT-Spain for funding this work DPI201O-21589-C05-01l03.
5675
VIII. REFERENCES
[1]
0. Ulleberg., "The Importance of Control Strategies in PV-hydrogen Systems", Solar Energy, no 76, pp. 323-329, 2001.
[2] D. Tpsakis, S. Voutetakisa, P. Seferlisa, F. Stergiopoulosa, "Energy
management in a stand-alone power system for the production of electrical energy with long term hydrogen storage", Computer Aided Chemical Engineering, pp. Pages 1125-1130, 2008.
[3] A. Bilodeau, K. Agbossou, "Control analysis of renewable energy
system with hydrogen storage for residential applications", Journal oj
Power Sources, no 162, pp. 757-764, 2006.
[4] E.M. Stewart et aI., "Modeling, analysis and control system
development for the Italian hydrogen house", International Journal oj
Hydrogen Energy, pp. 1638-1646, 2009.
[5] E.F. Camacho and C. Bordons, "Model Predictive Control, London: Springer-Verlag, 2004.
[6] P.L. Zervas, H. Sarimveis, lA. Palyvos, N. C.G Markatos, "Model
based optimal control of a hybrid power generation system consisting of photovoltaic arrays and fuel cells", Journal oj Power Sources, no 181, pp. 327-338, 2008 .
[7]
Wei Qi, Jinfeng Liu, Panagiotis D. Christofides, "Supervisory Predictive Control for Long-Term Scheduling of an Integrated Wind/Solar Energy Generation and Water Desalination System" IEEE Transc. oj control systems technology, vol. 20, no 2, pp. 504-512, 2012.
[8] M. Khalid, "A model predictive control approach to hte problem of
wind power smoothing with controlled battery storage" Renewable
Energy, pp. 1520-1526, 2010.
[9] A. Del Real, A. Arce, C. Bordons, "Hybrid model predictive control of
a two-generator power plant integrating photovoltaic panels and Fuel Cell" 46 IEEE Conference on Decision and Control, New Orleans, 2007.
[10] K. Agbossou, M. Kolhe, J. Hamelin, T.K. Bose, "Performance of a
stand-alone renewable energy system based on energy storage as hydrogen," Energy Conversion, iEEE Transactions on , vol.19, no.3, pp. 633- 640, Sept. 2004
[11] M. A. Garcia, Fundamentos, dimensionado y aplicaciones de la energia solar fotovoltaica", Editorial Ciemat, 2003.
[12] R. Garcia-Valverde, C. Miguela, R. Martmez-Bejarb, A. Urbinaa, "Optimized photovoltaic generatorewater electrolyser coupling through a controlled DC-DC converter" international journal oj hydrogen energy, vol. 33, pp. 5352 -5362, 2008.
[13] A. del Real, A. Arce, C. Bordons, "Development and experimental validation of a PEM fuel cell dynamic model"
Journal oj Power
Sources, n° 173, pp. 310-324, 2007.
[14] M. Raju, lP. Ortmann, S. Kumar, "System simulation model for high
pressure metal hydride hydrogen storage systems", international
journal oJhydrogen Energy, pp. 1-13, 2010.
5676