Projections from primary visual cortex to cytochrome oxidase thin stripes and interstripes of macaque visual area 2 Youping Xiao* and Daniel J. Felleman† Department of Neurobiology and Anatomy, University of Texas Medical School, Houston, TX 77030
It has been controversial whether the cytochrome oxidase (CO)dense blobs in primate primary visual cortex (V1) and CO-dense thin stripes in visual area 2 (V2) are parts of a cortical colorprocessing stream that is segregated from other functional streams. One of the key pieces of evidence for the segregated color stream is the previous report of specific connections between blobs and thin stripes, which is parallel to the connections between interblobs and interstripes. To study the degree of the segregation between the proposed different streams, in the current study, anatomical tracers were injected into different V2 compartments with the functional guidance of optical imaging. The spatial relationship between each labeled cell and the CO blobs in V1 were analyzed quantitatively. After tracer injections in the color-preferring modules in CO thin stripes, equal amounts of labeled cells were found in the blobs and interblobs. However, the density of the labeled cells was more than twice as high in the blobs as that in the interblobs, and most of the clusters of labeled cells partially overlapped with the blobs. Tracer injections in the interstripes labeled cells predominantly in the interblobs. Our results suggest that both the blobs and interblobs project to the thin stripes and call into question the proposition that different CO compartments in V1 and V2 are connected in parallel to form highly segregated functional streams.
T
he primate primary visual cortex (V1) and second visual area (V2) comprise regions of various cytochrome oxidase (CO) activity, which may subserve different functions (1). In V1, layers 2 and 3 are composed of CO-dense patches (blobs) and regions surrounding them (interblobs) (2–4). V2 is composed of alternating thin and thick CO-dense stripes and the pale interstripe regions between them (5, 6). Early studies have shown that most cells in the blobs and thin stripes were unoriented and selective for color, whereas most cells elsewhere were oriented and not selective for color (7, 8). Anatomically, thin stripes and interstripes receive V1 projections from blobs and interblobs in layers 2 and 3, respectively, whereas thick stripes received projections from layer 4B (8–10). Intrinsic horizontal connections in supragranular layers of V1 preferentially connect blob with blob, or interblob with interblob (11). Based on these findings, it has been proposed that color is processed in the blob–thin-stripe stream that is segregated from other functional streams (1, 9). However, several subsequent studies have contradicted the one-to-one relationship between color processing and the stream originating in the blobs. In V1, Leventhal et al. (12) did not find differences in color and orientation selectivity between blob and interblob cells. Similarly, Lennie et al. (13) found no difference in chromatic selectivity between blob and interblob cells. Ts’o and Gilbert (14) reported cells near blob borders that were selective to both orientation and color. Using both optical and electrical recording, Landisman and Ts’o (15, 16) reported patches in V1 that were preferentially activated by chromatic stimulation and contained color-selective cells. These color patches were spatially associated with blobs in a somewhat loose sense and often enclosed interblob regions. Of their electrode www.pnas.org兾cgi兾doi兾10.1073兾pnas.0402052101
penetrations that encountered color-selective cells, 29% were located outside blobs. In V2, color-selective cells and orientation-selective cells were found in all three types of CO compartments (7, 17–22). In these studies, the percentage of color-selective cells in thin stripes ranged from 27% to 86%, whereas the percentage of orientation-selective cells ranged from 20% to 73%. In almost every study, however, the percentages of the color-selective cells and unoriented cells were higher in thin stripes than in other CO compartments. Studies by using optical imaging or the 2-deoxyglucose technique revealed V2 modules that preferred chromatic to achromatic stimulation or were more activated by diffuse color stimuli than other V2 regions (19, 23–25). These V2 color-preferring modules were centered in regions that were devoid of orientation-selective columns as revealed by optical imaging. They were colocalized with CO thin stripes but were not registered with the latter exactly (19). More recently, we found a spatially organized representation of color in and beyond the color-preferring modules in V2 (25). Isoluminant gratings of different colors elicited V2 responses that peaked at different locations in or near the color-preferring modules. Significantly, the peak locations were arranged across the cortical surface in the same order as their activating colors were organized in perceptual color space, suggesting an important role of the color-preferring module in color processing. More recent studies on the intrinsic horizontal connections in V1 also called into question the strict segregation of the blob and interblob streams. Although the intrinsic connections between similar CO compartments predominate, there are significant connections between blobs and interblobs (26, 27). So far, studies of the connections between V1 and V2 have suggested a segregated stream from blobs to thin stripes (9, 10, 28), although the more recent study found no laminar difference in the origin of the V1 projections to different V2 compartments (28). However, the conclusions of both studies were based on the distributions of the densely labeled patches after nonphysiologically guided tracer injections into V2. In the current study, we injected tracers in thin CO stripes or interstripes after visualizing the color-preferring modules with optical imaging and examined the spatial relationship between each labeled cell and blobs. We found that both blobs and interblobs in V1 contain cells that project to the thin stripes in V2, and these results thus challenge the existence of a highly segregated stream from blobs to thin stripes. Methods Experiments were conducted in 15 juvenile macaque monkeys (Macaca fascicularis). All procedures were approved by the local Abbreviations: CO, cytochrome oxidase; BDA, biotinylated dextran amine; FR, rhodamineconjugated dextran amine; V1, primary visual cortex; V2, second visual area; c兾d, cycle per degree; c兾s, cycle per sec. *Present address: Department of Ophthalmology, Mount Sinai School of Medicine, One Gustave L. Levy Place, New York, NY 10029. †To
whom correspondence should be addressed. E-mail:
[email protected].
© 2004 by The National Academy of Sciences of the USA
PNAS 兩 May 4, 2004 兩 vol. 101 兩 no. 18 兩 7147–7151
NEUROSCIENCE
Communicated by Jon H. Kaas, Vanderbilt University, Nashville, TN, March 24, 2004 (received for review January 4, 2004)
institutional Animal Welfare Committee and were in compliance with National Institutes of Health guidelines. A more detailed description of the methods has been published (24). Recording and injection sessions were carried out under sufentanil anesthesia (6–12 g兾kg per h). Paralysis was induced and maintained by infusion of pancuronium bromide (0.05 mg兾kg per h). The monkey was artificially respired and its physiology was maintained in the normal range. Optical Imaging. The intrinsic optical signal, derived from 630 (⫾
15) nm light reflected from the exposed cortical surface, was recorded during various visual stimulation conditions. The cortical surface was imaged by using a slow-scan CCD array camera (Photometrics, Tucson, AZ) through a tandem lens system (29). The data consist of a series of 8–10 frames (two frames per sec) of the cortical surface (focused 300–600 m below the surface), beginning before stimulus presentation and continuing 3 sec into the stimulation period. Each stimulus lasted 3 sec, and an interstimulus interval of 10 sec allowed cortical activity to return to baseline conditions. These image sequences were repeated 50–100 times per stimulus and were averaged. The CO thin stripes in V2 were located by using their preferences for low spatial frequency, isoluminant chromatic gratings. An average response was calculated during the binocular presentation of red兾green isoluminant gratings of different orientations [square wave, 0.25 cycle per degree (c兾d), drifted at 1 cycle per sec (c兾s), with a mean luminance of 8–26 cd兾m2, orientations included: 0°, 90°, 45°, 135°]. The average response to achromatic luminance gratings of high spatial frequency (sinusoidal, 2 c兾d, 2 c兾s, 8–26 cd兾m2 mean luminance, ⬇95% contrast) was subtracted from the average color response. This difference was divided by the average background response to generate the final differential image. To ensure that the activated regions in a color-luminance differential image were color-preferring modules in thin stripes, two additional sets of differential images were calculated. One set was derived from the low-contrast luminance gratings (0.25 c兾d, 2.5 c兾s, 7% contrast) vs. high-contrast gratings (2 c兾d, 2 c兾s, ⬇95% contrast). The other set was derived from gratings of orthogonal orientations. The pattern of ocular dominance in V1 was revealed by the differential image of stimulating left eye vs. right eye and was used to determine the V1兾V2 border. Tracer Injections and Tissue Processing. Tracer injections were made into V2 by using the functional images recorded 2 wk earlier for guidance. The locations of the injections relative to CO compartments were finally determined on V2 sections stained for CO. In each case, iontophoretic injections of biotinylated dextran amine (BDA; Molecular Probes, 10% in 0.01 M phosphate buffer, pH 7.4; 6 A for 10–30 min), rhodamineconjugated dextran amine (FluoroRuby or FR; Molecular Probes, 10% in 0.1 M phosphate buffer, pH 7.4兾8 A for 10–30 min), and Fast blue (Sigma, 1% in 0.1 M cacodylate buffer, pH 7.4兾4.5 A for 10 min) were made into V2 by using glass micropipettes with internal tip diameters of 10–30 m. The injection current was delivered in cycles of 7 sec on and 7 sec off. After injections were completed, the monkeys were recovered from anesthesia and lived for an additional 16 days to allow the tracers to be transported. Then, the monkey was deeply anesthetized with Nembutal (75–100 mg兾kg, i.v.) and perfused intracardially with saline followed by 4% paraformaldehyde in 0.1 M phosphate buffer (pH 7.4). In most cases the fixative was washed out with phosphate buffer containing a graded series of glycerin (0–10%). After the brain was removed from the skull, the occipital operculum was dissected and gently pressed between glass slides, was briefly postfixed in the final cryoprotective solution, and was later sectioned in the tangential plane. Frozen sections were cut at a thickness of 40–50 m. For the demonstration of fluorescent-labeled cells, unstained sections 7148 兩 www.pnas.org兾cgi兾doi兾10.1073兾pnas.0402052101
were mounted on subbed slides, air-dried, and coverslipped. The pattern of CO activity in V1 and V2 was demonstrated according to Wong-Riley and Carroll (2). In brief, free-floating sections were incubated in a large volume of oxygenated reaction mixture (4 g of sucrose兾20 mg of cytochrome c type III兾40 mg of diaminobenzidine兾90 ml of 0.1 M phosphate buffer, pH 7.4) for 5–24 h at 37°C. Sections were then washed, mounted on subbed slides, and air dried before dehydration and coverslipping. In a few cases, the staining was intensified with cobalt (30). In V2, CO thick stripes were distinguished from thin stripes by using the widths of the stripes and the distribution of immunoreactivity to CAT-301 (31). BDA labeling was visualized with an avidinbiotin-peroxidase complex by using the Vectorstain ABC Elite kit (Vector Laboratories). The eccentricities of the injection sites were estimated according to Tootell et al. (32) because our injection sites were close to the V1兾V2 border. Anatomical Data Acquisition and Analysis. To achieve the highest
accuracy possible in the anatomical methods, a computerinterfaced microscope (Zeiss Axioskop) was used to record the locations of labeled cells, blood vessels, and section edge lines by using the NEUROLUCIDA hardware and software package (Microbrightfield, Williston, VT). From sections of supragranular layers, labeled cells were scored by using a ⫻20 lens, whereas BDA-labeled patches were outlined by using a ⫻2.5 lens. Distributions of CO, BDA, and other macroscopic patterns were also imaged by using a high-resolution CCD camera (Polaroid) mounted on a microscope. The blob borders were determined quantitatively by gray scale image processing and binary thresholding of the scanned image so that the blob regions occupied 27–30% of the total area. Before the thresholding, the image was processed by the following procedures. First, to remove the noise of low spatial frequency caused by uneven staining and illumination, the image was subtracted by its low-pass filtered version (Gaussian, ⫽ 196 m). Then, the image was filtered by a medium filter (radius ⫽ 49 m) to remove the blood vessels and other noise of high frequency. The image processing and thresholding procedures were accomplished by using NIH IMAGEJ. In the raw CO image, the darkest spot within each blob was identified as the blob center. Custom software running on a UNIX workstation (INDIGO2 R10000 Silicon Graphics, Mountain View, CA) allowed interactive alignment of scored sections to each other or to images of stained sections. Radially aligned blood vessels and other fine edge landmarks were used to align sections. Results In each hemisphere, the CO thin stripes were identified in vivo based on three groups of differential images. First, in the differential images derived from isoluminant chromatic stimuli vs. achromatic luminance stimuli, the dark regions in V2 were identified as the putative color-preferring modules. Some of these modules could be in the CO thick stripes that responded to a residual low-luminance contrast in the chromatic stimuli. To address this concern, two additional groups of differential images were obtained: images derived from stimuli of orthogonal orientations and images derived from low-contrast (7%) vs. highcontrast (100%) stimuli. Because the CO thin stripes do not contain orientation-selective columns (19, 33, 34), we excluded those putative color-preferring modules that had orientation selectivity or responded to low-contrast stimuli and used the remaining color-preferring modules as guides for tracer injections in the CO thin stripes. An example of the color-preferring modules in thin stripes is shown in Fig. 1A. Small injections (0.3–1.3 mm in diameter) of anatomical tracers were then made either within or at least 1 mm away from the color-preferring modules to study the connections associated with the CO thin or other stripes. After tissue processing, the location Xiao and Felleman
NEUROSCIENCE
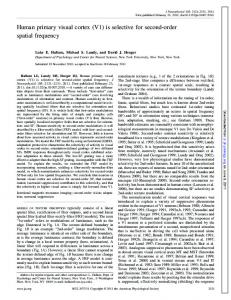
Fig. 1. Injections in different V2 compartments produced different labeling patterns in V1. (A) A differential image derived (by functional optical imaging) from chromatic vs. achromatic stimulations. The tracer FR was injected in a color-preferring module (red cross), and BDA was injected in the adjacent interstripe (green cross). (B) A CO-stained section confirming that the FR and BDA injections were at the centers of a thin stripe and an interstripe, respectively. (C) The fluorescent picture of the FR-injection site (diameter ⬍350 m). (D) A BDA-stained section showing the BDA-injection site (⬍ 500 m). (E) Marks of the FR- and BDA-labeled cells (red and green dots, respectively) overlaid on a CO section with outlines of blobs (black lines). Most clusters of FR-labeled cells partially overlapped with blobs (e.g., the arrowhead), with some scattered FR-labeled cells in the interblobs (e.g., the arrow). Blue dot, mark of blood vessels on scored sections; purple line, outline of analyzed region. (F) Distribution of the labeled cells according to their distances from the blob centers. LS, lunate sulcus. [Scale bar, 1 mm (A, B, and E) and 100 m (C and D)].
and size of each injection was determined by carefully comparing the sections stained for CO with those stained for the tracer, or with the unstained sections for a fluorescent tracer (Fig. 1 B–D). The identification of CO-dense stripes as thin or thick was based on the width of the stripes and兾or on the density of immunoreactivity to the Ab CAT-301 (31). Eleven of 14 injections targeted at colorpreferring modules hit the CO thin stripes. However, because of the cortical curvature near the lunate sulcus, and the narrowness of the CO thin stripes, eight injections straddled the border between a thin stripe and an interstripe. Only the remaining three injections (⬍0.4 mm in diameter), which were clearly restricted to thin stripes, were used to study the projection from V1 to the thin stripes. Three additional injections restricted to interstripes were used to study the V1 projections to V2 interstripes. All injections were made in the cortical regions representing parafoveal visual field (2.5–5° eccentricity). They were centered at layer 4 but spanned all layers. In the hemisphere illustrated in Fig. 1 (hemisphere 1), FR was injected into a color-preferring module, whereas BDA was injected 1 mm away (Fig. 1 A). The CO-stained sections suggest that the injection sites of FR and BDA were centered at a thin stripe and an adjacent interstripe, respectively (Fig. 1B). The FRinjection site was ⬇350 m in diameter and was restricted entirely to the thin stripe without diffusion into the adjacent interstripes (Fig. 1C). The BDA-injection site was ⬇500 m in diameter and avoided both nearby thin and thick stripes (Fig. 1D). In Fig. 1E, the locations of FR- or BDA-labeled cells (red or green dots, respectively) from two sections in layers 2 and 3 of V1 are overlaid on the raw image of the adjacent CO-stained section, along with the blob borders. Although the vast majority Xiao and Felleman
of BDA-labeled cells were located in the interblobs, the FRlabeled cells were found in both blobs and interblobs. Almost all clusters of FR-labeled cells overlapped with the blobs but were not necessarily restricted within the blobs (e.g., arrowheads). In addition to the clusters, there were many scattered FR-labeled cells located inside or outside blobs (e.g., the arrow). Across all section in layers 2 and 3, 443 of 869 (51%) FR-labeled cells were located inside the blobs, whereas the remaining 49% were located outside the blobs. However, because the blobs occupied only 30% of the studied V1 areas in this hemisphere, the density of the FR-labeled cells in the blobs was 2.4 times that in the interblobs (173 and 72 cells per mm2 in the blob and interblob regions, respectively). To ensure that the above intercompartment distribution of labeled cells was not caused by errors in identifying the blob borders, we measured the distance from each labeled cell to its closest blob center. A blob center was defined as the spot with the densest CO staining within a blob. Fig. 1F illustrates the percentage of labeled cells as a function of the distance to blob centers. Consistent with the high percentage of the FR-labeled cells outside the blobs, 67% of the total FR-labeled cells were located at least 150 m away from blob centers. Similar results were obtained in two additional hemispheres that had tracer injections that were restricted to the CO thin stripes (Fig. 2). The labeled cells in V1 were located in both blobs and interblobs (Fig. 2 A and C). On average, across three tracer injections in thin stripes, 52.5% of the labeled cells in V1 were located in the blobs, whereas 47.5% were located in interblobs (SE ⫽ 1.9%, Fig. 3A, left bars). There was no significant difference between the PNAS 兩 May 4, 2004 兩 vol. 101 兩 no. 18 兩 7149
Fig. 3. The V2 thin stripes received equal amount of projection from V1 blobs and interblobs, but the density of thin-stripe-projecting cells was higher in the blobs. The V2 interstripes receive V1 projections almost exclusively from interblobs. (A) After tracer injections in the thin stripes (left bars) or interstripes (right bars), the percentage of the labeled cells in the blobs (black) and interblobs (white). Hemispheres for each pair, n ⫽ 3. (B) The relative density of the labeled cells. A and B were calculated from the same data set. Error bar indicates SE. Significance level of the difference between two means: *, P ⫽ 0.01; **, P ⫽ 0.0025.
Fig. 2. After tracer injections in the thin stripes, the labeled cells were found in both the blobs and interblobs, and densely labeled patches overlapped with the blobs. (A) Marks of the FR-labeled cells were overlaid on a CO section (from hemisphere 2). (B) Distribution of the FR-labeled cells according to their distances from blob centers. (C) Marks of the BDA-labeled cells and the outlines of the densely labeled patches (white lines) were overlaid on a CO section. All densely labeled patches overlapped with but not necessarily restricted to the blobs (from hemisphere 3). (D) Distribution of the BDAlabeled cells according to their distances from blob centers. (Scale bar, 1 mm).
percentage of the labeled cells in the blobs and that in the interblobs (P ⬎ 0.31, paired t test). Consistently, 55% of the labeled cells were located ⬎150 m away from the blob centers (SE ⫽ 10.4%, n ⫽ 3), To compare the densities of the labeled cells in different CO compartments in each hemisphere, the two densities, one for each compartment, were normalized by the highest among them to generate two relative densities. After each thin-stripe injection, the relative density in the blobs was 1, whereas the relative density in the interblobs was 0.36 on average across three hemispheres (Fig. 3B, left bars). Consequently, the density of the thin-stripe-projecting cells was significantly higher in the blobs than in the interblobs (P ⬍ 0.0025, Student’s t test, n ⫽ 3). Previous studies of the relationships between the V1–V2 connections and the CO compartments have focused on the distributions of the densely labeled patches in V1 after tracer injections in V2 (9, 28). To compare our results with those studies more directly, we outlined (under a low-magnification lens) the densely labeled patches in V1 in one hemisphere with the tracer BDA injected in a thin stripe (Fig. 2C). All of these patches overlapped with the blobs, but some of them extended into interblob regions. The BDA injection in hemisphere 1 (Fig. 1) was restricted to an interstripe. The majority of the BDA-labeled cells (81%) in V1 were in the interblobs. On average across three interstripe 7150 兩 www.pnas.org兾cgi兾doi兾10.1073兾pnas.0402052101
injections, 87.5% of the labeled cells in V1 were located in the interblobs, a significantly higher percentage than located in the blobs (P ⬍ 0.01, paired t test; Fig. 3A, right bars). After each of the three interstripe injections, the relative density of the labeled cells in the interblobs was 1, whereas the average density in the blobs was 0.36 (Fig. 3B, right bars). Discussion Our results suggest an asymmetrical segregation between the projections from the various CO compartments in V1 to those in V2. Interstripes in V2 receive V1 inputs predominantly from interblobs, as had been reported by previous studies (9, 10, 28). However, thin CO stripes receive V1 inputs from both blobs and interblobs, a finding that is inconsistent with the earlier studies. This discrepancy could have resulted from differences in the method of analysis or from differences in the subcompartments of V2 thin stripes injected. Previous studies have examined the spatial relationship between the CO compartments and the densely labeled patches in V1 after tracer injections in different CO compartments in V2. They did so by superimposing the CO-stained sections on either the sections stained for tracers (9, 10), or the contours of the labeled patches (28). They observed that, after tracer injections in the V2 thin stripes, the labeled patches in V1 overlapped the CO blobs. Based on this observation, they concluded that V2 thin stripes receive V1 projection from blobs. By superimposing the contours of blobs and contours of labeled patches drawn under a low magnification lens, we also observed the overlap between the blobs and the labeled patches after injections in thin stripes (Fig. 2C). Our observations of the labeled patches were thus consistent with those of previous studies. The densely labeled patches were composed of clusters of labeled cells and a plexus of labeled dendrites. The visibility of these patches under low magnification is attributed to the high density of the labeled cells in them relative to that in the surrounding regions. The labeled cells scattered in the surroundXiao and Felleman
1. 2. 3. 4. 5. 6. 7. 8. 9. 10. 11. 12. 13. 14. 15. 16. 17. 18. 19. 20. 21.
Livingstone, M. & Hubel, D. (1988) Science 240, 740–749. Wong-Riley, M. & Carroll, E. W. (1984) Nature 307, 262–264. Hendrickson, A. E., Hunt, S. P. & Wu, J. Y. (1981) Nature 292, 605–607. Horton, J. C. & Hubel, D. H. (1981) Nature 292, 762–764. Livingstone, M. S. & Hubel, D. H. (1982) Proc. Natl. Acad. Sci. USA 79, 6098–6101. Tootell, R. B., Silverman, M. S., De Valois, R. L. & Jacobs, G. H. (1983) Science 220, 737–739. DeYoe, E. A. & Van Essen, D. C. (1985) Nature 317, 58–61. Hubel, D. H. & Livingstone, M. S. (1987) J. Neurosci. 7, 3378–3415. Livingstone, M. S. & Hubel, D. H. (1984) J. Neurosci. 4, 309–356. Livingstone, M. S. & Hubel, D. H. (1983) Nature 304, 531–534. Livingstone, M. S. & Hubel, D. H. (1984) J. Neurosci. 4, 2830–2835. Leventhal, A. G., Thompson, K. G., Liu, D., Zhou, Y. & Ault, S. J. (1995) J. Neurosci. 15, 1808–1818. Lennie, P., Krauskopf, J. & Sclar, G. (1990) J. Neurosci. 10, 649–669. Ts’o, D. Y. & Gilbert, C. D. (1988) J. Neurosci. 8, 1712–1727. Landisman, C. E. & Ts’o, D. Y. (2002) J. Neurophysiol. 87, 3126–3137. Landisman, C. E. & Ts’o, D. Y. (2002) J. Neurophysiol. 87, 3138–3151. Peterhans, E. & von der Heydt, R. (1993) Eur. J. Neurosci. 5, 509–524. Levitt, J. B., Kiper, D. C. & Movshon, J. A. (1994) J. Neurophysiol. 71, 2517–2542. Roe, A. W. & Ts’o, D. Y. (1995) J. Neurosci. 15, 3689–3715. Munk, M. H., Nowak, L. G., Girard, P., Chounlamountri, N. & Bullier, J. (1995) Proc. Natl. Acad. Sci. USA 92, 988–992. Gegenfurtner, K. R., Kiper, D. C. & Fenstemaker, S. B. (1996) Visual Neurosci. 13, 161–172.
Xiao and Felleman
preferring modules, CO thin stripes contain modules that are preferentially activated by achromatic stimuli (19) or are selective to luminance (unpublished results). The CO blobs also contain broad-band cells that may encode luminance information (9). It remains to be determined whether the luminance modules in CO thin stripes receive V1 projections exclusively from the CO blobs. Because cells in interblobs are orientation-selective, the interblob–thin-stripe projection we found may underlie the orientation selectivity of some cells in the thin stripes. However, previous optical imaging studies have shown that thin stripes do not contain orientation-selective columns that are present in other CO compartments in the parafoveal visual representation (19, 24, 25, 34). These results suggest that cells selective for various orientations are organized randomly in the thin stripes. This scatter of orientation selectivity has been confirmed by a study by Ts’o et al. (39). Recently, we found that V2 thin stripes contain color-specific regions that represent the color of a stimulus by the location of the peak response to the stimulus (25). In order for the peak location to code color information unambiguously, the stimulus orientation should not affect the location of the peak response. The random organization of oriented cells diminishes the effect of orientation on the peak location, and therefore may play an important role in the extraction of color information in thin stripes. Our finding of the interblob–thin-stripe projection is consistent with previous findings that interblobs contain color-selective cells (12, 13, 15, 16). Taken together, these findings call into question the one-to-one relationship between blobs and color processing. However, these findings are not inconsistent with a functional compartmentalization in V1 and V2 (6, 9, 10). Several studies, using optical imaging or 2-deoxyglucose, all indicate that the processing of some visual features such as color is not uniformly distributed across V1 or V2 (6, 15, 19, 25, 40). Some compartments in a visual area may be more involved in processing a specific feature than other compartments. But to what extent the processing of different features are independent of each other, and how accurate the CO activity demarcates various functional compartments, needs to be investigated further. We thank Dr. Ehud Kaplan for his insightful suggestions on the manuscript, Andrzej Zych for computer programming, and Qian Huang for technical support. This research was supported by National Eye Institute Individual Grant EY-08372 (to D.J.F.), National Eye Institute Core Grants EY-10608 and EY-01867, an unrestricted grant from Research to Prevent Blindness, Inc., and the May and Samuel Rudin Family Foundation. 22. 23. 24. 25. 26. 27. 28. 29. 30. 31. 32. 33. 34. 35. 36. 37. 38. 39. 40.
Shipp, S. & Zeki, S. (2002) Visual Neurosci. 19, 187–210. Tootell, R. B. & Hamilton, S. L. (1989) J. Neurosci. 9, 2620–2644. Xiao, Y., Zych, A. & Felleman, D. J. (1999) Cereb. Cortex 9, 792–804. Xiao, Y., Wang, Y. & Felleman, D. J. (2003) Nature 421, 535–539. Yoshioka, T., Blasdel, G. G., Levitt, J. B. & Lund, J. S. (1996) Cereb. Cortex 6, 297–310. Yabuta, N. H. & Callaway, E. M. (1998) Visual Neurosci. 15, 1007–1027. Sincich, L. C. & Horton, J. C. (2002) Science 295, 1734–1737. Ratzlaff, E. H. & Grinvald, A. (1991) J. Neurosci. Methods 36, 127–137. Silverman, M. S. & Tootell, R. B. (1987) J. Neurosci. Methods 19, 1–10. Deyoe, E. A., Hockfield, S., Garren, H. & Van Essen, D. C. (1990) Visual Neurosci. 5, 67–81. Tootell, R. B., Switkes, E., Silverman, M. S. & Hamilton, S. L. (1988) J. Neurosci. 8, 1531–1568. Malach, R., Tootell, R. B. & Malonek, D. (1994) Cereb. Cortex 4, 151–165. Ts’o, D. Y., Frostig, R. D., Lieke, E. E. & Grinvald, A. (1990) Science 249, 417–420. Farias, M. F., Gattass, R., Pinon, M. C. & Ungerleider, L. G. (1997) J. Comp. Neurol. 386, 217–228. Edwards, D. P., Purpura, K. P. & Kaplan, E. (1995) Vision Res. 35, 1501–1523. Vanduffel, W., Tootell, R. B., Schoups, A. A. & Orban, G. A. (2002) Cereb. Cortex 12, 647–662. Olavarria, J. F. & Van Essen, D. C. (1997) Cereb. Cortex 7, 395–404. Ts’o, D. Y., Roe, A. W. & Gilbert, C. D. (2001) Vision Res. 41, 1333–1349. Tootell, R. B., Silverman, M. S., Hamilton, S. L., De Valois, R. L. & Switkes, E. (1988) J. Neurosci. 8, 1569–1593.
PNAS 兩 May 4, 2004 兩 vol. 101 兩 no. 18 兩 7151
NEUROSCIENCE
ing regions, if any, are likely to be neglected in a patch-based analysis. To study the distribution of the individual labeled cells, we marked each labeled cell under high magnification. We then analyzed quantitatively the density and number of labeled cells in the various CO compartments, as well as the distance between each labeled cell and its nearest blob center. After each tracer injection in a thin stripe, the density of the labeled cells was significantly higher in blobs than in interblobs (P ⬍ 0.0025, Fig. 3B, left bars). This result is consistent with the overlap between the densely labeled patches and the blobs found in previous and current studies (9, 10, 28). However, because the interblobs occupy more than twice as large an area as the blobs (in current and previous studies, e.g., refs. 9, 35, and 36), the interblobs contained a similar number of labeled cells as the blobs did (Fig. 3A, left bars). By carefully comparing the locations of the labeled cells with that of blob borders, we found that most clusters of the labeled cells partially overlapped with blobs and contributed to the cells in the interblobs. In addition, there were a significant number of labeled cells scattered in the interblobs. A recent study (37) using the 2-deoxyglucose technique has shown that the orientation columns have more overlapping with the blobs or thin stripes in parafoveal than in foveal V1, suggesting that functional differences between different CO compartments are eccentricity-dependent. This eccentricity dependency could explain the contradiction among previous physiological studies as regarding to the functional segregation between different CO compartments. However, our tracer injections were all in the V2 parts representing the parafoveal visual field where the functional segregation is shown to be strong (19, 25, 37). Therefore, the apparent contradiction between the current and previous studies as regarding to the anatomical segregation is unlikely to be explained by potential difference in eccentricity of the tracer injections. The significant amount of the labeled interblob cells after thinstripe injections were unlikely to be the result of the potential tracer spillage into the adjacent interstripes. To minimize this contamination, of the 11 injections that hit the thin stripe, only three injections that were clearly restricted to thin stripes were used in our study. These three injections were each centered in the middle of their thin stripe and were ⬍400 m in diameter. Because the width of each thin stripe is ⬎500 m (38), these injections had negligible tracer spillage into the interstripes. Our thin-stripe injections were all aimed at the color-preferring modules visualized by optical imaging. In addition to these color-