incorporates various business considerations to evaluate the goodness of a layout. ..... considered as a candidate layout because it is possible for this layout to be the best one for .... Squared coefficient of variation of service times on machine j ...... [1] American Machinist (online edition) (1993), U.S. Builder Enters Small ...
Reconfigurable Layout Problem Gang Meng, Praxair Inc. Sunderesh S. Heragu, Rensselaer Polytechnic Institute Henk Zijm, University of Twente Abstract This paper addresses the reconfigurable layout problem, which differs from traditional, robust and dynamic layout problems mainly on two aspects: first, it assumes that production data is available only for the current and upcoming production period. Second, it considers queuing performance measures such as work in progress (WIP) inventory and product lead time in the objective function of layout problem. A previously developed open queuing network based analytical model called Manufacturing system Performance Analyzer (MPA) is used to estimate the stochastic performance measures of a layout. These are combined with deterministic performance measures such as materials handling cost to determine the layout for the next period. A case study is used to illustrate the process of solving the reconfigurable layout problem.
Keywords: Reconfigurable layout problem, performance analysis
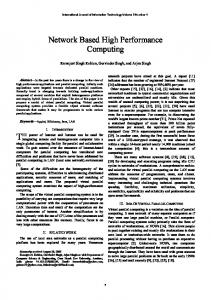
1. Introduction To put a layout problem into context, the entities and activities relevant to the layout problem can be organized into a layered model as shown in figure 1. The reference model has three physical layers: product mix, machine types and locations on the shop floor. Product mix includes the types of products that need to be produced and their arrival volumes (parameters related to demands). Each available machine belongs to a machine type. The number of locations on the shop floor is equal to the total number of machines. The two logical layers of the reference model denote the design activities involved. Process planning problem maps each product to a sequence of machine types, its output (product routings) includes other production data such as processing time, setup time and tooling information. Layout problem is to find a one to one mapping from machines on the machine types layer to locations on the shop floor. The third logical layer (not shown) pertains to the scheduling problem. It finalizes the machine types in a product routing to specific machines on specific shop floor locations, and coordinates the timing, sequencing and prioritizing of all work orders assigned to one machine. Product Mix
Product Routings (including processing time, setup time, batch size, etc.) Machine Types
Layout Locations on shop floor
Figure 1. Facility layout problem reference model
1
The solution of the layout problem is determined by entities and activities in other layers of the reference model. Define the collection of these entities and activities (i.e., product mix, product routings, machines and locations on shop floor) as the context of a layout problem. As long as the context is fixed, theoretically speaking, there exists an optimum layout for this context. By definition, the facility layout problem is a simple assignment of n machines to n locations on the shop floor. What makes the facility layout problem difficult to solve is the large combinatorial search space, especially when n is large (possibly n! feasible solutions if no special restrictions on the locations of specific machines or relative location of a subset of machines) and the construction of a score function which incorporates various business considerations to evaluate the goodness of a layout. A layout problem becomes more difficult to solve when multiple layout contexts must be considered and the problem has to be solved frequently in a real time mode. A typical current day manufacturing company faces constantly changing product volumes and mix, which make it necessary to update layout accordingly in order to operate efficiently. Simultaneously, the rapid advances in materials engineering and manufacturing technology has made it practical and economical to switch layout when needed. As discussed in Heragu and Kochhar (1994), composites are the primary choice for many discrete manufactured components. Aluminum composites, for instance, can now replace cast iron parts and phenolics are replacing aluminum parts (Arimond and Ayles, 1993 and Fujine et al., 1993). Not only are these light, but they can be engineered to have excellent mechanical properties such as hardness, heat resistance, tensile strength and vibration absorption. The last property permits machine tool designers to design functionally equivalent, but lighter tools that do not require an elaborate foundation, making them easily movable. Non-abrasive manufacturing 2
process technology such as laser cutting, electron beam hardening and molecular nanotechnology also supports machine tool designers’ quest for making light weight machining equipment (Asari, 1993). Permanent magnetic chucks that facilitate quick mounting and dismounting of tools are being developed (American Machinist, 1993). In fact these chucks do not magnetize the cutting tool, carry their own energy source and do not obstruct machining. Once again, these features in and of themselves support rapid equipment reconfiguration. This trend is likely to continue well into the next two decades. In fact, through a workshop and a delphi survey, the committee on Visionary Manufacturing Challenges for 2020 has identified adaptable processes and equipment and reconfiguration of manufacturing operations as two key enabling technologies that will help companies overcome two of the six grand challenges or fundamental goals to remain productive and profitable in the year 2020 (National Research Council, 1998). These grand challenges are to “achieve concurrency in all operations” and to “reconfigure manufacturing enterprises rapidly in response to changing needs and opportunities”. Benjafaar et al. (2002) point out a few examples from industry and academic research that support the migration of next generation systems towards highly adaptable and quickly re-configurable systems. Northern Telecom, in one of its manufacturing facilities facing constant product design changes, employs conveyor-mounted work cells that can be readily relocated just before a scheduled production/assembly change (Assembly Magazine, 1996). Clearly, one can envision a manufacturing system of the future to be made of light weight manufacturing and materials handling equipment that can configured and reconfigured as and when needed - perhaps even on a monthly or weekly basis (Heragu and Kochhar, 1994)! A primary advantage of reconfiguring a layout when warranted by changes in product mix and 3
volume is that material handling cost can be minimized because equipment can be reconfigured to suit the new production mix and volume. Of course, this cost must more than offset the cost of moving equipment from its current location to a new one. In addition, due to the short term life of a given layout and availability of production data for this time period, it is possible to consider optimizing operational performance measures such as minimizing part cycle times and work in process inventory. To summarize, the potential to frequently alter layouts, therefore, in a sense, transforms the modern layout problem from a strategic problem in which only long term material handling costs are considered to a tactical problem in which operational performance measures such as reduction of product flow times, work in process inventories, and maximizing throughput rate are considered in addition to material handling and machine relocation costs when changing from one layout configuration to the next. In section 2 we review literature on dynamic and robust layout problems, which also considers multiple layout contexts (planning period, demand scenario). In section 3 we define the reconfigurable layout problem and its solution process. The solution process requires performance evaluation of alternate layouts and this is done via an analytical queuing network model called Manufacturing Performance Analyzer (MPA). Since MPA is at the heart of the solution process, it is described briefly in section 4. In section 5, we use a case study to illustrate how the reconfigurable layout process is used to develop a layout for an upcoming production period given the current layout and the new production data so as to minimize material handling cost and those related to queuing factors.
2. Literature review The traditional layout problem is primarily concerned with layout of machines for a (deterministic) single planning period. The score (objective) function used to evaluate the 4
goodness of a layout only consists of material handling cost. Using the topological feature of the layout, the traditional layout problem can be further classified as single-row and multi-row layout problem (Heragu, 1997), which in turn can be further classified depending upon size and orientation of machines. The focus of much of the research in the traditional layout domain has been on efficient solution of a combinatorial optimization problem. Mathematical programming techniques such as nonlinear programming and mixed integer programming have been used to solve the traditional layout problem (Kouvelis and Chiang, 1996, Ho and Moodie, 1998 Heragu, 1997, Houshyar, 1989, Bozer and Rim, 1996, Hsieh and Sha, 1996). But because of the computational cost and solution quality, researchers have turned away from mathematical programming based techniques to random search heuristics such as genetic algorithms (Kochhar and Heragu, 1999, Rajasekharan et al., 1998) and simulated annealing (Kouvelis and Chiang, 1992, Jajodia et al., 1992, Harhalakis et al., 1996). Although not rooted in mathematical programming, these random search techniques have proven to be powerful techniques to solve many combinatorial problems including the layout problem rather efficiently. Artificial intelligence techniques such as expert systems have also been used to solve some types of layout problems efficiently (Ngoi Kok Ann and Chua, 1994, Heragu and Kusiak, 1990, Chung, 1999). A detailed review of the layout problem can be found in Kusiak and Heragu (1987). Assuming (deterministic) production data for multiple future planning periods are available, the dynamic layout problem attempts to find a sequence of layouts corresponding to the multiple planning periods. Since multiple planning periods are considered, it is necessary to consider the cost of switching from one layout in one planning period to another in the 5
next. The objective function is then to minimize the material handling cost over all periods and the overall cost of relocating machines in consecutive layouts. Lilly and Driscoll (1985) explore the two planning period layout problem. Rosenblatt (1986) discusses a restricted version of the general dynamic layout problem which he calls the multiphase layout selection problem. In each phase, a traditional layout problem is solved to get several candidate layouts. A dynamic programming technique is then used in all phases to select the sequence of layout that minimizes the overall material handling and machine relocation costs. If we consider all possible layouts in each phase, then we have a general dynamic layout problem. Kouvelis and Kiran (1991) also use the dynamic programming technique to solve the multiple period layout problem and propose a state space reduction approach to reduce the search space. Montreuil and Venkatadri (1991) present a proactive methodology for designing dynamic layouts for the expansion phase of a manufacturing system. The layout for the maturity phase of the manufacturing system is first determined based on designer’s envisioning of possible scenarios in the future (maturity) phase. Starting from this final layout, the methodology interpolates backwards until the initial facility layout plan is obtained. Under the rigid facility assumption, i.e., the boundary of a cell in phase p is within the boundary of the cell in phase p+1, they determine the optimal position of each cell in phase p within the boundary of the cell in phase p+1. Montreuil and Laforge (1992) extend Montreuil and Venkatadri’s (1991) model in several ways. They relax the rigid cell assumption so as to make the layout more flexible. They also relax the restriction that the model is good only for the expansion (decline) phase of the manufacturing system. Most importantly, by interpolative design, Montreuil and Venkatadri (1991) assume a “linear future” where only one possible scenario can be considered in each intermediate phase. 6
Montreuil and Laforge (1992) explicitly consider multiple scenarios for each intermediate phase in their model and develop a tree structured future. As an input to the model, the designer needs to model explicitly the phases of evolution of the manufacturing system and the probabilistic future in each phase. The result is a scenario tree whose nodes represent a possible future characterized by the product mix, facility availability and other factors that might affect the layout design. A linear programming model is built to process the scenario tree to get the dynamic layout. Compared with the backward interpolative approach proposed by Montreuil and Venkatadri (1991), this model is more general and more intuitive to understand which makes it suitable to be used in an interactive layout design environment where a designer can peek into different future periods and do “what-if” analysis. Robust layout problem addresses the stochastic single or multiple period layout contexts where demand for one planning period is uncertain (thus multiple demand scenarios exist for each period). It is motivated by the fact that layout design is usually done in the early stage based on the forecast of future product demands, and this forecast usually turns out to be highly inaccurate. This makes the optimal design of layout problem meaningless. Another situation where a robust layout is desired is in the multiple period layout domain where the relocation cost is prohibitive and we must therefore use the same layout across all planning periods. To solve a robust layout problem, we choose only one layout, which may not be optimal for a particular demand scenario or planning period, but optimal or near-optimal considering all possible scenarios and planning periods. Kouvelis et al. (1992) defined robust layout as the layout whose objective value is within p% of that of the optimal solution considering the actual demands. To generate the robust single period layout problem, they adapted Gilmore (1962) and Lawler’s (1963) branch and bound procedure for the quadratic 7
assignment problem (QAP). During the process of branch and bound they keep a list of feasible layout whose objective function value is within p% of the optimal or best known solution and fathom only if the lower bound of the branch is p% higher than the objective function value of optimal or best known solutions. As they mention, similar modification can be used in any branch and bound algorithm (see Finke et al.,1987 for a survey of such procedures). To generate robust layout for multiple periods, Kouvelis et al. (1992) apply the modified Gilmore-Lawler procedure on all scenarios in all periods to generate a list of solutions. They then look for solutions that are common across all scenarios. Yang and Peters (1998) solved the robust multiple period layout problem differently. They employed the notion of planning time window which is a number of planning periods in the future. When the time window equals zero, then it is a dynamic layout problem with a new layout determined for each new period. When the time window size equals the planning horizon, then it is a pure robust layout, wherein one layout is used for all the planning periods. Within each time window, an average flow matrix (corresponding to the periods in the time window) is calculated and used to generate a robust layout for this time window. The concept of combined adjacency graph (a concept similar to design skeleton used in Montreuil and Laforge, 1992) is used to simplify the constraints of the linear programming formulation of the robust layout problem. Their model considers both material handling cost and relocation cost, and assumes the layout rearrangement cost is fixed. The machines in their model can have varying sizes but with fixed orientation and load/unload points. A computationally efficient heuristic is used to obtain the final solution. This heuristic outperforms the QAPbased enumeration method for a set of test problems.
8
3. Reconfigurable layout problem The robust and dynamic layout problems assume the layout contexts (such as product mix and routings) are known for multiple future planning periods. This assumption makes it easy to solve the layout problem but it is not realistic in many situations. In reality, for many production systems, the product mix and routing changes for the upcoming period are known just slightly ahead of that period. It is therefore pragmatic to consider only the current period and the next in layout design. It is also important to consider stochastic operational performance measures such as work in progress (WIP) inventory level and product lead time in the objective function, besides the material handling cost and relocation cost. Heragu and Kochhar (1994) proposed the notion of reconfigurable layout problem. Re-configurable layout problem differs from traditional layout problem in that it considers the deterministic material handling and relocation cost and the stochastic operational cost in a dynamic and uncertain environment. It also differs from dynamic layout in that only the current and upcoming planning period are considered. Viewing the current period as past, it designs a layout that minimizes the relocation cost while maximizing the potential saving in material flow cost and inventory cost for the next period. Re-configurable layout also differs from robust layout in that it designs a layout based on deterministic product mix for the next planning period immediately after the data are available. While traditional, dynamic and robust layout problems base themselves solely on future planning period, reconfigurable layout problem addresses the transition from the current period to the next. Reconfigurable layout problem aligns itself with the notion of real time enterprise (Gartner, 2001) in which the changes to layout context are readily available, and it keeps operating on the edge by doing real time layout adjustment with live data.
9
Demand Scenario 2
…
Scenario
Reconfigurable layout problem only considers one deterministic layout context for current and the next available future planning periods. Dynamic layout considers layout contexts for multiple future periods and robust layout considers layout context for multiple scenarios or multiple future periods.
Robust Layout
Reconfigurable Layout
Dynamic Layout
Demand Scenario 1
…
Present
Current Period
Future Planning Period 1
Future Planning Period 2
t
Figure 2. Reconfigurable, dynamic and robust layout problems
10
Kochhar and Heragu (1999) proposed a reconfigurable layout framework. This paper actually operationalizes that framework and provides a case study. Figure 2 illustrates the relationship between reconfigurable, dynamic and robust layout problems. Reconfigurable layout problem is triggered by reasonable changes in the factors that affect the performance of the current layout, e.g., product mix, volume. Several candidate layouts are then generated using existing layout design techniques. The current layout is also considered as a candidate layout because it is possible for this layout to be the best one for the next period. Of course, this occurs when the changes in product mix and volume are rather small. After estimating the performance measures and calculating the material handling costs for each layout, we choose the best one among all candidates as final layout and then deploy the final layout on the shop floor for the next planning period after necessary refinements. The process is illustrated in Figure 3. Note that the layout for next period could well be the current period’s layout, which occurs when layout context changes are not significant enough to warrant a change in the layout. Change in layout parameters?
Generate candidate layouts
Estimate performance measures of layouts
Refine selected layout
Determine Layout to be used
Layout for current period Layout for next period
Figure 3. Four phase approach for design and analysis of reconfigurable layouts
11
4. Brief Description of Manufacturing Performance Analyzer (MPA) The Manufacturing system Performance Analyzer (MPA) described in more detail in Meng (2002) and Meng and Heragu (2002) is used to evaluate the performance of a layout. It is an extension of Whitt’s (1983) Queuing Network Analyzer (QNA). MPA incorporates many realistic manufacturing considerations such as operational and transfer batch sizes, setup time, empty travel time of the material handling device and machine failure. While other analytical models are available (Benjafaar, 2002, Segal and Whitt, 1989), MPA is the most comprehensive and accurate one (Meng and Heragu, 2002). Simulation is an alternative tool for performance evaluation, but it is well known that it is expensive to build and run. MPA not only determines the commonly sought performance measures analytically (and therefore quickly), but also provides the user the option of automatically generating input data for the ProModel simulation software. MPA is based on the parametric decomposition (PD) method successfully employed by Whitt (1983) to analytically evaluate key performance measures of a queuing network, i.e., a network of queuing systems. As Whitt (1983) puts it, unlike many queuing models which provide exact results for approximate models, PD methods provide approximate results for more exact models. These methods can work with inter-arrival and service times following any general distribution. Given the first two moments (mean and standard deviation) of inter-arrival times of each customer type into the network and its routings as input, the PD method calculates the first two moments of inter-arrival time of an aggregate customer into each node. To do so, Whitt (1983) identified three network operations – departure, split and superposition, identified in Table 1 and approximately 12
computed the effects of these on the first two moments of the aggregate arrival into each node. Each node is a queuing system and represents a server (machine, work-station or material handling device). Meng and Heragu (2003) identified an additional network operation, batch/burst, also listed in Table 1 and captured its effects on the aggregate arrival. When parts coming from a machine must wait at the next to be processed in larger batches, batching occurs. On the other hand, if products coming from one machine are processed in smaller batches at the next, ‘bursting’ occurs. The notation used in deriving expressions for the first two moments of the aggregate arrival into a node is provided below, but the derivation itself and a detailed explanation can be found in the Whitt (1983) and Meng and Heragu (2003). Notation i Product type index, i=1,2,…,p j, k Machining index, j,k=1,2,…,n-1 l Operation index, l=1,2,…, o i n Material handling device index Utilization of machine j ρj
mj
Number of servers at machine j
λ0i k λ jk
Rate at which a product i arrives into machine k from the outside
λ ′jk
Rate at which product arriving into machine k comes from machine j
p jk
Proportion of products leaving machine j that go to machine k
p′jk
Proportion of products arriving at machine k that come from machine j
Rate at which a product leaving machine j comes into machine k
2 aj
Squared coefficient of variation of inter-arrival time for two consecutive arrivals
2 sj
c
into machine j Squared coefficient of variation of service times on machine j
bkli
Operational batch size of lth operation of product i on machine k
bt ijk
Transfer batch size between machine j and machine k
Ykli
1 if the lth operation of product i is done at machine k
Y jkli
1 if the lth and (l+1)th operation of product i are done at machine j and k,
c
respectively 13
It should be noted that because the same product can be batched differently at two successive stations or different products visiting two machines for successive operations can be batched differently, the λ jk and λ ′jk values between the same two machines j and k need not be the same. Also, instead of computing standard deviation, we calculate the squared coefficient of variation (scv) which is the square of the coefficient of variation, i.e., standard deviation divided by the mean. The first two moments of the effective interarrival time into a node are obtained by solving the two systems of linear equations, which synthesize the effects of the four basic network operations on the first and second moments of inter-arrival time (or arrival rates) respectively.
Table 1. Effects of basic network operations on the arrival rates Operations
a
First Moment
d
departure
i
a
λd = λa
Second Moment
c d2 = 1 + (1 − ρ 2 )(c a2 − 1) +
λi = pi λ a
ρ2 m
(c s2 − 1)
ci2 = p i c 2 + 1 − p i
split i
λ a = ∑ λi
a
i
superposition
d1
a2
λ a 2 = γ 1, 2 λ d 1
λ c = w∑ i i ∑ λk k 2 a
2 c i + 1 − w
c a2 2 = max{0, γ1,2 − 1}+ γ1,2c d21
batch/burst
14
The first set of linear equations is used to calculate the effective arrival rate into each machine. However, before we can present the equation, we must introduce the notion of relative batch size and calculate it for each pair of nodes. For a particular product i and operation l, let us define the relative batch size γ i,ljk =
b ijl i bk,l +1
, as the ratio of the batch size of
lth operation of product i done on machine j to the batch size of (l+1)th operation of that product on machine k. When multiple products flow from machine j to machine k, the relative batch size is as follows. n
γ jk =
oi
∑∑b
i i jl −1 jkl
Y
i= 1 l = 2 n oi
∑∑b Y i kl
(1) i jkl
i= 1 l = 1
To calculate the first moment of the effective arrival rate into each node, we solve equation (2) simultaneously to obtain a unique solution. Note that equation (2) contains as many variables as equations and pjk is the outgoing probability of node j, i.e., the proportion of customers leaving node j that go to k. The idea behind the linear equations is that arrival into a node is equal to arrivals from the outside world plus arrivals from other nodes. But because batch sizes at other nodes might be different from the batch size at the node under consideration, the batches departing from other nodes are transformed into batches on the node being considered by using the relative batch size as follows. p
n
i =1
j =1
λˆk = ∑ λ0i k + ∑ λˆ j p jk γ jk , k=1,2,…,n
(2)
Consider the arrivals into node (machine) k. As mentioned before, it has two parts: the arrivals from the outside world and the superposition of the arrivals from other 15
machines. An arrival from another machine is one of the splitting branches of the departure from that machine, going through a batch/burst operation (if batch sizes are different) before arriving at machine k. The second set of linear equations to be solved simultaneously to yield the SCV of the inter-arrival time of the aggregate customer at a node synthesizes the effects of the four network operations, which characterize the propagation of variance of the flow through the network. Writing out the effects of this process on the SCV of machine k, we have the following set of linear expressions. n
cak2 = ak + ∑ caj2 b jk , k = 1, 2,..., n
(3)
j =1
n 2 2 ′ p γ c 1 − + ( 0 k 0 k 0 k ) ∑ p′jk γ jk (1 − p jk ) + p jk ρ j x j j =1 where ak = 1 + wk n , + p′ max {γ − 1, 0} jk jk ∑ j =0 1 1 max {csj2 , 0.2} − 1 b jk = wk p′jk p jk γ jk (1 − ρ 2j ) , wk = , xj = 1+ 2 1 + 4(1 − ρ k ) (u k − 1) mj
p
and u k =
1
∑ ( p′ ) n
j =0
2
jk
and γ jk =
oi
∑∑ λˆ i =1 l =1 p oi
i jk
γ ijk,lY jli Yki,l +1
∑∑ λˆijkY jli Yki,l +1
.
i =1 l =1
The first two moments of effective service time on each node (machine) can be calculated as the convex combination of service time of all operations performed on this machine. Now that we have the first two moments of the aggregate arrival into each node as well as the service times, we can analyze each node as a separate GI/G/m queueing system to calculate the performance measures of this node. Appropriate disaggregation or aggregation is needed to get the specific customer type performance measures at a node or 16
in the network. Refer to Whitt (1983) for details of calculating the internal flow, routing probability and the first two moments of the effective service time of an aggregate customer type at a node, as well as aggregation and disaggregations. For example, the average waiting time in queue can be calculated as:
E (WQk ) =
(c ak2 + c k2 ) E (WQk ) M / M / m 2
(4)
where ck2 is the scv of the effective service time at node k, E (WQk ) M / M / m is the average waiting time in queue for an M/M/m model which itself can be calculated exactly. To summarize, the PD method determines the first two moments of the aggregate inter-arrival as well as service times at each node, treats each node as an independent GI/G/m queue, and analytically determines performance measures at each node. It then disaggregates these performance measures to obtain product specific measures or aggregates the results over the entire network to yield network specific results. Such a method is approximate but provides results that are very close to those obtained via simulation. Moreover, because the inter-arrival and service time distributions can be any general distribution, not just exponential, it is said to be more realistic.
5. Case study We use part of the dataset in Huang and Irani (2000) as the current manufacturing system. We then add several products to introduce a reasonable change in product mix and volume, thus providing a reason to change the layout. The following are assumed. (1) The shape and size of the machines is not of concern, standard one by one space holders are used to illustrate their relative positions. (2) The shop floor space has the fixed dimension of six by
17
four units. (3) Work is assigned to specific machine within a machine type using ‘shortest travel time from previous operation machine’ rule and each machine adopts a first come first served service priority. Assumption (3) simplifies the effects of scheduling policy on the stochastic performance measures of candidate layouts. We follow the steps delineated in section 3 to illustrate the process of solving reconfigurable layout problem. 5.1 The current manufacturing system
Table 2 shows the routings of products in the current manufacturing system together with the new products (shaded). Note that the number in the routings represent machine types, not a specific machine. As shown in the current layout (Figure 4), the same type of machine might have different machine numbers. This occurs when duplicate machines are dispersed among different cells. For example machine type J is dispersed in cells 2 and 3, labeled as machines 12 and 15 respectively. When several machines of the same type are placed together within a cell, they are labeled using one machine number. For example the two type D machines in cell 1 are labeled together as machine number 6. The assumption here is that machines of same type placed together share the same incoming queue, thus working as a single station with multiple servers.
5.2 Generate candidate layouts
Candidate layouts can be generated using an existing software package, variation of an existing layout developed for similar production data, human expertise or even intuition. Since the current layout is cellular, we build a functional layout from scratch and generate several cellular layouts by varying the current one. In all the layouts, we assume that machine G (#17 in Figure 4) cannot be moved due to hard constraints.
18
Table 2. Operation Sequences of Products Produced in the Facility Product # 1 2 3 4 5 6 7 8 9 10 11 12 13 14 15 16 17 18 19
Sequence
Arrival Rate (per hour) 0.2 0.3 0.1 0.3 0.2 0.1 0.2 0.1 0.1 0.2 0.3 0.1 0.1 0.3 0.1 0.2 0.1 0.3 0.2
A→D→H→I A→D→G→D→H→G A→B→D→G→H→I A→D→G→I A→F→J→G→I F→J→G→H→I F→D→H→I C→E→B→F→D→H→I C→E→F→D→H→I D→G→D→H F K→G→L K→L K→G→J A→G→K→J→K→L A→G→K→J→K→L K→G→L F→G→J L
Cell 1 Legend
x y
D
x
Machine type Machine label (number)
B 6
y
Cell 3
D
F 4
E 6
H
J 3
C 7
I
G
J
K
F
K 16
G 10
A 13
16
11
12
I 1
K 11
12
2
A 8
G 5
J 17
G 9
16 15
L 17
14
Cell 2 Figure 4. L0: Current cellular layout
19
D
E 4
F
J
5
D
H 4
F I
A
I 9
L 11
10
G
2
11 12
G
9
B 1
10
J
3
K 11
K
6
C 1
10
J
8
A
K
6
7
G 7
G 7
7
Figure 5. L1: Functional Layout
The first layout is the pure functional layout (Figure 5). Machines of the same type are grouped together into a work center. The relative positions of work centers are determined in a way such that the material handling cost associated with the layout is the minimum among all pure functional layouts. Cell 1 D
Cell 3
B 6
D
L 4
E 6
H
F 3
C 7
I
G
I
G
J
15
K 16
15
J 11
F 1
K 15
16
12
A 1
K 14
5
2
A 8
J 13
11
G 9
Cell 2
G 10
10
Figure 6. L2: Cellular layout with reorientation of cell 2 and cell 3
Layout L2 is a slight variation of the current cellular layout L0 (Figure 4). Cell 1 is the same and cell 2 and 3 are rotated 90D clockwise. The idea is to put the two copies of machine A physically adjacent to their own machine types in the adjacent cells. Besides reorientation, layout L3 further reshapes cells to achieve the maximum physical adjacency between machines of the same type. The cells are allowed to have L or S shape, compared with the U shape (or rectangular shape) in Figure 6. Layout L4 in Figure 8 tries to solve this problem by setting aside an extra cell and placing the machine types shared by different cells into that cell. 20
The distance matrix of a layout is determined by the Manhattan distance metric between the mass center of the two work centers. For two machines with
( x2 , y2 )
( x1 , y1 ) and
as mass centers respectively, the Manhattan distance is defined as
x2 − x1 + y2 − y1 . As an example, distance matrix for layout L1 is shown in Table 3. Cell 1 B
F 6
E
D
H
L
I
11
J
I
A
4
13
K 12
2
F 9
11
J 12
G 12
G
1
K 11
J
2
1
K
4
3
8
A
D
5
7
C
Cell 3
10
G 10
G 10
10
Cell 2 Figure 7. L3: Cellular layout with reorientation and reshaping of cells Cell 2
Cell 1 E
B 3
C
A 2
F 5
I
D 6
H 11
K
D
G
J
G
J 8
I 10
G 14
4
7
10
K 14
F 1
7
9
K 14
A 1
J 12
G 10
8 8
L 10
13
Cell 3
Figure 8. L4: Cellular Layout with a remainder cell
5.3 Choosing between existing and candidate layouts
With the above processing and layout data, we can estimate the performance measures relative to each layout. These measures include both deterministic measures such as material handling cost and stochastic measures such as average waiting time in queue and average queue length. To facilitate the decision making process, some of the measures need to be aggregated into more informative measures. Product lead time is the sum of all processing times spent on the machine, waiting time in queue before each machine and 21
transfer time between machines. Average WIP inventory level of the shop floor is the sum of the average queue length, over all the machines on the shop floor. Table 3. Distance matrix for layout L1 M
1
2
3
4
5
6
7
8
9
10
11
12
1
0 1.5 1.5 2 3.5 4 4 2.5 2 4.5 6.5 6.5
1.5 0 1 3.5 3 3.5 3.5 2 1.5 4 6 6
1.5 1 0 2.5 2 2.5 3.5 1 1.5 3 5 5
2 3.5 2.5 0 1.5 2 6 1.5 4 3.5 4.5 5.5
3.5 3 2 1.5 0 1.5 5.5 1 3.5 3 4 5
4 3.5 2.5 2 1.5 0 4 1.5 2 1.5 2.5 3.5
4 3.5 3.5 6 5.5 4 0 4.5 2 2.5 2.5 2.5
2.5 2 1 1.5 1 1.5 4.5 0 2.5 2 4 4
2 1.5 1.5 4 3.5 2 2 2.5 0 2.5 4.5 4.5
4.5 4 3 3.5 3 1.5 2.5 2 2.5 0 2 2
6.5 6 5 4.5 4 2.5 2.5 4 4.5 2 0 1
6.5 6 5 5.5 5 3.5 2.5 4 4.5 2 1 0
2 3 4 5 6 7 8 9 10 11 12
Table 4 shows the WIP inventory level of the shop floor for each of the five layouts. Table 5 shows the material handling cost and lead time for each product for each of the five layouts. Product specific material handling cost are added to get the overall material handling cost of the system, using the formula
∑ λ Tmhd i
i
, where λi is the arrival
i
rate of product type i and T is the length of the planning horizon, mhdi is the material handling cost incurred while handling product i. To relate product lead time with cost, we calculate the delay (estimated completion time minus product due date), then sum over all product types to get the overall lateness of the products. The formula used is
∑ T λ overdue . The results are shown in the last row in Table 5. i
i
i
Choosing among existing and candidate layouts is a multiple objective decision problem. Different companies might be concerned with different sets of cost terms. While 22
most companies use deterministic terms such as material handling and relocation costs as well as stochastic terms such as WIP inventory cost and lead time, some companies might want to include unused space, machine utilization or cell/machine center shape into consideration. Table 4. The overall WIP level of different layouts
M 1 2 3 4 5 6 7 8 9 10 11 12 13 14 15 16 17 Sum
L0 3.2 1.5 1.0 1.5 5.1 2.5 2.8 1.7 4.7 2.2 1.3 5.4 1.5 1.6 2.1 2.7 4.4 45.1
L1 4.6 1.5 1.5 2.5 1.0 4.2 3.4 2.8 2.6 5.0 2.7 1.6
33.4
WIP Inventory L2 4.6 1.5 1.0 1.5 11.3 2.5 2.8 0.8 1.5 2.3 4.4 5.4 35.6 0.7 2.7 2.9 81.4
L3 4.6 2.6 2.8 2.5 1.6 1.5 1.0 1.5 14.6 3.4 2.7 5.0 1.6
L4 2.3 1.5 1.0 44.8 1.5 1.3 2.5 5.0 2.8 3.4 1.7 9.9 1.6 2.7
45.4
82.1
We have now aggregated the product and machine specific cost or performance measures (Tables 4, 5) into four system wide cost measures: material handling cost, WIP inventory cost, product lateness penalty cost and relocation cost (Tables 6 and 7). In this case study, we use only these cost terms to select the final layout. The next step is to combine the four cost measures into a single one. A layout can then be selected based on this aggregate cost measure.
23
Table 5. Material handling cost and product lead times corresponding to different layouts
P 1 2 3 4 5 6 7 8 9 10 11 12 13 14 15 16 17 18 19
λ 0.2 0.3 0.1 0.3 0.2 0.1 0.2 0.1 0.1 0.2 0.3 0.1 0.1 0.3 0.1 0.2 0.1 0.3 0.2 MHD_Cost
Material Handling Cost (distance) L0 L1 L2 L3 L4 6.0 6.0 6.5 9.0 4.5 15.5 20.0 25.0 20.0 10.0 13.0 18.0 18.5 16.0 9.5 12.0 10.0 15.5 12.0 6.5 8.0 10.0 8.5 9.0 8.0 9.0 11.0 10.0 10.5 8.0 5.0 6.0 6.0 7.5 6.0 8.0 14.5 9.0 8.5 8.0 8.0 9.5 7.0 8.5 8.0 7.5 13.5 9.5 10.5 6.5 0.0 0.0 0.0 0.0 0.0 4.0 5.0 4.0 6.0 5.0 3.0 1.0 3.0 3.0 4.0 4.0 5.0 4.0 4.0 5.0 11.0 11.5 13.5 13.5 19.5 11.0 11.5 12.5 13.5 19.5 4.0 5.0 4.0 6.0 5.0 3.5 6.5 3.5 4.0 6.0 0.0 0.0 0.0 0.0 0.0 132.6
164.0
160.0
161.5
139.0
Due Date 7.6 9.0 17.0 6.4 42.7 31.5 30.1 35.5 25.0 6.2 13.2 13.1 10.4 14.7 24.2 23.4 13.7 12.8 8.0
L0 8.3 9.3 17.6 6.9 28.7 15.4 17.9 38.8 28.3 5.8 2.5 9.4 4.4 11.4 25.0 25.0 10.0 12.2 2.0
Lead Time (hours) L1 L2 L3 7.9 7.3 7.9 9.1 9.8 9.1 17.3 17.1 17.3 6.6 6.4 6.6 16.2 26.3 31.2 11.9 38.6 27.0 9.5 36.3 24.5 30.3 48.4 30.2 19.8 37.9 19.7 6.0 7.1 6.0 2.9 2.1 2.9 6.2 37.5 6.2 4.4 34.6 4.4 8.0 38.3 8.0 16.0 49.1 16.0 16.0 45.4 16.0 6.8 38.1 6.8 8.7 11.3 23.7 2.0 32.2 2.0
L4 6.5 7.8 15.9 5.3 110.9 64.6 62.1 29.7 19.2 6.0 55.6 6.2 4.4 8.0 14.7 14.7 6.8 8.2 2.0
Over Due
11.2
0.9
175.8
208.7
11.8
24
Table 6. Overall cost with unit cost vector of {5, 1, 10, 0.1} Unit
Layout
Criteria
Cost
L0
L1
L2
L3
L4
WIP
5
45.1
33.4
81.4
45.4
82.1
Material Handling
1
132.6
164.0
160.0
161.5
139.0
Over Due
10
11.2
0.9
208.7
11.8
175.8
Relocation
0.1
0.0
32.0
20.0
36.0
56.0
470.0
342.6
2656.0
509.6
2312.9
Overall Cost
Table 7. Overall cost with unit cost vector of {1, 10, 1, 0.1} Unit
Layout
Criteria
Cost
L0
L1
L2
L3
L4
WIP
1
45.1
33.4
81.4
45.4
82.1
Material Handling
10
132.6
164.0
160.0
161.5
139.0
Over Due
1
11.2
0.9
208.7
11.8
175.8
Relocation
0.1
0.0
32.0
20.0
36.0
56.0
1382.5
1677.4
1892.1
1675.7
1653.5
Overall Cost
To help us in choosing amongst the available layouts, we assume a set of cost measures with a corresponding unit cost vector. For example, let us assume that every distance unit traveled by the material handling device costs $5, one unit of shop floor inventory space costs $1 per hour, every hour of lateness of product delivery incurs penalty of $10, and that the unit distance cost of relocating a machine is $0.1. Thus, for this set of cost measures the {WIP, Material handling, Over Due, Relocation} unit cost vector is {5, 1, 10, 0.1}. The overall cost of the manufacturing system is the weighted sum of all cost measures. Table 6 shows the overall cost while using each of the five layouts with the unit cost vector of {5, 1, 10, 0.1} and Table 6 shows those with unit cost vector of {1, 10, 1, 0.1}. The cost measures vector is generic, in the sense that any discrete manufacturing system can have the same set of cost measures. But the unit costs are typically company specific, reflecting a manufacturing system’s resources, 25
production control policy and even management strategy. A low WIP inventory unit cost maybe due to the fact that the company has relatively more shop floor space (i.e., shop floor space premium is not high) and a high over due unit cost reflect the emphasis of the company’s eagerness to be responsive to market demand (i.e., penalize production delays). Note that the unit cost of relocation in the two examples is relatively small. There are two reasons. First, for reasons mentioned in section 1, we are assuming that relocation cost in a reconfigurable manufacturing system is relatively small and is a one-time cost, whereas the other costs (WIP, Material handling, over-due penalty) accumulate over time and depend upon production volume. The unit cost vector can also carry information about the user’s solution approach to the layout problem. A unit cost vector of {1, 10, 1, 0.1} emphasizes the importance of material handling cost over WIP inventory and due penalty costs with a ratio of 10:1, which is close to the scenario of traditional layout problem where only deterministic measures are considered. The unit cost vector of {5, 1, 10, 0.1} emphasizes the importance of WIP and cycle time related penalty costs over the relocation or material handling costs. Obviously, the unit cost vector determines the candidate layout that is finally chosen. As shown in Tables 6 and 7, different unit costs lead to different choices of layout. When the unit cost vector is {5, 1, 10, 0.1}, the pure functional layout L1 has the minimum overall cost. But when the unit cost vector is {1, 10, 1, 0.1}, cellular layout L0 has the minimum cost, which suggests keeping the current layout. To interpret the problem graphically, we assume the dimension of cost measures equals two. For example, let us only consider WIP inventory level and material handling cost while choosing between candidate layouts. Plotting the WIP and material handling cost of each layout gives us a set of points for each of the five layouts, as shown in Figure 9. Overall cost of the manufacturing system can be represented by a series of parallel contour lines whose normal 26
equals the unit cost vector. For example, if the unit cost vector is {5, 1}, the value of the contour across point L1 equals 330.7 and the value of the contour across point L3 equals 388.3. The optimal layout is the point such that the value of the contour across it has the minimum value among all contours across the candidate layout points.
180
388.3 330.7 L1
MHD
160
L2 L3 C1{5,1}
140
L4 L0
120
1371.3
C2{1,10}
20
40
60
80
WIP
Figure 9. WIP and material handling cost as layout selection criteria
The optimal layout must be a vertex of the convex hull for all candidate layout points. Further, it is the vertex first touched when we move the contour line along the direction of unit cost vector toward the convex hull. In Figure 9, if the unit cost vector is {5, 1}, then the first vertex touched is L1, but when the unit cost vector is {1, 10}, the vertex first touched is L0. The analysis process can be extended into finite dimension Hilbert space and can also lead to the development of a graphical decision support tool for candidate layouts comparison and selection. The above analysis is based on MPA’s outputs, which are average values or approximations. Of course there is a risk of making type I or II errors. Take a simple case where we only consider WIP inventory level and their upper and lower bounds are available. For the example shown in Figure 10, on average layout L2 is better than layout L4, but when WIP level of L2 actually takes the value marked by B and that of L4 takes the value marked by A, we are 27
making error by choosing L2. However, when comparing layouts L1 and L2, since the two intervals are not overlapping, we could say L1 is better than L2 with relative high confidence. Being an analytical tool, MPA calculates lower and upper bounds for each performance measure. A
B
L2 L1
L4
WIP
Figure 10. Case where bounds interval of performance measures overlap
For higher dimensional cost measures, it is not safe to say that as long as the region (or polygon) within performance measures’ lower and upper limits of the two candidate layouts are not overlapping, then one layout is better than another. For example in Figure 11, the WIP and material handling cost region of layout L1 and L3 (the two rectangles around points L1 and L3) are not overlapping, but the aggregate cost of the two layouts are. This motivates us to define cost interval of a layout as the minimum and maximum value of overall cost among all the points in the region (or polygon) delimited by layout performance measures’ lower and upper limits. The pair of contours in Figure 11 illustrates the cost intervals for layout L1, L3 and L4. When the cost intervals of two layouts are not overlapping, we say the layout with a smaller cost value dominates the other layout. When the cost intervals of two layouts overlap, we say one layout ties with the other. Note that dominate is an asymmetric relation while tie is an equivalence relation.
28
1691.3 MHD 1653.5
L1 L3
1685.1 Cost interval for L3
1645.5
C2{1,10} L4
1486.8 1457.2 WIP
Figure 11. Cost bounds interval for higher dimensional cost measures
With the concepts of dominate and tie, a general decision model for choosing between candidate layouts could be developed as shown in Figure 12.
1. Calculate cost intervals of all candidate layouts 2. Do until nothing to do For each pair of candidate layouts L1 and L2 If L1 dominates L2, delete L2 from candidate layouts If L2 dominates L1, delete L1 from candidate layouts If L1 ties with L2, do nothing 3. Use simulation to choose among remaining candidate layouts Figure 12. Decision model for choosing between candidate layouts
The motivation for developing decision model shown in Figure 12 is that it is hard to obtain the lower and upper bounds of manufacturing system performance measures with analytic models like MPA or QNA. For example, MPA can only calculate a rough lower and upper bounds for performance measures such as WIP inventory level and average waiting time in queue. The idea is to take the computational advantage of analytical models to quickly eliminate those apparently inferior candidate layouts. Simulation models can then be used to evaluate the rest. When run for sufficient number of replications and time per replication, simulation models can differentiate two layouts with a higher level of confidence. To move to the last (refinement) step, we assume the unit cost vector is {5, 1, 10, 0.1} and select layout L1, the functional layout.
29
5.4 Refinement of selected layout
The last step is to refine the selected layout before actually applying it to the manufacturing system. One intuitive way is to combine the good feature of other competing candidate layouts into the selected one, without jeopardizing benefits of the current layout. With respect to layout L1, one refinement might pertain to the position of machine D. Since there are significant amount of appearances of DÆG and GÆD in product routings, switching the position of two type G machines with those of machine type B and C will not change the routing of the product, but it reduces material handling cost of those products that transfer between machine types D and G. Other refinements are possible and the designer must explore appropriate ones before settling on a layout for the next period. C
E 3
B
F 5
H 2
A
F 8
D 1
A
J
I
K
J
11
L 11
12
G 10
G 9
K 11
10
9
I 4
K 10
6
4
D 1
J 6
7
G 7
G 7
7
Figure 13. Final Layout: Switch the position of D with B&C
6. Conclusions The reconfigurable layout problem only assumes that the production data for the next planning period is available, which is more realistic. While choosing between candidate layouts, reconfigurable layout considers not only deterministic material handling and relocation costs, but also the stochastic performance measures such as WIP inventory level and product lead time, making it a more comprehensive decision model. As a performance evaluation tool, MPA fits well in re-configurable layout framework. It takes arrival, routing, processing and facility data as input and yields stochastic cost (WIP level, lead time) of the manufacturing system. 30
7. Acknowledgment
We gratefully acknowledge support of the research presented in this paper by a National Science Foundation Grant DMI 9908437. 8. References
[1]
American Machinist (online edition) (1993), U.S. Builder Enters Small Lathe Market, Vol. 137, No. , July, pp. 10., Retrieved April 22, 2003
[2]
Arimond, J. and Ayles, W.R. (1993), Phenolics Creep Up on Engine Applications, Advanced Materials and Processes, Vol. 143, No. 6, pp. 20.
[3]
Asari, M. (1993), Electron Beam Hardening System, Advanced Materials and Processes, Vol. 143, No. 6, pp. 30-31.
[4]
Assembly Magazine (online edition) (1996), Norstart Custom Telephones Rely on Flexible Conveyor Systems, May issue, Retrieved June 2, 2002 www.assemblymag.com
[5]
Benjafaar, S. (2002), Modeling and analysis of congestion in the design of facility layouts, Management Science, v48, n5, pp. 679-704
[6]
Benjafaar, S., S.S. Heragu and S.A. Irani (2002), Next generation factory layouts: research challenges and recent progress, Interfaces, v32, n6, November-December, pp. 58-76
[7]
Bozer, Y.A. and S.C. Rim (1996), Branch and bound method for solving the bi-directional circular layout problem, Applied Mathematical Modeling, v20, n5, pp. 342-351
[8]
Chung, Y.K. (1999), Neuro-based expert system for facility layout construction, Journal of Intelligent Manufacturing, v10, n5, pp. 359-385
[9]
Finke, G., R.E. Burkard and F. Rendl (1987), Quadratic assignment problems, Annals of Discrete Mathematics, v31, pp. 61-82
[10]
Fujine, M., Kaneko, T. and Okijima, J. (1993), Aluminum Composite Replace Cast Iron, Advanced Materials and Processes, Vol. 143, No. 6, pp. 34-36.
[11]
Gartner (2001), The real time http://www4.gartner.com/pages/story.php.id.2632.s.8.jsp .
[12]
Gilmore, P.C. (1962),Optimal and sub-optimal algorithms for the quadratic assignment problem, Journal of the Society for Industrial and Applied Mathematics, v10, pp. 305-313
[13]
Harhalakis, G., T. Lu, I. Minis and R. Nagi (1996), A Practical Method for Design of Hybrid-type Production Facilities, International Journal of Production Research, v36, n4, pp. 897-918.
enterprise,
website,
31
[14]
Heragu, S. S. (1997), Facilities Design, PWS Publishing Company, Boston, MA
[15]
Heragu, S.S. and J.S. Kochhar (1994), Material Handling Issues in Adaptive Manufacturing Systems, The Materials Handling Engineering Division 75th Anniversary Commemorative Volume, ASME, New York, NY.
[16]
Heragu, S.S. and A. Kusiak (1990), Machine layout: an optimization and knowledgebased approach, International Journal of Production Research, v28, n4, pp. 615-635
[17]
Ho, Y.C. and C.L. Moodie (1998), Machine layout with a linear single-row path in an automated manufacturing system, Journal of Manufacturing Systems, v17, n1, pp. 1-22.
[18]
Houshyar, A. (1989), New solution to a special layout problem, SME Technical Paper (Series) MS, var paging MS89-383.
[19]
Hsieh, L. F. and D.Y. Sha (1996), Design process for automated guided vehicle systems: The concurrent design of machine layout and guided vehicle routes in tandam automated guided vehicle systems, Integrated Manufacturing Systems, v7, n6, pp. 30-38.
[20]
Huang, H. and S. A. Irani (2000), Hybrid Cellular Layouts for Machining and Fabrication Jobshops, Technical Report, Department of Industrial, Systems and Welding Engineering, Ohio State University, Columbus, OH, http://www-iwse.eng.ohiostate.edu/ISEFaculty/irani/Research/Next Generation.htm
[21]
Ikegaya, A., 2000, “Highly Productive And Reconfigurable Manufacturing System,” Technical Project Report, Intelligent Manufacturing Systems Initiative, www.ims.org.
[22]
Jajodia, S., Minis, I., Harhalakis, G., and J.M. Proth, (1992), CLASS-Computerized layout solutions using simulated annealing, International Journal of Production Research, v30, n1, pp. 95-108
[23]
Kochhar J.S. and S.S. Heragu (1999), Facility layout design in a changing environment, International Journal of Production Research, v37, n11, pp. 2429-2446
[24]
Kouvelis, P. and W. Chiang (1992), Simulated annealing approach for single row layout problems in flexible manufacturing systems, International Journal of Production Research, v30, n4, pp.717-732.
[25]
Kouvelis, P. and W. Chiang (1996), Optimal and heuristic procedures for row layout problems in automated manufacturing systems, Journal of the Operational Research Society, v47, n6, pp. 803-816.
[26]
Kouvelis, P. and A.S. Kiran (1991), Single and multiple period layout models for automated manufacturing systems, European Journal of Operational Research, v52, n3, pp. 300-314
32
[27]
Kouvelis, P., A.A. Kurawarwala and G. Gutierrez (1992), Algorithms for robust single and multiple period layout planning for manufacturing systems, European Journal of Operational Research, v63, pp. 287-303.
[28]
Kusiak, A. and S. S. Heragu (1987), The Facility Layout Problem, European Journal of Operational Research, v27, pp. 229-251
[29]
Lawler, E.L. (1963), The quadratic assignment problem, Management Science, v9, pp. 586-599.
[30]
Lilly, M.T. and J. Driscoll (1985), Simulating facility changes in manufacturing plants, Proceedings of 1st International Conference Simulation in Engineering, Stratford Upon Avon, UK
[31]
Meng, G. (2002), Open queuing network performance analyzer for reconfigurable manufacturing systems, Ph.D. thesis, Department of Decision Science and Engineering System, Rensselaer Polytechnic Institute
[32]
Meng, G. and S.S. Heragu (2002), Batch size modeling in a multi-item, discrete manufacturing system via an open queuing network, Technical Report #38-02-495, Department of Decision Science and Engineering System, Rensselaer Polytechnic Institute, Troy, NY 12180
[33]
Meng, G., S.S. Heragu and W.H.M. Zijm (2003), Two level manufacturing system performance analyzer, Technical Report #38-03-504, Department of Decision Science and Engineering System, Rensselaer Polytechnic Institute, Troy, NY 12180
[34]
Montreuil, B. and A. Laforge (1992), Dynamic layout design given a scenario tree of probable futures, European Journal of Operational Research, v63, n2, pp. 271-286
[35]
Montreuil,B. and U. Venkatadri (1991), Strategic interpolative design of dynamic manufacturing systems layouts, Management Science, v37, n6, pp. 682-694
[36]
Montreuil,B. and U. Venkatadri (1991), Strategic interpolative design of dynamic manufacturing systems layouts, Management Science, v37, n6, pp. 682-694
[37]
National Research Council, Visionary Manufacturing Challenges for 2020, 1998, National Academy Press, Washington, D.C.
[38]
Ngoi Kok Ann, B. and C.K. Chua (1994), Knowledge-based system for strip layout problem, Computers in Industry, v25, n1, pp. 31-44
[39]
Rajasekharan, M., B.A. Peters and T. Yang (1998), Genetic algorithms for facility layout design in flexible manufacturing systems, International Journal of Production Research, v36, n1, pp. 95-110.
[40]
Rosenblatt, M.J. (1986), The dynamics of plant layout, Management Science, v32, n1, pp. 76-86 33
[41]
Segal, M. and W. Whitt (1989), A queueing network analyzer for manufacturing, Teletraffic Science for New Cost-effective Systems, Networks and Systems, ITC-12, pp.1146-1152
[42]
Whitt, W. (1983), The queueing network analyzer, The Bell System Technical Journal, v62, n9, pp. 2779-2815
[43]
Yang, T. and B.A. Peters (1998), Flexible machine layout design for dynamic and uncertain production environments, European Journal of Operational Research, v108, pp. 49-64
34