Journal of the Geological Society, London, Vol. 164, 2007, pp. 129–141. Printed in Great Britain.
Cessation/reactivation of polygonal faulting and effects on fluid flow in the Vøring Basin, Norwegian Margin A . G AY & C . B E R N D T National Oceanography Centre of Southampton (NOCS), Empress Dock, Challenger Division for Seafloor Processes, Southampton SO14 3ZH, UK (e-mail:
[email protected]) Abstract: Polygonal faults, mainly oriented N50, N110 and N170, are abundant in the upper part of the muddominated Kai Formation (upper Miocene–lower Pliocene) of the Vøring Basin. A second, less-developed tier of polygonal faults, oriented N20, N80 and N140, exists at the base of the overlying Naust Formation (upper Pliocene–Present). The faults abruptly terminate upward below a thick interval of debris flows. We propose a dynamic model in which: (1) the development of polygonal faults discontinues temporarily as a result of a change in regional sedimentation, leading to inactive polygonal faults; (2) rapid emplacement of debris flows in the late Pleistocene creates a new interval of polygonal faults in the lower part of the Naust Formation immediately beneath the debris flow and some faults penetrate into the underlying Kai Formation; (3) some polygonal faults within the Kai Formation are reactivated and propagated upward into the base of the Naust Formation. The high interconnectivity between faulted layers allows the fluids to reach shallower depths, forming well-expressed pipes and pockmarks on the sea floor. The model of cessation/reactivation of polygonal faults constrains the sealing capacity of sedimentary cover over the reservoirs and helps to reconstruct the fluid migration history through the sedimentary column.
polygonal faults on fluid flow within the area. In the following sections, we will describe structures from the sea bed downwards. North of the Storegga Slide, sea-floor pockmarks are mainly located on the top of an anticline structure created by an underlying buried level of debris flows. We will first describe such structures and then show that these debris flows may be responsible for the reactivation of polygonal faults, which allow fluid to migrate and escape at the sea bed.
The Vøring Basin is well known for widespread fluid migration leading to the development of numerous pockmarks on the sea floor (Evans et al. 1996; Bu¨nz et al. 2003; Nouze´ et al. 2004). Previous studies, based on high-resolution 2D seismic data in the area, have shown that fluids ascend from the mud-dominated upper Miocene–lower Pliocene sequence (Berndt et al. 2003). This interval is affected by closely spaced small extensional faults displaying a polygonal pattern in plan view. High smectite content is considered to play an important role in the development of such structures (Cartwright & Dewhurst 1998; Dewhurst et al. 1999). Polygonal faults are often confined to stratigraphic horizons characterized by a distinct spacing within faults (Cartwright 1994; Lonergan et al. 1998). This could be due to different lithologies within the layers (Dewhurst et al. 1999). Polygonal faults were first interpreted as being caused by a volumetric contraction of fine-grained sediments leading to pore fluid expulsion (Cartwright & Lonergan 1996). A recent study conducted in the Lower Congo Basin supports this hypothesis, showing that polygonal faulting systems are initiated at the water–sediment interface during early stages of compaction (Gay et al. 2004). The development of such structures is a continuing process without change in environmental conditions such as sediment provenance, mineralogy and sedimentation rate. In vertical cross-sections, polygonal faults are characterized by distinct throw patterns, which can be used for their identification on seismic profiles. Throws increase with depth, reaching their maximum at about the middle of the faulted interval, and then gradually decrease towards the base (Cartwright & Lonergan 1996; Berndt et al. 2003; Gay et al. 2004). This suggests that, at great burial depths, the compaction through the process of volumetric contraction is finished. The objectives of this paper are threefold: (1) to investigate the geological processes that are active during the late stage of polygonal fault system development before it becomes inactive; (2) to understand how polygonal fault systems can be reactivated at a later stage: (3) to understand the effects of different tiers of
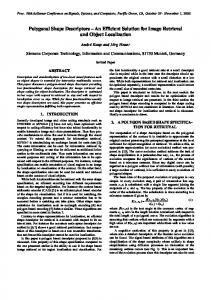
Geological setting Based on bathymetry, morphology and structural interpretation, the mid-Norwegian continental margin is divided into three main sub-basins: the Møre, Vøring and Lofoten basins. Our study area is located on the boundary of the Møre Basin and the Vøring Basin, just north of the northern sidewall of the Storegga Slide (Fig. 1). The Vøring Basin developed during several rifting phases in the mid–late Jurassic, the Late Cretaceous and before continental break-up in the Early Eocene (Skogseid & Eldholm 1989; Ren et al. 2003). Regional tectonomagmatic events controlled the relative sea-level fluctuations and formed the Early Palaeogene unconformities of the North Sea (Jones & Milton 1994). During the same period, extensive amounts of volcaniclastic material were deposited in this deep-water setting, which is one source for the abundant smectites in the Tertiary sediments (Jordt et al. 2000; Thyberg et al. 2000). The presence of extensive magmatic intrusive complexes has led to the formation of hydrothermal vent complexes (Fig. 2), mainly in the Møre and Vøring Basins offshore mid-Norway (Svensen et al. 2004). The Miocene–Lower Pliocene Kai Formation (Lowest Miocene–Upper Pliocene) is composed of fine-grained hemipelagic sediments (Dalland et al. 1988; Blystad et al. 1995; Rokoengen et al. 1995; Forsberg & Locat 2005). During the Oligocene and Miocene, before the deposition of the Top Kai Formation, this part of the margin underwent a period of compression (Vagnes et al. 1998) resulting in several dome structures. The most promi129
130
A . G AY & C . B E R N D T
Lofoten Basin
70°N
A
reg
Sto
Vøring Basin
S ga lide
65°N
Iceland
3D Seismic area
B
Møre Basin
Norway
0°
10°E
60°N 10°W
nent one extends into the study area and is called the HellandHansen Arch (Stuevold & Eldholm 1996; Hjelstuen et al. 1997). This is a north–south-striking, 280 km long anticline, defined by onlap of the upper Miocene and Pliocene sediments onto an intra-Miocene reflector (Fig. 2; Blystad et al. 1995). The uppermost stratigraphic unit is the Naust Formation (Upper Pliocene–Present). It is the result of the Plio-Pleistocene glacial–interglacial palaeoclimatic fluctuations and encompasses a thick wedge of clastic sediments east of the Helland-Hansen Arch and interlayered contourite deposits and glacial debris-flow deposits in the west (Stuevold & Eldholm 1996; Hjelstuen et al. 1999, 2005; Nygard et al. 2005). During this period, a large number of submarine landslides eroded the margin (Evans et al. 1996). The largest event was the retrogressive Storegga Slide at 7250 years bp (Elverhoi et al. 2002; Haflidason et al. 2002, 2004, 2005; De Blasio et al. 2004; Berg et al. 2005).
Database and processing The 3D seismic dataset used in this study was acquired by BP across the northern scarp of the Storegga Slide (Fig. 3). The data volume consists of two different acquisitions. The northern block was shot during April– August 1996 with a dual source (two Sleeve airguns), eight streamers configuration, whereas the southern block was shot during September 2001 with a dual source (two Bolt 1900 LLX T airguns), 10 streamers configuration. The two surveys were merged pre-stack to generate a single full fold cube from the whole area acquired. A full pre-stack time migration has been performed using an amplitude-preserved Kirchhoff algorithm. The 3D dataset covers an area of about 5000 km2 , with in-line and cross-line spacing of 25 m. Data have been loaded on a workstation using the Kingdom-Suite software. The 3D seismic analysis consists of extraction of continuous horizons by correlation through the 3D seismic block (Brown 1996; Kidd 1999). This process correlates the shape of the wavelength from each trace to the neighbours within a time interval determined by the interpreter. Other horizon attributes, derived from the
Fig. 1. Location map of the study area (modified after Bouriak et al. 2000). The location of the 3D seismic dataset (shaded area), across the northeastern flank of the giant Storegga Slide, and the location of the structural profile AB (Fig. 2) are shown.
seismic signal, have been calculated. In particular, we used the curvature attribute (Brown 1996), which is commonly used to describe the geometry of strata, to quantify the degree of deformation or strain in deformed strata and to predict fracture orientation and densities.
Morphology, structure and distribution of pockmarks and pipes We observed more than 40 pockmarks in the study area with an average density of 0.14 pockmarks per km2 (Fig. 4). They range from 100 m to 700 m in diameter, and from a few metres to 20 m in depth with respect to the surrounding sea bed. Most of them have a circular shape in plan view. In general, the diameter of pockmarks increases with water depth. The shaded relief map produced from the 3D seismic data shows that pockmarks are not randomly distributed on the sea floor (Fig. 4). They are mainly concentrated as a 2–4 km wide band, which extends along the crest of a WNW–ESE-striking anticline. The sea-floor pockmarks are the sea-bed expression of vertical zones of disturbance in the seismic data. These zones display two superimposed parts (Fig. 5). The upper part is ovoid in shape, 100–200 m in width, with high-amplitude reflectors deflected upward directly beneath the pockmark depression. This up-pulling of marginal reflectors suggests vertical movement rather than pure diffusive fluid migration processes (Bouriak et al. 2000). However, such deformed reflectors might be caused by an increase in seismic velocities, as a result of consolidation by carbonate precipitates within the pipe or gas hydrates. The deeper part of the anomaly is an inverted cone shape in crosssection. It is marked by a decrease in reflection amplitudes towards the centre. Up-bending of the reflections is restricted to the very edges of the anomaly, whereas reflections in the central part of the upper anomaly are deflected most. This indicates that the geometry seen on seismic profiles in the lower part is real
0
Km 5
2000
Meters
0
3D Seismic area
Neogene and Quaternary Paleocene and Paleogene Cretaceous Jurassic Triassic
Paleozoic and Mesozoic Paleozoic Basement and Paleozoic Eocene lavas Sills and dykes
B
SE
C E S S AT I O N / R E AC T I VAT I O N O F P O LY G O NA L FAU LT S
131
and not just a velocity pull-up effect. The amplitude decrease might, however, be a blanking effect of the overlying higher amplitudes. The acoustic anomalies beneath the pockmarks have previously been referred to as pipes, and were interpreted as fluid pathways (Hempel et al. 1994; Bouriak et al. 2000; Løseth et al. 2003; Tingdahl et al. 2001; Berndt et al. 2003; Bu¨nz et al. 2003; Hovland et al. 2005). North of the Storegga Slide, Berndt et al. (2003) reported that some pipes originate from the top of the lower polygonal fault interval in the Kai Formation and that others rise from the base of the hydrate stability zone (BHSZ), which is expressed on seismic profiles from this area as a BSR (bottom simulating reflector). However, no clear BSR is visible on seismic sections presented in this paper. Following the interpretation by Berndt et al. (2003), high-amplitude reflections below Horizon A should correspond to the BSR (Fig. 5) in the area.
Buried debris-flow deposit BSRs are characterized by a reversed polarity compared with the sea-floor reflection, indicating a downward reduction of seismic impedance (Hyndman & Spence 1992). In the Vøring Basin, this contrast in impedance is due to the presence of free gas below the gas hydrate stability zone (Bu¨nz & Mienert 2004). Highamplitude reflections below Horizon A continue from the identified BSR in the southwestern part of the study area. The high amplitudes are probably due to free gas trapped below the buried debris-flow deposits, which may act as a seal for fluid migration. The base of the buried debris-flow deposits corresponds to Horizon A at about 150–200 ms two-way travel time (TWT) below sea floor. A time–structure map of Horizon A shows that this surface is the base of various types of debris-flow deposits (Nygard et al. 2003). A well-imaged, 3 km wide glacial debris flow is found in the northeastern corner of the study area (Fig. 6a). It has a flat to concave base and convex surface, indicating a depositional environment. An internally chaotic body and folded surficial micro-relief preclude significant remoulding typical for landslides. Both edges of the debris flow are clearly visible on the seismic profile EF (Fig. 6a). The folds are mainly due to friction at the edges of the slide, which has created small reverse faults. In the south (Fig. 6b) a similar feature exists, suggesting the presence of a second debris flow. The deformation is characterized by a large number of folds. The seismic profile GH shows reverse faults dipping towards the north (Fig. 6b), indicating that only the southern part of this debris flow is included in the study area covered by 3D seismic data.
Polygonal fault tiers
Depth A (in m)
4000 -
3000 -
2000 -
1000 -
NW
The Top Kai Formation (Horizons C and D) is characterized by numerous steeply dipping closely spaced planar faults in most of the Vøring Basin (see the map given by Berndt et al. 2003). The individual faults have small offsets, commonly less than 100 m. The seismic section CD (Fig. 5; see Figs 3 and 4 for location) illustrates some key features of the polygonal fault interval in the Fig. 2. Structural profile AB (modified after Blystad et al. 1995) in the Vøring Basin. The volcanic margins off Norway are bounded to the west by normal oceanic crust. The magmatic activity, related to the Early Tertiary rifting, is expressed by sills and dykes, which have been mapped as far as 150 km east of the continent–ocean boundary. The 3D seismic dataset used in this study is located above the Helland-Hansen Arch. This is a north–south Cenozoic arch defined by onlap of the upper Miocene and Pliocene sediments onto an intra-Miocene reflector.
132
A . G AY & C . B E R N D T
study area. The offsets range from 5 m (limit of vertical resolution) to 20 m, with an average spacing of 100–500 m. The faults disappear downward below Horizon D (Miocene–Lower Pliocene) and up towards Horizon C (top of the Kai Formation), affecting an interval with an average thickness of 500 ms TWT. The faults do not abruptly end at a specific horizon. Some faults can locally offset the base and/or the top of the Kai Formation, suggesting that the vertical extent of the polygonal fault interval is not exclusively controlled by stratigraphy. As demonstrated by Dewhurst et al. (1999), the maximum fault frequency occurs in layers that include good reflections corresponding to very finegrained sediments. However, the high concentration of faults within highly reflective intervals may be a bias caused by the increased detectability at such intervals. The number of faults strongly increases both towards the base of the interval (Fig. 7), suggesting a higher level of deformation (Gay et al. 2004), and towards the maximum thickness of the layer overlying the fault interval (Fig. 8). To constrain the fabric of the polygonal fault interval, four horizons have been mapped within the study area (Horizons A– D; Fig. 9). These horizons have been chosen on the basis of their continuity and/or stratigraphical position (see Fig. 5 for stratigraphic details). Horizon A corresponds to the top of the polygonal faulted interval within the base of the Naust Formation. This horizon does not seem affected by faulting and is overlain by a seismically chaotic unit. The curvature map shows a number of predominantly NE–SW-oriented iceberg ploughmarks. Horizon A is located just over the base of the hydrate stability zone in this area (Bu¨nz et al. 2003). Horizon B is a continuous high-amplitude reflection within the lower part of the Naust Formation. It is characterized by 1–2 km diameter polygons on the dip map. These discontinuities are very subtle and cannot easily be seen on seismic sections (Fig. 5). However, this horizon is locally affected by real throws (Fig. 7). Horizon C has been identified as the top of the Kai Formation (Dalland et al. 1988; Evans et al. 2003). The horizon is just above a regional erosional unconformity and is the top of a heavily faulted interval. The faults are partly listric in seismic profiles (Figs 5 and 7) and polygonal in cross-section (Fig. 9). Horizon D is a continuous reflector within the Kai Formation. This horizon is located close to the base of the polygonal fault interval. There is a distinct difference in the size of polygons between the eastern and western part of the study area on Horizons C and D. This is probably due to the regional north–south HellandHansen Arch on which this system developed. To constrain the organization of faults within the polygonal fault intervals a statistical analysis was performed. The length and azimuth of each fault have been measured on curvature maps of Horizons A–D (Fig. 9). The systematic mapping of faults displays a complex organization in plan view. Excluding manually deformations caused by scours, we mainly focused on rectilinear or sub-rectilinear segments organized in contiguous polygons. Long segments result from the coalescence of several shorter segments. For the statistical measurements, each segment was considered as an individual fault.
Fig. 3. Shaded relief map of sea floor produced from the entire 3D seismic dataset. The northern part is deformed by the doming of the Helland-Hansen Arch. The southern part of the study area corresponds to the giant Storegga Slide. Pockmarks are mainly concentrated north from the slide scarp (see Fig. 4 for details).
C E S S AT I O N / R E AC T I VAT I O N O F P O LY G O NA L FAU LT S
133
Fig. 4. Shaded relief map of sea floor (see Fig. 3 for location). Pockmarks are concentrated along the axis of an anticline structure that is oriented ENE– WSE. The locations of the seismic profiles CD, KL and MN are shown on this map (see Figs 5, 8 and 10).
This method allows 862 faults to be identified on Horizon A. The rose diagram of the frequency of faults shows three main directions: N20, N80 and N140. On Horizon B 1083 faults have been counted. Two populations exist on this horizon: one major population with faults oriented N20, N80 and N140 (the same directions as on Horizon A) and a minor population with faults oriented N50, N110 and N170. The same method has been applied to Horizon C, where 2043 faults have been counted. The rose diagram of the fault frequency shows two populations for Horizon C: one dominant population with faults oriented N50, N110 and N170 (corresponding to the population identified on Horizon A and to the minor population on Horizon B), and a minor population with faults oriented N20, N80 and N140 (corresponding to the major population on Horizon B). Horizon D is characterized by 912 faults mainly oriented N50, N110 and N170. Even if the polygons do not look hexagonal, the angle
between the major fault directions is always 608. Thus, the three identified directions of each population approach the directions necessary to form a hexagon. In the Vøring Basin, the statistical analysis on Horizons A–D allows us to identify two distinct populations of faults, which developed in two distinct intervals: a lower interval (interval 1: Horizons C and D) dominated by faults oriented N50, N110 and N170, and an upper interval (interval 2: Horizons A–C) with faults mainly oriented N20, N80 and N140. Horizons B and C host both populations but in opposite proportions. This observation is confirmed on cross-section, with the detailed seismic profile MN showing that some faults from interval 1 propagate up into interval 2 (Fig. 10). Furthermore, interval 1 is characterized by offsets increasing with depth from Horizon C, which is typical of a continuing process of polygonal faulting during burial. Interval 2 is mostly characterized by
134
A . G AY & C . B E R N D T
Stratigraphy
C
D
Seafloor -
Naust O Naust R Late Pleistocene Late Pliocene Top Kai -
Horizon A BSR Horizon B Horizon C -
ms TWT
Opal CT Early Pliocene Miocene
Horizon D -
0 Km 2
0 200
Pockmark Seafloor -
Chimney Submarine landslides interval
Partly deformed sediments Polygonal faults (throw constant along the fault plane)
Horizon A Horizon B -
Erosional surface
Horizon C Polygonal faults (throw increases with depth)
Polygonal faults Horizon D -
constant offsets along fault planes, which could indicate an instantaneous or a short time process.
Discussion The mechanism by which fluids move up the sedimentary column to the surface is not well constrained. During burial the sediment porosity decreases because of loading by overlying sediments. A set of processes, such as particle reorientation and fluid expulsion, leads to the decrease of void spaces between particles (Maltman 1994; Vasseur et al. 1995). Vertical migration of fluids through thick (up to 600 m), low-permeability finegrained sediments cannot occur at a rate sufficient to explain the observed sea-floor seeping structures in a context known not to be overpressured in shallow sediments. However, numerous fluid escape features on the sea bed and widespread hydrate systems provide evidence for a focused fluid flow system on the midNorwegian margin (Berndt et al. 2003; Berndt 2005). These observations suggest that focused fluid flow is a much more efficient process for fluid migration than diffusive flux (Abrams 1992; Brown 2000) and is responsible for the development of pockmarks (Abrams 1996; Orange et al. 1999). In particular, polygonal fault systems, which develop in shallow sequences (0– 700 m below sea floor), represent intervals with a high drainage potential for pore fluids and for fluids migrating from deeper levels (Verschuren 1992; Gay 2002; Gay et al. 2004; Hansen et al. 2005). Such fault systems allow deeper fluids to migrate through a very fine-grained cover, which is commonly considered as highly impermeable.
Acoustic Blanking
Fig. 5. Seismic profile CD produced from the 3D seismic dataset. The Kai Formation throughout the Vøring Basin is characterized by numerous polygonal faults with small offsets (5–20 m) and an average spacing of 100–500 m. The polygonal faults affect an interval with an average thickness of 500 ms TWT (from Horizon C to Horizon D). Although the base of the Naust Formation (below the debris-flow interval and over Horizon C) does not seem affected by such faulting on the seismic profile, polygonal faults have been clearly identified on Horizons A and B, using curvature maps.
Nature of sediments and origin of polygonal faults Possible processes involved in the development of polygonal faults include syneresis of colloidal sediments (Dewhurst et al. 1999), Rayleigh–Taylor instabilities caused by density inversions and gravity collapse (Watterson et al. 2000), and faulting controlled by residual shear strength and low coefficients of friction (Goulty 2001). Syneresis is a process of spontaneous volumetric contraction and concomitant fluid expulsion (Scherer 1986; Van Vliet et al. 1991) that leads to shrinkage in muddominated sequences (Cartwright & Lonergan 1996; Dewhurst et al. 1999). The development of polygonal fault systems seems highly dependent on a combination of grain size and mineralogy, as demonstrated in the Early Tertiary mudrocks from the North Sea Basin (Dewhurst et al. 1999). In the North Sea, lithological analyses conducted on wells show that the amount of shrinkage in layers appears to increase as the grain size decreases and smectite content increases (Dewhurst et al. 1999). Studies conducted in the Vøring Basin have shown that the Kai Formation is dominated by a clayey ooze (Al clay minerals .60%) with a very high smectite content (Forsberg & Locat 2005). This composition forms a fine texture of flocculated particles ,2 ìm in size. It also exhibits a typical shrinkage upon freeze–drying leaving voids that are about 5 ìm in width (Forsberg & Locat 2005). This process occurs at a microscale, and could explain the spontaneous contraction of mud-dominated sediments within the Kai Formation, leading to the formation of normal faults at a larger scale. Therefore, it is possible that the faults within the Kai Formation (between Horizons C and D) oriented N50, N110 and N170 have been formed by this process, although other
C E S S AT I O N / R E AC T I VAT I O N O F P O LY G O NA L FAU LT S
135
Fig. 6. Isochron map of the base of the debris-flow interval. This surface hosts various debris-flow deposits that have been mapped. (a) and (b) show a 3D view of two debris-flow deposits. Cross-sections (seismic profiles EF and GH) show that they have a flat to concave base and a convex top. An internally chaotic body and folded surficial micro-relief preclude significant remoulding typical of slide failure. The debris-flow deposits took place just over Horizon A, which is affected by polygonal faults.
processes may dominate polygonal faulting elsewhere. Gay et al. (2004) have shown that vertical loading plays an important role in the spontaneous initiation of polygonal faults. The erosional event that occurred at the end of the Kai period and before the Naust period (see Fig. 5) may be responsible for an unloading effect on underlying sediments. This process could be responsi-
ble for the cessation of pore fluid escape from the Kai formation and movements along polygonal faults. The basal unit of the Naust Formation, which includes Horizons A and B, represents sedimentation in a hemipelagic environment. Despite the fact that the Naust Formation is rich in floc-forming smectites, the abundance of larger silt particles such
136
A . G AY & C . B E R N D T
Fig. 7. Seismic profile IJ produced from the 3D seismic dataset. The number of faults, particularly between Horizons C and B, is higher where the debris-flow interval is thicker (to the north). This suggests that the emplacement of debris flows might play a role in the development and reactivation of polygonal faults. The enlarged view shows clearly that real fault throws develop within the interval between Horizon C (top of Kai Formation and top of lower interval of polygonal faults) and the base of the debris-flow interval.
as mica grains (Forsberg & Locat 2005) may have prevented the spontaneous compaction and polygonal faulting through syneresis. In the Vøring Basin, the instantaneous loading by an overlying debris-flow deposit has increased the vertical effective stress beneath it, leading to the formation of polygonal faults (oriented N20, N80 and N140) within the basal unit and to the reactivation of previous polygonal faults (oriented N50, N110 and N170) within the Kai Formation. Although the polygonal fault system within the Kai Formation sediments may itself be a major source of fluids (Berndt et al. 2003), polygonal fault intervals have a high drainage potential for pore fluids and for fluids migrating from deeper levels (Gay et al. 2004). Fluids are preferentially driven along the triple junction of three contiguous polygonal faults, which cross-cut the entire interval (Gay et al. 2004; Hansen et al. 2005). In this case the interconnected network of faults within the Kai and the
Naust formations allows deeper fluids to migrate upward, reaching the base of the debris-flow deposit.
The submarine debris-flow deposit acting as a seal In the Storegga Slide area the change in slide volume was associated with a change in sediment type, from initially hemipelagic marine and glaciomarine sediments (first initial phase of sliding), to slides originating from more compacted and overconsolidated glacigenic debris (Berg et al. 2005). The landslide deposits found in the Storegga area contain large blocks or slabs of nearly intact sediment interspersed in remoulded material forming folds. In general, landslide deposits and glacigenic debris-flow deposits are composed of stiffer materials on the upper part of the slope (Dimakis et al. 2000; De Blasio et al. 2005). Debris-flow deposits are also less sensitive than marine or
C E S S AT I O N / R E AC T I VAT I O N O F P O LY G O NA L FAU LT S
137
Fig. 8. Perspective view of the 3D seismic block representing Horizon C and the seismic profile KL (see Fig. 4 for location). An isopach map of the debris-flow deposit interval displayed over the 3D block shows a strong correlation between the thickness of the debris-flow interval and the concentration of polygonal faults on Horizon C.
glacial marine sediments (Berg et al. 2005; Kvalstad et al. 2005). As debris-flow deposits have an unsorted grain-size distribution and thus a higher plasticity index and low water content (Mitchell 1993) compared with surrounding sediments (i.e. slope hemipelagic sediments), they act as seals for fluids migrating from deeper levels, and they can be trapped beneath them. The impedance contrast between an overconsolidated and impermeable thick debris-flow deposit and a gas-charged layer beneath it can explain the high seismic reflection amplitude below Horizon A (Figs 5 and 7). Because of the sealing capacity of debris-flow deposits, fluids cannot migrate further vertically. Under their own buoyancy, fluids migrate up-slope along strata (Mienert et al. 2002; Bu¨nz &
Mienert 2004). They are trapped underneath the hydrate-bearing sediments and give rise to enhanced reflections that terminate at BSR depth in the Storegga Slide depression. Therefore, the pore pressure will increase progressively in the free gas interval. Gas hydrates and buried debris-flow deposits may act as a valve and overpressure is episodically released (Bouriak et al. 2000; Mienert et al. 2002; Bu¨nz et al. 2003). Ultimately, this process results in the vertical migration of fluids, forming blow-out pipes and leading to the development of sea-floor pockmarks. Because of irregular sedimentation over the submarine debris-flow deposit, the present-day sea floor corresponds to a large anticline structure that has a WNW–ESE trend. Fluids are preferentially expelled at the crest of the anticline and pockmarks are aligned
138
A . G AY & C . B E R N D T
along its axis, which could indicate the direction of the debrisflow deposit. Finally, the debris-flow interval plays the role of a seal and contributes to the temporary entrapment of fluids and to their redistribution up to the sea bed.
M
N
Polygonal faults
Upper interval 2 - Horizon B
Offset constant with depth
- Horizon C 0 ms TWT
- Opal C/T
200
Lower interval 1 Offset increases with depth
0
Km
2
Fig. 10. Seismic profile MN showing the difference of offsets within the lower and upper intervals of polygonal faults. The offsets within the upper interval are almost constant along the fault plane, whereas those within the lower interval are increasing with depth.
Model of formation and reactivation of polygonal fault systems The schematic model in Figure 11 summarizes the processes of formation and reactivation of polygonal faults by the deposition of a debris-flow deposit on the northern flank of the Storegga Slide. As demonstrated further south in North Sea Tertiary mudrocks, separate intervals of polygonal faults usually have distinct fault spacings, orientations and fault trace shapes, as described by Lonergan et al. (1998). Those workers noted that there may be considerable interconnectivity of faults from one interval to an adjoining interval. In the Vøring Basin we propose a model that takes into account two processes of polygonal fault formation. The first is a continuous process of compaction by volumetric contraction of smectite-rich Kai Formation sediments. This process creates deformation that is progressively accommodated along faults during burial, and the fault throws increase downward, reaching their maximum at about the middle of the interval, and then decrease to zero at the base (Berndt et al. 2003; Gay et al. 2004). The second process is instantaneous compaction as a result of the sudden loading by the debris-flow deposit. This creates a new polygonal fault interval directly beneath it. The base of the Naust Formation is affected by polygonal faults with throws that are constant along the fault plane. This is strong evidence of the instantaneous character of the process. The deposition of the debris-flow deposit is also responsible for partial reactivation of polygonal faults within the underlying Kai Formation, and some of them propagate upward within the base of the Naust Formation. Ultimately, fluids (deeper thermogenic fluids and remaining intraformational fluids) accumulate underneath the debris-flow deposit after ascending from deeper levels through these interconnected polygonal fault inter-
Fig. 9. Curvature maps of Horizons A–D. Concave-up and concavedown structures are represented in black and white, respectively. Using this attribute, polygonal faults are highlighted in black. They have been counted and measured, and the results are reported in rose diagrams. This statistical analysis of faults helps to define two main intervals of faults. The lower interval (top of Kai Formation) is affected by faults oriented N50, N110 and N170, whereas the upper interval (base of Naust Formation) is affected by faults oriented N20, N80 and N140. However, Horizons B and C are affected by both populations, but at opposite concentrations. This suggests that faults of the lower and upper intervals are interpenetrating.
C E S S AT I O N / R E AC T I VAT I O N O F P O LY G O NA L FAU LT S
139
Anticline axis
Modern seafloor
Pockmarks
Deeper fluid migration
Landslide - Horizon A Upper Interval 2
New faults creation
Faults reactivation
Lower Interval 1
Loading
No change
Erosional surface
Horizon B Lower Interval 1
Horizon C Horizon D -
vals. Finally, they escape to the surface, creating pipes and seafloor pockmarks.
Conclusion Three-dimensional seismic data provide new insights into the Vøring Basin history and improve the understanding of postdepositional processes that affect the sedimentary column. Analysis of such data makes it possible to understand the link between fluid escape structures on the sea floor, underlying pipes, the deposition of a buried debris-flow deposit and polygonal fault intervals. We propose a model that integrates with previous hypotheses (Cartwright & Lonergan 1996; Lonergan et al. 1998; Dewhurst et al. 1999; Watterson et al. 2000; Nicol et al. 2003; Gay et al. 2004; Goulty & Swarbrick 2005), as follows. (1) A buried polygonal fault interval is not definitely sealed. It can be reactivated by loading by an overlying deposit such as a thick submarine debris-flow deposit. (2) As proposed by Dewhurst et al. (1999), a high smectite content can induce spontaneous shrinkage of mud-dominated
Fig. 11. Schematic model summarizing the processes of formation and reactivation of polygonal faults. The lower interval is affected by a continuous process of compaction by volumetric contraction of smectite-rich Kai Formation sediments at shallow depths. The deformation is progressively accommodated along faults during burial and the throws increase both upward and downward (Berndt et al. 2003; Gay et al. 2004). The upper interval is affected by instantaneous compaction as a result of the sudden loading by debris-flow deposits, creating a new polygonal faults interval with constant offsets along the faults. The deposition of the debris-flow deposit is also responsible for partial reactivation of polygonal faults within the underlying Kai Formation, and some of them propagate upward within the base of the Naust Formation. This helps fluids to ascend from deeper levels through these interconnected polygonal fault intervals, forming pipes and sea-floor pockmarks.
sediments. This is the case in the Vøring Basin within the Kai Formation, and has led to the formation of a ‘typical’ polygonal fault interval with throws increasing both upward and downward from about the middle of the interval. (3) Separate intervals of polygonal faults with distinct fault populations have been created by two different processes. Faults within the Kai Formation have been created by a continuous volumetric contraction starting at shallow burial depths (0– 20 m). The progressive reduction in bed length through contraction is balanced by an incremental increase in the amount of displacement distributed along the faults. Throws increase with depth and then decrease because the number of faults increases towards the base of the interval (Gay et al. 2004). Finite deformation is accommodated through a large number of faults. Faults within the base of the Naust Formation have been caused by an instantaneous process, which could be due to the deposition of the overlying submarine debris-flow deposit. The instantaneous character is evidenced by throws that are constant along the fault planes. (4) The shape of the cover over the debris-flow deposit
140
A . G AY & C . B E R N D T
corresponds to an anticline structure oriented WNW–ESE. Fluids migrating through the interconnected network of polygonal faults are concentrated at the crest of this anticline. As they are expelled, they form a large band of pockmarks on the sea floor, which could be an indicator of the axis of the debris-flow deposit, and could also be an indicator of the thickest part of the underlying debris-flow deposit. Even if a sequence does not seem affected by polygonal faults (i.e. they are not identified on seismic profiles), the use of highresolution 3D seismic data allows detection of polygonal fault system. The base of the Naust Formation, below the buried submarine debris-flow deposit, is clearly affected by polygonal faulting. However, in contrast to the polygonal fault interval within the Kai Formation, this system was formed instantaneously (on a geological time scale). The detailed study of 3D seismic data helped us to reconstruct the fluid migration history in shallow sediments of the Vøring Basin. In particular, our interpretation allowed us to link processes that were not connected in previous studies, such as the formation and reactivation of polygonal faults and the deposit of debris-flow deposits. These observations are highly relevant to predictive models describing the occurrence of pockmarks on slopes characterized by fine-grained sediments and to models of slope failure interpretation related to fluid expulsion. We gratefully acknowledge BP Norway for providing the data for this study. Initial discussions with M. Lopez were greatly appreciated in bridging the gap between mechanical constraints and geometrical model.
References Abrams, M.A. 1992. Geophysical and geochemical evidence for subsurface hydrocarbon leakage in the Bering Sea, Alaska. Marine and Petroleum Geology Bulletin, 9, 208–221. Abrams, M.A. 1996. Distribution of subsurface hydrocarbon seepage in nearsurface marine sediments. In: Schumacher, D. & Abrams, M.A. (eds) Hydrocarbon Migration and its Near-surface Expression. AAPG Memoirs, 66, 1–14. Berg, K., Solheim, A. & Bryn, P. 2005. The Pleistocene to recent geological development of the Ormen Lange area. Marine and Petroleum Geology, 22, 33–44. Berndt, C. 2005. Focused fluid flow on continental margins. Philosophical Transactions of the Royal Society, Series A, 363, 2855–2871. Berndt, C., Bunz, S. & Mienert, J. 2003. Polygonal fault systems on the midNorwegian margin: a long-term source for fluid flow. In: Van Rensbergen, P., Hillis, R.R., Maltman, A.J. & Morley, C.K. (eds) Subsurface Sediment Mobilization. Geological Society, London, Special Publications, 216, 283– 290. Blystad, P., Brekke, H., Faerseth, R.B., Larsen, B.T., Skogseid, J. & Torudbakken, B. 1995. Structural Elements of the Norwegian Continental Shelf. Part II: The Norwegian Sea Region. Norwegian Petroleum Directorate Bulletin, 8. Bouriak, S., Vanneste, M. & Saoutkine, A. 2000. Inferred gas hydrates and clay diapirs near the Storegga Slide on the southern edge of the Voring Plateau, Offshore Norway. Marine Geology, 163, 125–148. Brown, A. 2000. Evaluation of possible gas microseepage mechanisms. AAPG Bulletin, 84, 1775–1789. Brown, A.R. (ed.) 1996. Interpretation of Three-dimensional Seismic Data. AAPG Memoirs, 42. Bu¨nz, S. & Mienert, J. 2004. Acoustic imaging of gas hydrate and free gas at the Storegga Slide. Journal of Geophysical Research, 109, 1–15. Bu¨nz, S., Mienert, J. & Berndt, C. 2003. Geological controls on the Storegga gas-hydrate system of the mid-Norwegian continental margin. Earth and Planetary Science Letters, 209, 291–307. Cartwright, J. & Lonergan, L. 1996. Volumetric contraction during the compaction of mudrocks: a mechanism for the development of regional-scale polygonal fault systems. Basin Research, 8, 183–193. Cartwright, J.A. 1994. Episodic basin-wide fluid expulsion from geopressured shale sequences in the North Sea basin. Geology, 22, 447–450. Cartwright, J.A. & Dewhurst, D.N. 1998. Layer-bound compaction faults in fine-grained sediments. Geological Society of America Bulletin, 110, 1242–
1257. Dalland, A., Worsley, D. & Ofstad, K. 1988. A Lithostratigraphic Scheme for the Mesozoic and Cenozoic Succession Offshore Mid- and Northern Norway. Norwegian Petroleum Directorate Bulletin, 4. De Blasio, F.V., Elverhoi, A., Issler, D., Harbitz, C.B., Bryn, P. & Lien, R. 2004. Flow models of natural debris flows originating from overconsolidated clay materials. Marine Geology, 213, 439–455. De Blasio, F.V., Elverhoi, A., Issler, D., Harbitz, C.B., Bryn, P. & Lien, R. 2005. On the dynamics of subaqueous clay rich gravity mass flows: the giant Storegga Slide, Norway. Marine and Petroleum Geology, 22, 179–186. Dewhurst, D.N., Cartwright, J.A. & Lonergan, L. 1999. The development of polygonal fault systems by syneresis of colloidal sediments. Marine and Petroleum Geology, 16, 793–810. Dimakis, P., Elverhoi, A. & Hoeeg, K. et al. 2000. Submarine slope stability on high-latitude glaciated Svalbard–Barents Sea margin. Marine Geology, 162, 303–316. Elverhoi, A., De Blasio, F.V. & Butt, F.A. et al. 2002. Submarine masswasting on glacially influenced continental slopes—processes and dynamics. In: Dowdeswell, J.A. & O’Cofaigh, C.et al. (eds) Glacier-influenced Sedimentation on High Latitude Continental Margins. Geological Society, London, Special Publications, 203, 73–87. Evans, D., King, E.L., Kenyon, N.H., Brett, C. & Wallis, D. 1996. Evidence for long-term instability in the Storegga Slide region off western Norway. Marine Geology, 130, 281–292. Evans, D.J., Hopson, P.M., Kirby, G.A. & Bristow, C.R. 2003. The development and seismic expression of synsedimentary features within the Chalk of southern England. Journal of the Geological Society, London, 160, 797–813. Forsberg, C.F. & Locat, J. 2005. Mineralogical and microstructural development of the sediments on the Mid-Norwegian margin. Marine and Petroleum Geology, 22, 109–122. Gay, A. 2002. Les marqueurs ge´ologiques de la migration et de l’expulsion des fluides se´dimentaires sur le plancher des marges passives matures. Exemples dans le Bassin du Congo. PhD Thesis, Universite´ des sciences et Technologies de Lille 1. Gay, A., Lopez, M., Cochonat, P. & Sermondadaz, G. 2004. Polygonal faults– furrows system related to early stages of compaction—Upper Miocene to present sediments of the Lower Congo Basin. Basin Research, 16, 101–116. Goulty, N.R. 2001. Mechanics of layer-bound polygonal faulting in fine-grained sediments. Journal of the Geological Society, London, 159, 239–246. Goulty, N.R. & Swarbrick, R.E. 2005. Development of polygonal fault systems: a test of hypotheses. Journal of the Geological Society, London, 162, 587–590. Haflidason, H., Nygaardm, H., Torgersen, B. & Sulebakk, J.R. 2002. Morphological analyses of the seafloor in the Storegga Slide Area. Norsk Hydro Report, Final Report, AS 100-03/02. Haflidason, H., Sejrup, H.P. & Nygard, A. et al. 2004. The Storegga Slide: architecture, geometry and slide development. Marine Geology, 213, 201– 234. Haflidason, H., Lien, R., Sejrup, H.P., Forsberg, C.F. & Bryn, P. 2005. The dating and morphometry of the Storegga Slide. Marine and Petroleum Geology, 22, 123–136. Hansen, J.P.V., Cartwright, J.A., Huuse, M. & Clausen, O.R. 2005. 3D seismic expression of fluid migration and mud remobilization on the Gjallar Ridge, offshore mid-Norway. Basin Research, 17, 123–139. Hempel, P., Spiess, V. & Schreiber, R. 1994. Expulsion of shallow gas in the Skagerrak—evidence from subbottom profiling, seismic, hydroacoustical and geochemical data. Estuarine, Coastal and Shelf Science, 38, 583–601. Hjelstuen, B.O., Eldholm, O. & Skogseid, J. 1997. Voring Plateau diapir fields and their structural and depositional settings. Marine Geology, 144, 33–57. Hjelstuen, B.O., Eldholm, O. & Skogseid, J. 1999. Cenozoic evolution of the northern Voring margin. Geological Society of America Bulletin, 111, 1792– 1807. Hjelstuen, B.O., Sejrup, H.P., Haflidason, H., Nygard, A., Ceramicola, S. & Bryn, P. 2005. Late Cenozoic glacial history and evolution of the Storegga Slide area and adjacent slide flank regions, Norwegian continental margin. Marine and Petroleum Geology, 22, 57–69. Hovland, M., Svensen, H. & Forsberg, C.F. et al. 2005. Complex pockmarks with carbonate-ridges off mid-Norway: products of sediment degassing. Marine Geology, 218, 191–206. Hyndman, R.D. & Spence, G.D. 1992. A seismic study of methane hydrate marine bottom simulating reflectors. Journal of Geophysical Research, 97, 6683– 6698. Jones, R.W. & Milton, N.J. 1994. Sequence development during uplift: Paleogene stratigraphy and relative sea-level history of the Outer Moray Firth, UK North Sea. Marine and Petroleum Geology, 11, 157–165. Jordt, H., Thyberg, B.I. & Nøttvedt, A. 2000. Cenozoic evolution of the central and northern North Sea with focus on differential vertical movements of the basin floor and surrounding clastic source areas. In: Nøttvedt, A. (ed.) Dynamics of the Norwegian Margin. Geological Society, London, Special
C E S S AT I O N / R E AC T I VAT I O N O F P O LY G O NA L FAU LT S Publications, 167, 219–243. Kidd, G.D. 1999. Fundamentals of 3D seismic volume visualization. In: Proceedings of the Offshore Technology Conference, 31, 823–835. Kvalstad, T.J., Andresen, L., Forsberg, C.F., Berg, K., Bryn, P. & Wangen, M. 2005. The Storegga slide: evaluation of triggering sources and slide mechanics. Marine and Petroleum Geology, 22, 245–256. Lonergan, L., Cartwright, J. & Jolly, R. 1998. The geometry of polygonal fault systems in Tertiary mudrocks of the North Sea. Journal of Structural Geology, 20, 529–548. Løseth, H., Wensaas, L., Arntsen, B., Hanken, N.-M., Basire, C. & Graue, K. 2003. 1000 m long gas blow-out pipes. In: American Association of Petroleum Geologists Annual Meeting Expanded Abstracts, 12, 109. Maltman, A. 1994. The Geological Deformation of Sediments. Chapman & Hall, London. Mienert, J., Berndt, C., Laberg, J.S. & Vorren, T.O. 2002. Slope instability of continental margins. In: Wefer, G., Billett, D., Hebbeln, D., Jorgensen, B.B., Schlu¨ter, M. & Van Weering, T. (eds) Ocean Margin Systems. Springer, Berlin, 179–193. Mitchell, J.K. 1993. Fundamentals of Soil Behaviour, 2nd. Wiley, New York. Nicol, A., Walsh, J.J., Watterson, J., Nell, P.A.R. & Bretan, P.G. 2003. The geometry, growth and linkage of faults within a polygonal fault system from South Australia. In: Van Rensbergen, P., Hillis, R.R., Maltman, A. & Morley, C.K. (eds) Subsurface Sediment Mobilization. Geological Society, London, Special Publications, 216, 245–261. Nouze´, H., Contrucci, I. & Foucher, J.-P. et al. 2004. Premiers re´sultats d’une e´tude ge´ophysique sur le flanc nord des glissements de Storegga (Norve`ge). Comptes Rendus Ge´oscience, 336, 1181–1189. Nygard, A., Haflidason, H. & Sejrup, H.P. 2003. Morphology of a debris flow lobe in the Helland Hansen area investigated with 3D seismic data. In: Mienert, J. & Weaver, P. (eds) European Margin Sediment Dynamics: Side-scan Sonar and Seismic Images. Springer, Berlin, 63–65. Nygard, A., Sejrup, H.P., Haflidason, H. & Bryn, P. 2005. The glacial North Sea Fan, southern Norwegian Margin: architecture and evolution from the upper continental slope to the deep-sea basin. Marine and Petroleum Geology, 22, 71–84. Orange, D.L., Greene, H.G. & Reed, D. et al. 1999. Widespread fluid expulsion on a translational continental margin: mud volcanoes, fault zones, headless canyons, and organic-rich substrate in Monterey Bay, California. Geological Society of America Bulletin, 111, 992–1009. Ren, S., Faleide, J.I., Eldholm, O., Skogseid, J. & Gradstein, F.M. 2003. Late
141
Cretaceous–Paleocene tectonic development of the NW Vøring Basin. Marine and Petroleum Geology, 20, 177–206. Rokoengen, K., Rise, L., Bryn, P., Frengstad, B., Gustavsen, B., Nygaard, E. & Saettem, J. 1995. Upper Cenozoic stratigraphy on the mid-Norwegian continental shelf. Norsk Geologisk Tidsskrift, 75, 88–104. Scherer, G.W. 1986. Drying gels. I. General theory. Journal of Non-Crystalline Solids, 87, 199–225. Skogseid, J. & Eldholm, O. 1989. Vøring Plateau continental margin: seismic interpretation, stratigraphy, and vertical movements. In: Winkler, W.R. (ed.) Proceedings of Ocean Drilling Program Scientific Results, 104. Ocean Drilling Program, College Station, TX, 993–1030. Stuevold, L.M. & Eldholm, O. 1996. Cenozoic uplift of Fennoscandia inferred from a study of the mid-Norwegian margin. Global and Planetary Change, 12, 359–386. Svensen, H., Planke, S., Malthe-Sørenssen, A., Jamtveit, B., Myklebust, R., Eidem, T.R. & Rey, S.S. 2004. Seep carbonate formation controlled by hydrothermal vent complexes: a case study from the Vøring Basin, the Norwegian Sea. Nature, 429, 542–545. Thyberg, B.I., Jordt, H., Bjorlykke, K. & Faleide, J.I. 2000. Relationships between sequence stratigraphy, mineralogy and geochemistry in Cenozoic sediments of the northern North Sea. In: Nøttvedt, A. (ed.) Dynamics of the Norwegian Margin. Geological Society, London, Special Publications, 167, 245–272. Tingdahl, K.M., Bril, A.H. & de Groot, P.F. 2001. Improving seismic chimney detection using directional attributes. Journal of Petroleum Science and Engineering, 29, 205–211. Vagnes, E., Gavbrielsen, R.H. & Haremo, P. 1998. Late Cretaceous–Cenozoic intraplate contractional deformation at the Norwegian continental shelf: timing, magnitude and regional implications. Tectonophysics, 300, 29–46. Van Vliet, T., Van Dijk, H.J.M., Zoon, P. & Walstra, P. 1991. Relation between syneresis and rheological properties of particle gels. Colloid and Polymer Science, 269, 620–627. Vasseur, G., Djeran-Maigre, I., Grunberger, D., Rousset, G., Tessier, D. & Velde, B. 1995. Evolution of structural and physical parameters of clays during experimental compaction. Marine and Petroleum Geology, 12, 941–954. Verschuren, M. 1992. An integrated 3-D approach to clay tectonic deformation. PhD Thesis, Renard Centre of Marine Geology, University of Gent, Belgium. Watterson, J., Walsh, J., Nicol, A., Nell, P.A.R. & Bretan, P.G. 2000. Geometry and origin of a polygonal fault system. Journal of the Geological Society, London, 157, 151–162.
Received 5 December 2005; revised typescript accepted 8 March 2006. Scientific editing by Ian Alsop