IEEE TRANSACTIONS ON POWER DELIVERY, VOL. 17, NO. 2, APRIL 2002
489
Recognition of Impulse Fault Patterns in Transformers Using Kohonen’s Self-Organizing Feature Map Abhinandan De and Nirmalendu Chatterjee, Senior Member, IEEE
Abstract—Determination of exact nature and location of faults during impulse testing of transformers is of practical importance to the manufacturer as well as designers. The presently available diagnostic techniques more or less depend on expertized knowledge of the test personnel, and in many cases are not beyond ambiguity and controversy. This paper presents an artificial neural network (ANN) approach for detection and diagnosis of fault nature and fault location in oil-filled power transformers during impulse testing. This new approach relies on high discrimination power and excellent generalization ability of ANNs in a complex pattern classification problem, and overcomes the limitations of conventional expert or knowledge-based systems in this field. In the present work the “self-organizing feature map” (SOFM) algorithm with Kohonen’s learning has been successfully applied to the problem with good diagnostic accuracy. Index Terms—Artificial neural network (ANN), fault diagnosis, impulse testing, self-organizing feature map (SOFM), transformer.
I. INTRODUCTION
T
HE NEW fault recognition and diagnostic approach described in this paper utilizes the transfer function method [1], [2] of impulse testing as the base for evaluation which is presently used as an additional method of diagnosis in many test laboratories and generally preferred to conventional time record analysis due to its inherent advantages. The diagnostic method presented in the paper uses the experience associated with transfer function test technique of different researchers [2], [3], which reveal that frequency of the affected pole(s) can provide important information about size and location of a shortcircuited section in a transformer winding during impulse test and involves the concepts of advanced signal processing and the artificial neural network (ANN)-based pattern recognition algorithm to achieve high diagnostic accuracy. The proposed diagnostic method may be of importance to the transformer manufacturers since no general method of diagnosis of impulse failure is yet available other than complete dismantling of the affected winding section, which is a costly as well as time consuming affair. Analysis of large set of results by researchers has revealed that a fault located close to the ground terminal of a winding is reflected by the presence of new poles at a lower frequency in the amplitude–frequency plot of the transfer function, whereas fault occurring near the H.V. terminal induce new poles in the high frequency region of the spectrum. For a particular type of
Manuscript received February 14, 2000; revised August 24, 2001. The authors are with the Department of Electrical Engineering, Jadavpur University, Calcutta, India (e-mail:
[email protected];
[email protected]). Publisher Item Identifier S 0885-8977(02)02719-X.
winding, it may not be difficult to establish a correlation between the distortion of the transfer function and the associated nature and location of the fault. Also, it is not impossible to generalize this relationship for other similar types of winding designs. Although detection of failure may be possible by simple superimposition and comparison of several transfer function amplitude–frequency plots, in practical cases, it often becomes difficult to detect very delicate and minute differences in the plots. Moreover, identification of fault nature and location from the available data requires extensive study and expertise and once again leads to controversy among the experts. ANNs can be used for detection and discrimination of fault patterns in a transformer winding. Faults in different parts of a high voltage winding generate distinct patterns in the transfer function amplitude–frequency spectrum, although discrimination of a large set of patterns is difficult and some times impossible for the human eye. This complex task of “large set pattern classification,” however, can be successfully handled by ANNs. If the frequency response of transfer function for a particular winding with deliberately planted faults at various locations are presented as a set of input patterns to a neural network, the task is to identify the patterns with “similar distinctive feature” and group them together. Since the number of such groups and the feature of each group are not explicitly stated, the method is unsupervised. Unlike “expert” or “knowledge-based” systems [4], [5], this new approach neither requires an exhaustive collection of “expert knowledge” regarding the relationship between location and nature of a fault and its associated transfer function frequency response, nor does it require any explicit “rule base” for discrimination of fault nature and location. In several patterns, the features are often not unambiguous and it may be difficult to group them into distinct classes. The patterns may exhibit a continuum in some feature space. In such a case, instead of rigid clustering of the patterns, it may be of interest to know how close a given pattern is to some known pattern. This concept is known as “feature mapping” and is ideally suited for the present problem. In the present work, the self-organizing feature map (SOFM) principle with Kohonen’s learning algorithm [6]–[8] has been proposed for determination of fault location and its nature in a transformer winding. The SOFM is a new high potential software tool, which has found applications in the solution of many real world engineering problems [7]–[9]. In engineering, the most straightforward application of SOFM is in the identification and abstraction of hidden information from high-dimensional raw data, which is otherwise very difficult to perceive and
0885-8977/02$17.00 © 2002 IEEE
490
IEEE TRANSACTIONS ON POWER DELIVERY, VOL. 17, NO. 2, APRIL 2002
Fig. 2.
Fig. 1.
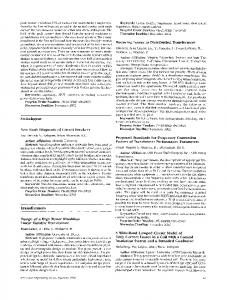
Typical competitive learning neural network.
interpret. This visualization of high-dimensional data and discovery of categories is known as “exploratory data analysis.” The SOFM converts a complex, nonlinear relationship between high-dimensional data into simple geometric relationships on a low-dimensional display. Thus, it compresses the information while preserving the most important topological relationship of the primary data elements. II. FEATURE MAPPING NETWORK A feature-mapping network is a kind of competitive learning neural network having an input layer of linear units and an output layer of units with nonlinear output function. The neurons in the output layer are extensively interconnected in an “on-center and off-surround” fashion, and produces at equilibrium, larger activation on a single output unit and small activation on all other units. This leads to a “winner-take-all” situation [6] where, when the input pattern is removed, only one unit with largest activation in the output layer is available. This particular unit is designated as the “winner” for the presented pattern. If the feedforward weights of the network are suitably adjusted, different units in the output layer can be made to win for different input patterns. The main distinction of the featuremapping network with other conventional competitive learning neural networks is the orderly, geometrical arrangement of the output units in the form of a one-dimensional (1-D) or twodimensional (2-D) array and the significance attached to the neighboring units during training. During recall of information, activation of the neighboring units in the output layer signifies that the input patterns corresponding to these units are “similar.” Thus, feature mapping can be viewed as a “nonlinear projection” or “topology preserving map” [6] from the space of high-dimensional input signals to a low- dimensional array of neurons. Consider a simple competitive learning network of Fig. 1, in , which attempts to map a set of input pattern vectors on to an array of (normally 1-D or 2-D) units, such that any patterns are preserved topological relationship among the and are represented by the network in terms of spatial distribution of unit activation. The more related two patterns are in the input space, the closer one can expect the position in the output and array of winner units to represent these patterns. If
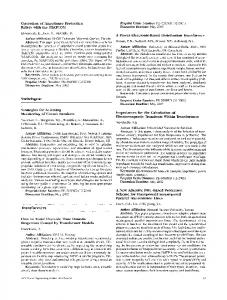
Illustration of adjustment of weights during training process.
are “similar” input patterns or topological neighbors in , and if and are the location of the corresponding winner units is expected in the output array, the Euclidean distance as The idea is to to be small, and develop a topographic map of the input pattern vectors so that similar patterns trigger nearby units in the output feature space. Thus a global organization of the output units is expected to emerge for a set of input patterns. III. SOFM ALGORITHM Assume a set of input variables are definable as a real . With each vector unit in the output layer, we associate a real weight vector . Assume the neurons in the output layer are organized in an array. Assuming the and denoted by general measure of distance between are the input patterns and its image is supposed to . have an array “win-index” defined as in such a way that mapping is orThe basic task is to define dered and descriptive of the distribution . The most common choice of the distance measure is the Euclidean distance . between input and weight vectors: The steady activation value of any output neuron for an external input depend on the angle between the input and weight vectors as shown in Fig. 2. In a traditional SOFM algorithm, the weight vector is adjusted in such a way that it moves toward the input vector to reduce the angle between the two. The unsupervised learning rule can be expressed as (1) is called a neighborhood function. A suitable where choice of the neighborhood function may be a Gaussian function of the type (2) where, refers to the position of the winning unit in the orderly arrangement of output units. The neighborhood function . Thus, the weight associated has its maximum value at with the winning unit and its neighboring units are updated at a faster rate than the distant units. This satisfies the basic philosophy of “lateral competition” [6], [7] among the output neurons. The width of the Gaussian function is gradually decreased to reduce the neighborhood region in successive iteration of the
DE AND CHATTERJEE: RECOGNITION OF IMPULSE FAULT PATTERNS IN TRANSFORMERS
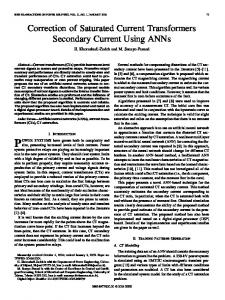
Fig. 3. Sample amplitude frequency spectrum of winding admittance for unfaulty winding.
training process. Kohonen defined the neighborhood function as for
(3)
for
(4)
and
is the set of neighboring units, specified by a diswhere is the tance limit of output unit from the winning unit . , which learning rate parameter of the network can also be changed as a function of time during a training phase. IV. MODEL STUDIES As a case study, the response of a three-phase, 50-Hz, 3-MVA, 33/11-kV, ON, DY11 transformer with continuous disk winding has been considered with the 33-kV winding subjected to standard 1.2/50- s full lightning impulse voltage as per I.E.C. specification. A full-scale lumped-parameter high-frequency analog model of the aforesaid 33-kV transformer has been employed to demonstrate the proposed technique physically. The model has been based on a coil-by-coil representation of the actual winding and consists of 80 representative disk coils, with provision for variation of major winding parameters within a certain limit. A low voltage recurrent surge generator has been employed as the source of the standard lightning impulse. The test voltage and neutral current at winding ground terminal were recorded by a Tektronics digital storage oscilloscope and, subsequently, the digitized records were transferred to a PC, through hardware ports for further processing of the recorded wave data. The relatively small 3-MVA transformer has been chosen considering the cost involved in the development of such analog models. To evaluate the applicability of the proposed diagnostic technique to larger capacity transformers, similar experiments have been performed on an EMTP equivalent circuit model of a 132/33-kV, 31.5-MVA, three-phase transformer [10] with artificially simulated winding faults. A. Simulation of Faults In the present investigation, the two most frequently occurring fault types have been simulated. They include the following:
491
a) voltage sensitive longitudinal flashover of insulation between adjacent disk coils of a winding (series fault in disk coil); b) voltage sensitive transverse flashover of insulation between a coil and nearby objects at ground potential (coil to ground shunt fault). Thyristorized nonlinear bilateral electronic circuitry have been employed to create polarity-symmetric nonlinear low-resistance fault paths, when the developed voltage across the faulting device exceeds a predetermined initiation level of either polarity. The experiment focused on the distinction between the effects caused by faults of different natures and different physical locations of occurrence in the winding. For the sake of easy reference, the full length of the winding has been divided into four major sections along the length of the winding from H.V. terminal to ground, each comprising of 20 disks, representing 25% of the winding length. A simultaneous record of applied voltage and neutral current have been taken for unfaulty winding as well as for “series” and “shunt” faults at three representative disks from each of the four major sections. In second phase, the major winding parameters were varied in two steps by 5% and 10% of their nominal design values and similar records were collected at four representative disks, taking one from each section. B. Data Processing Time domain digital data of impulse voltage and winding neutral current were recorded simultaneously over a time frame of 0–102.2 s with a sampling interval of 0.2 s, in the form of two vectors of dimension 512 each. The discrete fast fourier transform (DFFT) of these discrete time signals have been performed by a transformation routine to convert these signals into a corresponding amplitude–frequency spectrum, with a maximum frequency of 2.5 MHz and a resolution of 9.8 kHz. An algorithm has been developed for dividing the neutral current harmonics by respective voltage harmonics to obtain frequency response of the winding admittance (transfer function) in the form of a vector of dimension 257. Fig. 3 illustrates a sample amplitude frequency spectrum of the winding admittance for the unfaulty condition of the winding. V. APPLICATION OF SOFM Conventional feature-mapping neural network architecture has been employed with an input layer of 257 neurons to match the dimension of input pattern vectors. Mapping is done from this high-dimensional input space to an orderly-arranged low-dimensional output array of size 50. The number of output layer neurons have been chosen higher than the maximum possible number of distinct input patterns likely to be presented for better organization and quicker convergence of the feature map. A vigilance parameter, called “tolerable winner distance,” which is the average Euclidean distance measured between input and weight vectors for winner neurons corresponding to different input patterns, has been preset to monitor the convergence of the mapping process. Adjustment of this parameter
492
IEEE TRANSACTIONS ON POWER DELIVERY, VOL. 17, NO. 2, APRIL 2002
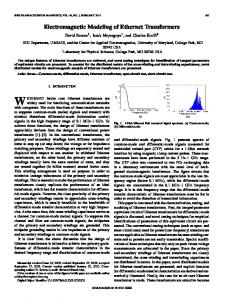
TABLE I GROUPING OF THE INPUT PATTERNS INTO CLASSES BASED ON TOPOLOGICAL SIMILARITY
changes the rigidity of the classification process. A smaller value of the vigilance parameter makes the classification process more rigid and a higher number of distinct features are available at the output for a given set of input patterns. Whereas, a larger value of the vigilance parameter corresponds to a less stringent classification, as the inputs with nearly “similar features” are classified in the same category. In the present work, the vigilance parameter has been optimized by the process of trial and error to obtain the desired number of distinct features in the output for a known set of input patterns during the training phase. A proper selection of the vigilance parameter has been able to successfully classify 17 input patterns into nine distinct groups, as illustrated in Table I, which corresponds to the following classes: 1) unfaulty wave; 2) series fault within 0–25% of the winding; 3) series fault within 25–50% of the winding; 4) series fault within 50–75% of the winding; 5) series fault within 75–100% of the winding; 6) shunt fault within 0–25% of the winding; 7) shunt fault within 25–50% of the winding;
TABLE II EVALUATION
OF THE MAPPING PROCESS BY PRESENTATION OF NEW PATTERNS TO THE NETWORK
8) shunt fault within 50–75% of the winding; 9) shunt fault within 75–100% of the winding. However, it is to be noted that there is no predefined class label. The classification of the input patterns can only be made from visualization of the topological relationship of the winner neurons in the feature map. The input patterns having “similar- features” always activate identical or topologically close locations in the ordered feature space and tend to manifest clusters. In case of a 1-D output feature space, location of an output
DE AND CHATTERJEE: RECOGNITION OF IMPULSE FAULT PATTERNS IN TRANSFORMERS
neuron can be expressed in terms of an array index which is also a measure of radial distance of the neuron from origin. Thus, input patterns with “similar-features” can be identified by searching for patterns with identical or closer values of win-indices. From Table I, it can be interpreted that the identification and discrimination of fault nature is comparatively easier for line end faults, as “series” and “shunt” faults near line end produces vastly different spectrum patterns and this is reflected by the highest scattering of win-indices in the feature map. Whereas the network found difficulties in discriminating “series” and “shunt” faults near winding ground, as they generate similar spectrum patterns. However, occurrence of a fault was clearly indicated in either case by a large topological dissimilarity with unfaulty wave. For the rest of the part of the winding, the network exhibited good diagnosis accuracy in identification and correct indication of fault nature and location. In the second stage of experimentation, further evaluation of the mapping process was done by presenting fault patterns with simulated faults at new locations which were not in the list of “code book pattern vectors” [6]. The neural network could correctly recognize these new patterns and classified them according to topological similarity with the preexisting patterns as illustrated in Table II. A guess of fault nature and location can be made with sufficient accuracy from win-indices of these new patterns in Table II. In the third and final stage of experimentation, the generalizing ability of the neural network was evaluated by presentation of few additional patterns, obtained from experiment on a similar winding model having slightly different values of the basic winding parameters. This generalizing ability is of great importance since, a high generalizing ability can ensure correct identification of fault patterns from test data of real transformers by a network trained with “code book patterns” collected from model winding. Because, even in spite of very efficient modeling, the response of an untanked model winding is likely to show deviation from that of the actual transformer and the network should be capable of generalizing and not simply memorizing the correlation between nature of distortion of transfer function and associated fault pattern. The results illustrated in Table III confirm that the network can recognize the fault patterns with reasonably accurate indication of faulty coil and nature of fault for variation of parametric values approximately up to 5% of the original. The diagnostic accuracy drops with further variation of parameters and, with 10% variation, only the faulty sections can be identified instead of exact location. The experiments on the 132-kV transformer yielded slightly more accurate diagnosis results due to absence or lack of noise in the records available from the EMTP model as compared to those obtained from the 33-kV analog model with transient recorder and digitizer. VI. CONCLUSION A neural network based approach to recognition of impulse fault patterns in a transformer winding has been proposed in this paper. The method relies on high discrimination power and
493
TABLE III EVALUATION OF GENERALISING ABILITY OF THE NETWORK
excellent generalization ability of neural networks in complex pattern recognition and classification tasks and is superior to conventional “expert” or “knowledge based” systems in the sense that it does not require a huge expert knowledge for recognition of a fault pattern, nor does it demand any rule to be described explicitly for discrimination of different fault patterns. The “self-organizing feature map” (SOFM) with Kohonen’s learning algorithm has been employed for diagnosis of winding faults during impulse testing of transformers. The
494
IEEE TRANSACTIONS ON POWER DELIVERY, VOL. 17, NO. 2, APRIL 2002
proposed method applied on a model winding could successfully recognize and discriminate the nature as well as location of the occurrence of faults for “line-end” and “mid-winding” faults. However, discrimination of “earthed-end” faults was not always successful. Generalization ability of the proposed method was tested by variation of major parameters of the model winding to evaluate the applicability of the method to real transformers. Sufficient diagnostic accuracy was obtained for variation of parameters within 5% of nominal value. REFERENCES [1] R. Malewski and B. Poulin, “Impulse testing of power transformers using transfer function method,” IEEE Trans. Power Delivery, vol. 3, pp. 476–489, Apr. 1988. [2] E. Hanique, “A transfer function is a reliable tool for comparison of full and chopped impulse tests,” IEEE Trans. Power Delivery, vol. 9, pp. 1261–1266, July 1994. [3] E. P. Dick and C. C. Erven, “Transformer diagnostic testing by frequency response analysis,” IEEE Trans. Power App. Syst., vol. PAS-97, pp. 2144–2153, June 1977. [4] C. Fukai and J. Kawakami, “An expert system for fault section estimation using information from protective relays and circuit breakers,” IEEE Trans. Power Delivery, vol. 1, pp. 83–90, Oct. 1986. [5] C. E. Lin, J. M. Ling, and C. L. Huang, “An expert system for transformer fault diagnosis using dissolved gas analysis,” IEEE Trans. Power Delivery, vol. 8, pp. 291–298, Jan. 1993. [6] T. Kohonen, “The self-organizing map,” Proc. IEEE, vol. 78, pp. 1464–1480, 1990. [7] T. Kohonen, E. Oja, O. Simula, A. Visa, and J. Kangas, “Engineering application of the self-organizing map,” Proc. IEEE, vol. 84, pp. 1358–1384, Oct. 1996.
[8] T. Kohonen, “The neural phonetic typewriter,” IEEE Comput., vol. 27, pp. 11–22, Mar. 1988. [9] Z. Huang and A. Kuh, “A combined self-organizing feature map and multi layer perceptron for isolated word recognition,” IEEE Trans. Signal Processing, vol. 40, pp. 2651–2657, Nov. 1992. [10] A. De and N. Chatterjee, “Part winding resonance: Demerit of interleaved high voltage transformer winding,” Proc. Inst. Elect. Eng.—Elect. Power Applicat., vol. 147, no. 3, pp. 167–174, May 2000.
Abhinandan De was born in West Bengal, India, on December 21, 1973. He received the B.S. and M.S. degrees in electrical engineering from Jadavpur University, Calcutta, India, in 1996 and 1999, respectively. He is currently pursuing the Ph.D. degree in electrical engineering from Jadavpur University. His areas of interests include the performance and behavioral study of transformer windings, transformer diagnostics, and artificial intelligence. Mr. De received the Certificate of Merit from The Institution of Engineers (India) in 2000. He is also an Associate Member of The Institution of Engineers (India).
Nirmalendu Chatterjee (SM’93) was born in Calcutta, India, on February 15, 1939. He received the Ph.D. degree in electrical engineering from Jadavpur University, Calcutta, in 1973. Currently, he is a Professor of electrical engineering at Jadavpur University. His main research interests include studies on high-voltage transformer winding and insulation, gas discharge phenomena, and insulator pollution. Dr. Chatterjee is a Fellow of The Institution of Engineers (India) and the Chairman of the IEEE Calcutta section.