TELKOMNIKA Indonesian Journal of Electrical Engineering Vol.12, No.2, February 2014, pp. 1037 ~ 1045 DOI: http://dx.doi.org/10.11591/telkomnika.v12i2.4325
1037
Remote Sensing Image classification based on Optimized Support Vector Machine Liqian cheng, Wenxing Bao* School of Computer Science and Engineering, Beifang University of Nationalities, No. 204 Wenchang, North-Street, Xixia District, Yinchuan Ningxia, P. R. China 750021 *Corresponding author, e-mail:
[email protected]
Abstract To resolve the problem of wetland remote sensing image classification, this paper presents an improved classification algorithm. In this algorithm, genetic algorithm (GA) selection, crossover operation is introduced to the standard particle swarm optimization algorithm (PSO) to form a hybrid particle swarm optimization algorithm (GAPSO). The hybrid algorithm can exploit the advantages of the genetic algorithm and particle swarm algorithm respectively to the full to obtain the global optimal parameters of support vector machine (SVM). Thus the wetland remote sensing image can be classified more accurately. Taking Ningxia Shahu wetland remote sensing images as an example, this paper makes a classification of wetland remote sensing images using optimized support vector machine, and the outcome of the experiment shows that this algorithm has better classification effect than that of similar algorithms. Keywords: remote sensing image classification, support vector machine (SVM), parameter optimization, hybrid particle swarm optimization (GAPSO) Copyright © 2014 Institute of Advanced Engineering and Science. All rights reserved.
1. Introduction Wetland is one of the most important natural resources and the ecological system, which plays an important role in climate regulation, water conservation, environmental purification, dispersion of flood and the conservation of biological diversity. The rapid development of remote sensing technology has made it become an important means of wetland monitoring and classification, and has been widely used in the monitoring of wetlands [1]. SVM (Support Vector Machine), a learning approach originally developed by Vapnik and co-workers according to the statistical theory is based on the structural risk minimization principle. It can solve the problems of small sample, nonlinear, high dimension commendably and become one of the hotspot of machine learning. It has been applied to solve classification problems, function approximation and time series prediction successfully etc. In recent years, an increasing number of scholars use SVM to image classification and information extraction and SVM has often been found to provide higher classification accuracies than other widely used pattern recognition techniques, such as the maximum likelihood and the multilayer perceptron neural network classifiers. Furthermore, SVM appears to be especially advantageous in the presence of heterogeneous classes for which only few training samples are available [2-4]. Like other learning algorithms, the function of SVM heavily depends on the parameters of its model . The SVM classifier trained by different parameters varies widely in performance. If the value of the parameter is improper, then SVM could not achieve the learning effect as it is expected. Before training the SVM classifier it is necessary for us to optimize the parameters to obtain the best combination of parameters. There are several frequently-used methods such as grid search algorithm, genetic algorithm (GA), gradient descent algorithm etc. The grid search algorithm is intuitive and easy to realize and is a good choice when there is few parameters, however, when applying grid search method, one might need to increase the parameter range and/or decrease the step size to increase the accuracy of the optimal solution. However, this will result in a cumbersome time consuming search process [5]. Gradient descent method has improved significantly in the calculation of time, but the stability is not high [6]. Particle swarm optimization (PSO) is put forward by Eberhart and Kennedy in 1995, which was inspired by the social behavior of bird flocking and fish schooling [7]. Its main feature is simple in principle, fewer parameters, fast convergence and required little domain Received August 4, 2013; Revised September 6, 2013; Accepted October 7, 2013
1038
ISSN: 2302-4046
knowledge [8]. This algorithm has obtained widespread application in fields of the function optimization, neural network training, and can be achieved good results. Just as other evolutionary algorithms, it is easy to fall into local minima and premature convergence. Thus, Lovbjerg [9] proposed a hybrid particle swarm algorithm which combines the idea of genetic algorithm and particle swarm optimization algorithm. Genetic algorithms has been sucessfully used to optimaze inelligent algorithms such as artificial neural network [10]. The combination of the two methods can play to their strengths on the premise of guaranteeing the diversity of particle swarm, in addition, it has accelerated the speed of convergence and enhanced the ability to jump out of local minima and find global optimal solution. This paper uses SVM classifier optimized by hybrid particle swarm algorithm (GAPSO_SVM) to classify the remote sensing image of Ningxia Shahu, it also applies grid search algorithm, genetic algorithm and particle swarm optimization algorithm to optimize SVM in order to compare with GAPSO_SVM. The classification result shows that the classification accuracy of GAPSO_SVM is better than other three classifiers. The rest of this paper is organized as follows. Section 2 gives a brief introduction to SVM, the importance of the parameters of SVM, PSO algorithm and describes how the proposed approach optimizes parameters. Section 3 detailed experiments are carried out to evaluate Grid_SVM, GA_SVM, PSO_SVM, and our GAPSO_SVM method. Finally, the conclusions are presented in Section 4.
2. Research Methods 2.1. SVM SVM is proposed to solve linearly separable problem originally. Let us assume that the training set consists of n vectors {( x , y ) ,i=1,2,…,n}. A target y (1,1) is associated to each i
i
i
vector x i . If the two classes are linearly separable, then at least one hyperplane ω x i b 0
can be found to separate the two classes without errors. SVM classifier will look for an optimal hyperplane that maximizes the distance between the closest training sample and the separating hyperplane. Normalizing and b, the distance between the two types of the sample points is 2 , making 2 get the maximum means making || ω ||2 get the minimum, all above can be 2 || ω || || ω || described by the mathematical language, namely: 2 min |||| 2 s.t. ( x i b) 1, i 1, 2,..., n y i
(1)
The problem can be obtained by solving saddle points of LaGrange function.
( , b, i ) Where
1
n
|| || [ y ( x 2 2
i 1
i
i
i
b ) 1]
(2)
0 are the Lagrange multipliers [11]. i
In practical applications, most of the problem is nonlinear, and then linearly separable SVM is incapable of action. For the nonlinearly separable problem, the method usually used is nonlinear mapping : R H that is the sample of the original input is mapped to a higher dimensional space. Then construct optimal separating hyperplane in the high dimensional feature space. According to the functional theory, as long as one kind of kernel function d
K x i , x j satisfies Mercer condition, it corresponds to an inner product of the inner space.
Therefore, linear classification can be achieved by using an appropriate inner product function
TELKOMNIKA Vol. 12, No. 2, February 2014: 1037 – 1045
ISSN: 2302-4046
TELKOMNIKA
1039
K x i , x j in the optimal hyperplane after nonlinear transformation. After mapping into a high dimensional feature space the corresponding dual problem becomes: n 1 n n αi α α y y K (x i, x j ) maxQ α 2 i 1 j1 i j i j i 1 n α y 0 s.t . i 1 i i , i 1, 2, , n 0 α C i
(3)
Thus the optimal classification function is: n
f ( x ) sgn( iy iK ( xi , x j ) b * ) *
(4)
i 1
In classification of SVM, an appropriate kernel function and model parameters has a great influence on the performance of classification algorithms. Research shows that RBF kernel function performs better in classification accuracy and classification time than other kinds of kernel function in the classification of remote sensing images [12, 13]. Therefore, RBF kernel function is employed for the classification of TM images in this study. Wherein, the model parameters including kernel function parameters and the error penalty factor. In the SVM training process, the error penalty factor C (ie, upper bound of support vector coefficient α) is to achieve a compromise between the proportion of misclassified samples and the complexity of the algorithm. If the value of the error penalty factor C is too low, which means that the punishment for the empirical error is little; the complexity of the machine learning experience is small and the empirical risk value is large, which means " learning deficiency "; if C is infinite, all constraints must be met, which means that the training sample must be accurately classified, i.e. "over learning." The performance of SVM is also directly affected by the pros and cons of nuclear parameters. As the kernel functions, mapping functions as well as high-dimensional feature space have a one to one correspondence. As soon as the kernel function is determined, it implicitly determines the mapping function and high dimensional feature space. Kernel parameter changes actually alter the mapping function implicitly, thus changing the complexity of the sample in the distribution of high-dimensional feature space [Error! Bookmark not defined.]. 2.2. Particle Swarm Optimization In particle swarm optimization, each individual is called a "particle", which represents a potential solution. Assuming x i =( x i1, x i2,..., x iD ) is the position of the i-th particle in D-dimensional space; according to the preset fitness function (related to the problem) we calculate the current fitness value of x and evaluate the quality of the particle positions. v i =( v i1, v i2,..., v iD ) is the i
flight speed,
pbest =(p ,p ,...,p i
gbest =(g ,g ,...,g ) i
i1
i2
i1
i2
represents the optimal position for the i_th particle so far,
) iD
represents the optimal position for the whole particles so far. In each
iD
iterations, the particles update velocity and position according to the following formula:
v
k+1 id
=ω
v +c r (p - x )+c r (g - x k
k
id
1
k+1
k
k+1
id
id
id
x = x +v
1
id
id
2
2
id
k id
)
(5)
ω
i = 1, 2, ..., m, d = 1, 2, ..., D, is the inertia weight, it plays a role of balancing the global search and local search, k is the iteration number, r1 and r2 are [0,1] random numbers, these two parameters are used to maintain the diversity of the population, c1 and c2 are learning factors which make particles have self-summary and the ability to learn from outstanding individuals of groups [14]. Remote Sensing Image classification based on Optimized Support Vector… (Liqian cheng)
1040
ISSN: 2302-4046
Figure 1. Flowchart of PSO Algorithm. In hybrid particle swarm optimization algorithm, particles are endowed with a crossover probability; the probability of this hybridization is user-determined and independent of the particle's fitness value. In each iterations, selecting a specified number of hybrid particles based on the crossover probability and putting them in a pool, particles in the pool randomly crossed to produce the same number of offspring and parent particles are replaced with progeny particles, which can keep the number of particles constant. The nature of the genetic algorithm can improve the diversity of particle and particle search ergodicity but also to prevent particle swarm into local optimum and improve the algorithm against premature to better optimize the SVM classifier. The position and velocity of the offspring is updated as follows:
child1x i pi parent1 x i 1.0 pi parent 2 (x i )
(6)
child 2 x i pi parent 2 x i 1.0 pi parent1 (x i )
(7)
child1 v i =
child 2 v i =
parent 1 v i +parent 2 (v i )
|parent 1 v i +parent 2 v i | parent 1 v i +parent 2 (v i )
|parent 1 v i +parent 2 v i |
*|parent ( v i )|
(8)
parent ( v )|
(9)
1
*|
2
i
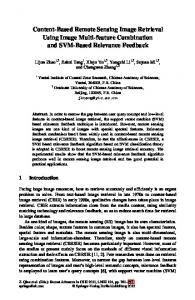
Since SVM based on RBF kernel function has two parameters C and γ, each particle represents a group of SVM kernel parameters (C, γ ), and classification accuracy is selected to be the fitness function. The specific description of GAPSO_SVM is as follows: 1) Set the size of the particle swarm, fitness error limits, maximum number of iterations allowed, inertia weight and learning factors c1, c2 and other parameters; 2) Initialize the position and velocity of particles; 3) Calculate the fitness of particles, set the current particles as the pbest, set the particle whose fitness is the best as the global optimum gbest; 4) Update the position and velocity of particles;
TELKOMNIKA Vol. 12, No. 2, February 2014: 1037 – 1045
TELKOMNIKA
ISSN: 2302-4046
1041
5) Select a specified number of particles based on the probability into the pool, the particles in the pool produce the same number of offsprings randomly by making hybrids with each other; 6) Check if it reaches the maximum number of iterations or the optimal solution; if it does then output the optimal solution otherwise proceed Step 3 to 6.
Figure 2. Flowchart of GAPSO_SVM Model
3. Experiment and Analysis The multispectral dataset used in our experiments is the Landsat TM5 remote sensing images of Ningxia Shahu wetland area taken on September 16, 2009. The first step is to make the image preprocessing and feature extraction. This part is done with the help of the ENVI software. Spectral features are adopted, since the spectral feature is the basic feature of remote sensing images and using spectral characteristics in image classification is the most simple and effective method. The image is cut out in ENVI4.8 software and the size is 256*256. Then the image is pretreated with PCA and the first three principal components which contain the most abundant characteristic information are chosen, the image as shown in Figure 3.
Figure 3. The Original Image Remote Sensing Image classification based on Optimized Support Vector… (Liqian cheng)
1042
ISSN: 2302-4046
The second step is the realization of the algorithms and the image classification. SVM algorithm and its parameter optimization are implemented by using the LibSVM toolbox based on Matlab platform. LibSVM is mainly used for solving classification and regression problems. The toolkit also provides the source code, so that users can develop their own functions expediently. In both the standard PSO model and the hybrid model, the parameters are set as
are between 0.1 and 100. The following. The searching range of SVM parameters C and cognition learning factor c1 and the social learning factor c2 are set to be 2, the inertia weight ω is 0.8. The population size is set to be 20, and the number of iterations is set to be 10, 20 and 50 respectively. The crossover probability of GAPSO is set to be 0.9. The population size and the number of iterations of GA are the same as that of GAPSO, the crossover probability and mutation probability are 0.7 and 0.01, respectively. The searching bound of grid search method parameter C, are set to be 2-8 and 28, and both of step values are set to be 0.8. To ensure the robustness experiment, the value of cross validation parameter k is set to be 5 folds. The study area contains three classes: water, desert and vegetation. The numbers of training samples randomly selected from the study area are: 1664, 4459, and 1456, respectively. Then choose the whole image as test samples. Figure 4 shows the classification result when the iteration is set to be 50.
(a)Grid_SVM
(b)PSO_SVM
(c) GA_SVM
(d) GAPSO_SVM
Figure 4. Classification Result when Iteration is 50 The comparison results obtained by the Grid_SVM, GA_SVM, PSO_SVM and GAPSO_SVM are shown in Table 1 to 3. Table 1 to 3 has shown the performance of the genetic algorithm, particle swarm algorithm and hybrid particle swarm optimization when the iterations TELKOMNIKA Vol. 12, No. 2, February 2014: 1037 – 1045
ISSN: 2302-4046
TELKOMNIKA
1043
γ
were 10, 20 and 50 respectively. The tables list the values of c and , C.V. accuracy, overall accuracy, Kappa coefficient and the time consumed. Table 1. C.V. Accuracy, Overall Accuracy, Kappa Coefficient of 10 Generations C.V.accuracy c/ overall accuracy Kappa coefficient Time(s)
Grid_SVM
PSO_SVM
GA_SVM
GAPSO_SVM
99.5831 1/16
99.6278 0.1/1.0740
99.6129 2.1484/8.1542
99.6426 86.3847/0.7884
89.907% 0.82986 1557.402
99.259% 0.98785 128.85
94.368% 0.90888 357
99.328% 0.98899 172.68
Table 2. C.V. Accuracy, Overall Accuracy, Kappa Coefficient of 20 Generations Grid_SVM
PSO_SVM
GA_SVM
GAPSO_SVM
c/ overall accuracy
99.5831 1/16
99.6278 0.1/1.0740
99.6129 2.1484/8.1542
99.6426 86.3847/0.7884
89.907%
99.259%
94.368%
99.328%
Kappa coefficient Time(s)
0.82986 1557.402
0.98785 241.47
0.90888 463.12
0.98899 223.28
C.V.accuracy
Table 3. C.V. Accuracy, Overall Accuracy, Kappa Coefficient of 50 Generations C.V.accuracy c/ overall accuracy Kappa coefficient Time(s)
Grid_SVM
PSO_SVM
GA_SVM
GAPSO_SVM
99.5831 1/16
99.6278 0.1/1.0740
99.6129 2.1484/8.1542
99.6426 86.3847/0.7884
89.907% 0.82986 1557.402
99.259% 0.98785 599.83.
94.368% 0.90888 782.01
99.328% 0.98899 387.87
Figure 5 to 7 have shown the best fitness and average fitness of each generation of the PSO method, the GA and the GAPSO method with10, 20 and 50 generations respectively. Table 1 to 3 and Figure 4 illustrate that GAPSO_SVM’s performance of classification is the best compared with the other 3 models. Overall accuracy and Kappa coefficient are the highest of the 4 methods. GAPSO_SVM’s performance of classification is a little bit better than PSO_SVM’s. But with the increase in the number of iterations, the time that PSO_SVM takes is longer than that GAPSO_SVM takes. Grid_SVM’s performance of classification is the worst of the 4 methods and it takes the longest time as well. Figure 5 to 7 show that the GAPSO method achieves better results and has much faster convergence than both the GA and the PSO model. The average fitness of GAPSO is more stable and close to the best fitness.
(a) GA method
(b) PSO method
(c) GAPSO method
Figure 5. Fitness Curve of Three Methods with 10 Generations
Remote Sensing Image classification based on Optimized Support Vector… (Liqian cheng)
1044
ISSN: 2302-4046
(a) GA method
(b) PSO method
(c) GAPSO method
Figure 6. Fitness Curve of Three Methods with 20 Generations
(a) GA method
(b) PSO method
(c) GAPSO method
Figure 7. Fitness Curve of Three Methods with 50 Generations
4. Conclusion This paper uses SVM to classify the TM remote sensing image of Ningxia Shahu wetland. In order to improve the classification accuracy, it chooses the hybrid particle swarm algorithm to optimize the SVM. In order to make a contrast in performance, the other three methods, namely, the grid search algorithm, genetic algorithm and the particle swarm algorithm are introduced. The comparison and classification results show that GAPSO_SVM has a better performance than the other three methods in classification accuracy and classifies the remote sensing image more accurately. In the process of classification and comparison test, some problems that need to be improved. In this paper, spectral feature is applied to do the image classification research, more feature vectors such as texture features should be added to improve the classification performance in the future applications.
Acknowledgement This work is supported by National Natural Science Foundation of China (61162013), the Independent research foundation of Beifang University of nationalities (2011SDJ007), the planned science and technology Project of Ningxia Province under Grant 2010 year, the scientific research projects of State Ethnic Affairs Commission (12BFZ009).
References [1] ZANG Shu-ying, ZHANG Ce, ZHANG Li-juan, ZHANG Yu-hong. Wetland Remote Sensing Classification Using Support Vector Machine Optimized With Genetic Algorithm. Scientia Geogrphica Sinica. 2012; 32(4): 434-441. [2] MelGAni F, L Bruzzone. Classification of Hyperspectral Remote Sensing Images with Support Vector Machines. IEEE Transactions on Geoscience and Remote Sensing. 2004; 42(8): 1778-1790.
TELKOMNIKA Vol. 12, No. 2, February 2014: 1037 – 1045
TELKOMNIKA
ISSN: 2302-4046
1045
[3] Dan Liu, Jianming Chen, Guangmin Wu, Haijun Duan. SVM-Based Remote Sensing Image Classification and Monitoring of Lijiang Chenghai. International Conference on Remote Sensing, Environment and Transportation Engineering (RSETE). Nanjing: IEEE. 2012:1-4. [4] Xianfeng Song, Zheng Duan, Xiaoguang Jiang. Comparison of artificial neural networks and support vector machine classifiers for land cover classification in Northern China using a SPOT-5 HRG image. International Journal of Remote Sensing. 2012; 33(10): 3301-3320. [5] Yuan Ren, Guangchen Bai. Determination of Optimal SVM Parameters by Using GA/PSO. Journal Of Computers. 2010; 5(8): 1160-1168. [6] SHAO Xin-guang, YANG Hui-zhong, CHEN GAng. Parameters selection and application of support vector machines based on Particle swarm optimization algorithm. Control Theory & Applications. 2006; 23(5): 740-743. [7] Muhamad H, Soebagio, A Soeprijanto, MH Purnomo. Modeling and Control of Excitation And Governor Based On Particle Swarm Optimization For Micro Hydro Power Plant. TELKOMNIKA Indonesian Journal of Electrical Engineering. 2013; 11(2): 297-304. [8] Qinghai Bai. Analysis of Particle Swarm Optimization Algorithm. Computer and Information Science. 2010; 3(1): 180-184. [9] Lovjerg M, Rasmussen TK, Krink T. Hybrid Particle swarm optimizer with breeding and subpopulation. IEEE International Conference on Evolutionary Computation. San Diego, USA. 2000:1-6. [10] Bing Wang, Xiaoli Wang. Acoustic Performance of Exhaust Muffler Based Genetic Algorithms and Artificial Neural Network. TELKOMNIKA Indonesian Journal of Electrical Engineering. 2013; 11(2): 313-320. [11] Cristianini NJ, Shawe-Taylor. An Introduction to Support Vector Machines and Other Kernel-based Learning Methods.Cambridge: Cambridge University Press. 2000. [12] LUO Jian_cheng, ZHOU Cheng_hu, LEUNG Yee, MA Jiang_hong. Support Vector Machine for Spatial Feature Extraction and Classification of Remotely Sensed Imagery. Journal of Remote Sensing. 2002; 6(1): 50-55. [13] HE Ling-min, SHEN Zhang-quan, KONG Fan-sheng, LIU Zhen-ke. Study on Multi-source Remote Sensing Images Classification with SVM. Journal of Image and Graphics. 2007; 12(4): 648-654. [14] Yuhui Shi, Eberhart R. A modified particle swarm optimizer. IEEE International Conference on Evolutionary Computation. Anchorage. Alaska. 1998; 69-73.
Remote Sensing Image classification based on Optimized Support Vector… (Liqian cheng)