Mar 10, 2005 - Support vector machines (SVM) represent a promising development in machine learning research that is not widely used within the remote ...
International Journal of Remote Sensing Vol. 26, No. 5, 10 March 2005, 1007–1011
Support vector machines for classification in remote sensing M. PAL and P. M. MATHER School of Geography, University of Nottingham, UK (Received 8 April 2002; in final form 7 August 2004 ) Support vector machines (SVM) represent a promising development in machine learning research that is not widely used within the remote sensing community. This paper reports the results of two experiments in which multi-class SVMs are compared with maximum likelihood (ML) and artificial neural network (ANN) methods in terms of classification accuracy. The two land cover classification experiments use multispectral (Landsat-7 ETM+) and hyperspectral (DAIS) data, respectively, for test areas in eastern England and central Spain. Our results show that the SVM achieves a higher level of classification accuracy than either the ML or the ANN classifier, and that the SVM can be used with small training datasets and high-dimensional data.
1.
Introduction
Neural classifiers are now widely used in remote sensing (Benediktsson et al. 1990, Tso and Mather 2001). They can generally be used to classify data at least as accurately as statistical classification approaches but there is a range of factors that limit their use (Kavzoglu 2001). An alternative classification technique, that of support vector machines (SVM) (Vapnik 1995), has recently been applied to the problem of classifying remote sensing data (Huang et al. 2002, Zhu and Blumberg 2002) but no analyses of the performance of SVM (as measured by overall classification accuracy) and more established classification methods such as ANN and ML have been reported in the remote sensing literature. The aim of this Letter is to report the results of such a comparison using both multispectral and hyperspectral image data. SVM are based on statistical learning theory and have the aim of determining the location of decision boundaries that produce the optimal separation of classes (Vapnik 1995). In the case of a two-class pattern recognition problem in which the classes are linearly separable the SVM selects from among the infinite number of linear decision boundaries the one that minimizes the generalization error. Thus, the selected decision boundary will be one that leaves the greatest margin between the two classes, where margin is defined as the sum of the distances to the hyperplane from the closest points of the two classes (Vapnik 1995). This problem of maximizing the margin can be solved using standard quadratic programming (QP) optimization techniques. The data points that are closest to the hyperplane are used to measure the margin; hence these data points are termed ‘support vectors’. Consequently, the number of support vectors is small (Vapnik 1995). If the two classes are not linearly separable, the SVM tries to find the hyperplane that maximizes the margin while, at the same time, minimizing a quantity proportional to the number of misclassification errors. The trade-off between International Journal of Remote Sensing ISSN 0143-1161 print/ISSN 1366-5901 online # 2005 Taylor & Francis Ltd http://www.tandf.co.uk/journals DOI: 10.1080/01431160512331314083
1008
M. Pal and P. M. Mather
margin and misclassification error is controlled by a user-defined constant (Cortes and Vapnik 1995). SVM can also be extended to handle nonlinear decision surfaces. Boser et al. (1992) propose a method of projecting the input data onto a highdimensional feature space using kernel functions (Vapnik 1995) and formulating a linear classification problem in that feature space. Further, more detailed discussion of the computational aspects of SVM can be found in Vapnik (1995). SVM were initially designed for binary (two-class) problems. When dealing with multiple classes, an appropriate multi-class method is needed. Vapnik (1995) suggested comparing one class with the others taken together. This strategy generates n classifiers, where n is the number of classes. The final output is the class that corresponds to the SVM with the largest margin, as defined above. For multiclass problems one has to determine n hyperplanes. Thus, this method requires the solution of n QP optimization problems, each of which separates one class from the remaining classes. This strategy can be described as ‘one against the rest’. A second approach is to combine several classifiers (‘one against one’). Knerr et al. (1990) perform pair-wise comparisons between all n classes. Thus, all possible twoclass classifiers are evaluated from the training set of n classes, each classifier being trained on only two out of n classes, giving a total of n(n–1)/2 classifiers. Applying each classifier to the test data vectors gives one vote to the winning class. The data is assigned the label of the class with most votes. The results of a recent analysis of multi-class strategies are provided by Hsu and Lin (2002).
2.
Data and methodology used
The two study areas used in the work reported here are located near the town of Littleport in eastern England and in the region of La Mancha Alta in central Spain, respectively. For the Littleport area, ETM+ data acquired on 19 June 2000 were used to classify the image data into seven land cover types (wheat, potato, sugar beet, onion, peas, lettuce and beans). For the La Mancha area, hyperspectral data acquired on 29 June 2000 by the DAIS 7915 airborne imaging spectrometer were used to identify eight land cover types (wheat, water body, dry salt lake, hydrophytic vegetation, vineyards, bare soil, pasture lands and built-up area). The ‘one against one’ and the ‘one against the rest’ strategies for generating multiclass SVMs are compared in this study, using two software packages. The first, RHUL_SVM (Saunders et al. 1998), can apply either the ‘one against one’ or the ‘one against the rest’ approaches. The second software package, LIBSVM (Chang and Lin 2001), is based on a ‘one against one’ approach. Results obtained using these SVM are compared with results derived from more traditional maximum likelihood (ML) and artificial neural network (ANN) classifiers. The ANN used in our study was a standard back-propagation neural classifier with one hidden layer having 26 nodes. The recommendations of Kavzoglu (2001) were used to determine the values of the user-defined parameters. Ground reference data for both test areas were selected using a random sampling procedure. The selected pixels were divided into two groups so as to remove any possible bias that could be caused by using the same set of pixels for testing and for training the classifiers. A total of 2700 training and 2037 test pixels were chosen from study area 1 (Littleport) and 800 (100 pixels/class) training and 3800 test pixels were selected for study area 2 (La Mancha). The training of the ANN was controlled by an additional validation data set of 60 pixels per class.
Remote Sensing Letters 3.
1009
Results
The concept of the kernel was introduced to extend the capability of the SVM to deal with nonlinear decision surfaces (section 1). There is little guidance in the literature on the criteria to be used in selecting a kernel and the kernel-specific parameters, so a number of trials were carried out using five different kernels with different kernel-specific parameters, using classification accuracy as the measure of quality. A radial basis kernel function with parameters c52 and C55000 gave the highest overall classification accuracy. Both ‘one against one’ and ‘one against the rest’ strategies to deal with the n-class case were used. Table 1 lists the training times taken using a Sun workstation and the classification accuracies achieved. Results obtained using ML and NN classifiers are given in table 2. The results show that the time required by the ‘one against the rest’ method is much higher, and the classification accuracy is lower, than the ‘one against one’ technique, suggesting that the ‘one against one’ method should be employed for generating multi-class SVM. One reason for this finding could be the unbalanced data size of the two training classes while using the ‘one against the rest’ multi-class method, in which each individual class is tested against all of the other classes. The level of classification accuracy achieved by the ‘one against one’ SVM is higher than that produced by either the ML or the ANN classifier. In the second part of the experiment, DAIS hyperspectral data were used to study the behaviour of the SVM, ML and ANN classifiers with a fixed-size training set (800 pixels) but an increasing number of features (spectral bands). The effect of increasing dimensionality is thought to decrease the reliability of the estimates of statistical parameters required for the computation of probabilities, and so it might be postulated that the accuracy of the results of the ML classifier may decrease as data dimensionality increases. This is the so-called Hughes effect (Hughes 1968). ANN-based classifiers may be less susceptible to these effects as they do not rely on statistical estimates (Foody et al. 1995). Only 65 of the available 72 DAIS spectral bands were used, as seven of the DAIS bands suffered from severe striping problems, and were rejected. A cyclical procedure was used, beginning with five bands. The classification exercise was repeated using an additional five bands at each cycle, so that results were available for 5, 10, 15, …, 65 bands, thus generating 13 sets of results. Table 1. Classification accuracy and training time using SVMs and different multi-class methods with Littleport ETM+ data. Number of training pixels
Multi-class method One against the rest (RHUL_SVM) One against one (RHUL_SVM) One against one (LIBSVM)
2700 2700 2700
Accuracy (%) and Training time Kappa value (CPU minutes) 79.73 (0.77) 87.37 (0.86) 87.9 (0.87)
505.27 21.54 0.30
Table 2. Classification accuracies with ML and NN classifiers with Littleport ETM+ data. Classifier ML NN
Accuracy (%) and Kappa value
Training time (CPU minutes)
82.9 (0.80) 85.1 (0.83)
0.20 58
1010
M. Pal and P. M. Mather
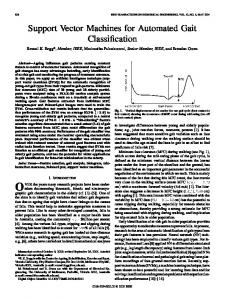
Figure 1. Variation in classification accuracy with increasing number of features and fixed training dataset.
Figure 1 suggests that the performance of the SVM is acceptable even with a small training dataset, in comparison with the two other classifiers tested. Results also suggest that classification accuracy declines slightly when the number of features exceeds 50 or so for all three classifiers. 4.
Conclusions
The results reported in section 3 suggest that the SVM classifier can achieve higher accuracies than either of the ML or ANN classifiers. One disadvantage of the SVM is that, like the ANN classifier, its effective use depends on the values of a few user-defined parameters. Huang et al. (2002) discuss some of factors affecting the performance of SVM in detail. Our study concludes that the approach used by Huang et al. (2002) is not optimal for multi-class classification for two reasons: (1) they replicated the sample size of a smaller class, thus increasing number of training patterns, and (2) they used a ‘one against the rest’ strategy for generating the SVM. The main problem with the ‘one against the rest’ strategy is that it may produce unclassified data, and hence lower classification accuracies. The higher training time requirements of the ‘one against one’ approach using the RHUL_SVM software may be due the algorithm used to solve quadratic programming optimisation problem. The results of our study support the use of a ‘one against one’ multi-class approach for multi-class image classification problems, and indicate that SVM can achieve high classification accuracy with high dimensional data, even if the size of the training dataset is small. Acknowledgements The RHUL_SVM software was made available by AT&T, Royal Holloway College, University of London. The DAIS data were kindly made available by Prof. J. Gumuzzio of the Autonomous University of Madrid. Computing facilities were provided by the School of Geography, University of Nottingham. Mahesh Pal’s research was supported by a Commonwealth Scholarship. The authors are grateful
Remote Sensing Letters
1011
for the critical comments of two anonymous referees, whose advice has led to an improvement in the presentation of many of the findings contained in this paper. References BENEDIKTSSON, J.A., SWAIN, P.H. and ERASE, O.K., 1990, Neural network approaches versus statistical methods in classification of multisource remote sensing data. IEEE Transactions on Geoscience and Remote Sensing, 28, pp. 540–551. BOSER, B., GUYON, I. and VAPNIK, V.N., 1992, A training algorithm for optimal margin classifiers. Proceedings of the 5th Annual ACM Workshop of computational learning theory, Pittsburgh, PA, 27–29 July, D. Maussler (Ed.) (San Mateo, CA: Morgan Kaufman), pp. 144–153. CHANG, C.C. and LIN, C.J., 2001, LIBSVM: A Library for Support Vector Machines. Department of Computer Science and Information Engineering, National Taiwan University, Taiwan. Available online at: http://www.csie.ntu.edu.tw/,cjlin/libsvm (accessed 23 July 2003). CORTES, C. and VAPNIK, V.N., 1995, Support vector networks. Machine Learning, 20, pp. 273–297. FOODY, G., MCCULLAGH M.B. and YATES, W.B., 1995, The effect of training set size and composition on artificial neural net classification. International Journal of Remote Sensing, 16, pp. 1707–1723. HSU, C.-W. and LIN, C.-J., 2002, A comparison of methods for multi-class Support Vector Machines. IEEE Transaction on Neural Networks, 13, pp. 415–425. HUANG, C., DAVIS, L.S. and TOWNSHEND, J.R.G., 2002, An assessment of support vector machines for land cover classification. International Journal of Remote Sensing, 23, pp. 725–749. HUGHES, G.F., 1968, On the mean accuracy of statistical pattern recognizers. IEEE Transactions on Information Theory, 14, pp. 55–63. KAVZOGLU, T., 2001, An investigation of the design and use of feed-forward artificial neural networks in the classification of remotely sensed images. PhD thesis, School of Geography, The University of Nottingham, Nottingham, UK. KNERR, S., PERSONNAZ, L. and DREYFUS, G., 1990, Single-layer learning revisited: A stepwise procdure for building and training neural network. InNeurocomputing: Algorithms, Architectures and Applications, J. Fogelman (Ed.), NATO ASI (Berlin: SpringerVerlag), pp. 41–50. SAUNDERS, C., STITSON, M.O., WESTON, J., BOTTOU, L., SCHO¨LKOPF, B. and SMOLA, A., 1998, Support Vector Machine — Reference Manual. Technical Report, CSD-TR-98-03, Royal Holloway and AT&T, University of London. TSO, B.K.C. and MATHER, P.M., 2001, Classification Methods for Remotely Sensed Data (London: Taylor and Francis). VAPNIK, V.N., 1995, The Nature of Statistical Learning Theory (New York: Springer-Verlag). ZHU, G. and BLUMBERG, D.G., 2002, Classification using ASTER data and SVM algorithms: The case study of Beer Sheva, Israel. Remote Sensing of Environment, 80, pp. 233–240.