clustering (Tavazoie, 2001), (Hoon, 2004), simulated annealing (Lukashin, 1999) ... we propose a new distance measure introducing Shannon's entropy in fuzzy.
Remote sensing image classification using Fuzzy-PSO hybrid approach Anasua Sarkar*, Rajib Das ABSTRACT Pixel classification among overlapping land cover regions in remote sensing imagery is a very challenging task. Detection of uncertainty and vagueness are always the key features for classifying mixed pixels. This paper proposes an approach for pixel classification using a hybrid approach of Fuzzy C-Means and Particle Swarm Optimization methods. This proposed unsupervised algorithm is able to identify clusters utilizing particle swarm optimization based on fuzzy membership values. This approach addresses the overlapping regions in remote sensing images by uncertainties using fuzzy set membership values. PSO is a population -based stochastic optimization technique, inspired from the social behavior of bird flock We demonstrate our algorithm for segmenting a LANDSAT image of Shanghai. The newly developed algorithm is compared with FCM and K-Means algorithms. The new algorithm generated clustered regions are verified with the available ground truth knowledge. The validity and statistical analysis are performed to demonstrate the superior performance of our new algorithms with K-Means and FCM algorithms.
INTRODUCTION Remote sensing is defined as “the art and science of obtaining information about an object without being in direct physical contact with the object” by Cogalton and Green in 1999 (Cogalton, 1999) . Several methods exist for classifying pixels into known classes (for example, an urban area or a turbid water) in remote sensing images. Mathematically, a remote sensing image can be defined as a set, { | } { } is the set of spectral band of information units for pixels, where values for n bands associated with the pixel of coordinate (i,j). In order to find homogeneous regions in the image we model this image by fuzzy sets, that considers both the spatial image objects and the imprecision attached to them. Let us denote the space on which the remote sensing image is defined by (usually or ). We denote the points of (pixels or voxels) as the spatial variables . Let denotes the spatial } . In several earlier works on remote sensing, distance between two pixels { is taken as the Euclidean distance on (Maulik, 2012), (Bandyopadhyay, 2005). A crisp object in the remote sensing image is a subset of . Henceforth, a fuzzy object is defined as a fuzzy subset of . This fuzzy object is defined bi-univoquely by its ] is known as the membership function, which represents the membership function, . membership degree of the point to the fuzzy set . When the value of is closer to 1, the degree of membership of x in will be higher. Such a representation allows for a direct mapping of mixed pixels in overlapping land cover regions in remote sensing images. Let denotes the set of all fuzzy sets defined on . For any two pixels , we denote by as their distance in fuzzy perspective. The definition of a new method utilizing the particle swarm movements over fuzzy membership matrix is the scope of this chapter. Clustering is one unsupervised classification method based on maximum intra-class similarity and minimum inter-class similarity. Other already proposed clustering, which can be applied for pixel classification in remote sensing imagery are - self-organizing map (SOM) (Spang, 2003), K-Means clustering (Tavazoie, 2001), (Hoon, 2004), simulated annealing (Lukashin, 1999), graph theoretic
2 approach (Xu, 1999), fuzzy c-means clustering (Dembele, 2003) and scattered object clustering (de Souto, 2008). Several other methods like clustering based on symmetry (Maulik, 2009), supervised multiobjective learning approach (Maulik, 2012), also may be applicable efficiently for detection of arbitrary shaped land cover regions in remote sensing imagery problem. The membership functions of both rough sets and fuzzy sets also enable efficient handling of overlapping partitions. Therefore, recently rough set theory is being used for clustering (Bandyopadhyay, 2008), (Cordasco, 2007), (Gonzalez, 1992), (Dembele, 2003), (Qin, 2003). Hirano and Tsumoto (Cordasco, 2007) proposed an indiscernibility based clustering method that can handle relative proximity. Lingras (Xu, 1999), (Dembele, 2003), (Qin, 2003) used rough set theory to develop interval representation of clusters. This model is useful when the clusters do not necessarily have crisp boundaries. Fuzzy set theory is a methodology to illustrate how to handle uncertainty and imprecise information in a difficult condition. The fuzzy models are normally used in land coverage detection of remote sensing image, pattern recognition and image processing (Bandyopadhyay, 2005), (Dave, 1989). Applying the concepts of fuzzy membership function (Wang, 1997),(Pappis, 1993), fuzzy clustering (Huang, 2008), fuzzy-rule based systems (Bardossy, 2002) , fuzzy entropy(De Luca, 1972) and fuzzy integrals(Kumar, 1997) in algorithms, the remote sensing image identification becomes more feasible. In the literature, earlier distances proposed comparing fuzzy membership functions do not include spatial information and therefore were not used in remote sensing(Chen, 1995) (Jain, 1995) . The belongingness and non-belongingness of one pixel to one cluster can be utilized to detect as the approximated using Entropy theory on fuzzy sets. Luca and Termini (De Luca, 1972) defines a fuzzy entropy pseudometric as an objective function for convergence in their algorithm. However, their metric fails to satisfy the separability condition (Bloch, 1999) . In decision problems, the entropy functions have been combined with membership comparison approach earlier (Coppia, 2005),(Yager, 1992), (Bouchon-Meunier, 1993). (Bhandari, 1992) introduces one method on fuzzy divergence, mimicking Kulback’s approach. However, this distance does not satisfy triangular inequality. Following these works, we propose a new distance measure introducing Shannon’s entropy in fuzzy membership comparisons for classifying pixels among overlapping land cover regions. We demonstrate the performance of the new distance metric in pixel classification of a chosen LANDSAT remote sensing image of Shanghai. The quantitative evaluation over three existing validity indices indicates the satisfactory performance of our new ENTROpy based FUZZY algorithm (FPSO) to detect imprecise clusters. We compare our obtained solutions with those of K-Means and FCM algorithms to verify with the ground truth knowledge. The statistical tests also demonstrate the significance of our new FPSO algorithm over K-Means and FCM algorithms.
FUZZY C-MEANS ALGORITHM Clustering is an unsupervised pattern classification method based on maximum intra-class similarity and minimum inter-class similarity. In a well-known partitional clustering approach, named fuzzy clustering, points may belong to more than one clusters. Therefore, for each point in a cluster, one set of membership levels is associated. This set of levels indicates the amount of association between the point and each of the clusters. One of the most widely used fuzzy clustering algorithms is the Fuzzy C Means algorithm. Fuzzy set theory was introduced in 1965 by Zadeh (Zadeh, 1965) as a mean to model the vagueness and ambiguity in complex systems. Fuzzy set theory handles the concept of partial membership to a set, with real valued membership degrees ranging from 0 to 1. Introduced by Ruspini (Ruspini, 1970) and improved by Dune and Bezdek (Dunn, 1974)(Bezdek, 1981) ], the Fuzzy Cmeans (FCM) algorith partitions a finite dataset { } into a collection of K fuzzy clusters, satisfying criterions (Reddi, 1984) . Let m be the exponential weight of membership ]. The objective function Wm of FCM is defined as: degree, ∑ ∑(
) (
)
3 where
is the membership degree of point
to centroid
and
is the distance between
and
.
( ) . Then Let is the membership degree matrix and { } is the set of cluster centroids. Wm indicates the compactness and uniformity degree of clusters. Generally, a smaller Wm reflects a more compact cluster set. The algorithm of FCM is an iteration process mathematically described as follows: (1) Initialize m, M and initial cluster centroid set . Set the iteration terminating threshold to a small positive value and iteration time q to zero. Calculate according to with the following equation:
∑ where ∑ . If to other clusters. (2) Update according to
(
,then
and sets
for membership of this pixel
with the following equation: ∑ ( ) ∑
(3) Calculate (4) Compare
)
according to with . If ‖
(
)
. ‖
, stop iteration. Otherwise, go to (2).
PSO Algorithm PSO is a population-based algorithm that uses a population of individuals to probe the best position in the search space. In PSO, the individual is called a particle, which moves stochastically in the direction of its own best previous position and the whole swarm’s best previous position. Suppose that the size of the swarm is N and the search space is M dimensional, then the position of the ith particle is presented as { }. The velocity of this particle is presented as { } The best { } Consequently, the best previous previous position of this particle is denoted as { }. Let the maximum number position discovered by the whole swarm is denoted as of iteration be T and t be the present iteration. The unit time is denoted by Then the position of a particle and its velocity are changed following the constraints shown below[1,5,6, 2207-main.pdf]: (
)
(
)
(5)
(6) (7) ,where , and rand() generates the random number with uniform distribution U(0,1). and are acceleration coefficients [2207-main.pdf]. is the inertia weight, with and as its the maximum and minimum values respectively. For the initial matrix,
[
Then the boundary constraints for
], the equation to generate particle value is :
and {
, are as follows:
{
}
(9)
{
}
(8)
4
{ ,where { respectively.
} and {
(10) } are respectively maximum and minimum values for v and x,
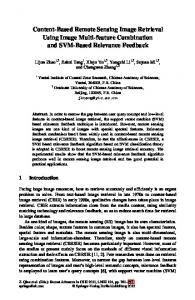
FIGURE 1 The flowchart of FPSO algorithm for remote sensing classification.
MEBERSHIP BASED FUZZY PSO ALGORITHM The new FPSO algorithm consist of two phases – initial FCM clustering of remote sensing image to generate Fuzzy membership matrix and finally the hybrid membership based PSO method to generate optimal pixel allocations for overlapping regions, as shown in Figure 1. Initial random assignment put N pixels in K clusters for initializing FCM algorithm, as described in previous subsection. Then we obtain the initial cluster centroids . The iteration terminating threshold value is et to 1E-05. We initialize the membership degree matrix from the initial random allocations. Then we repeat the centroid updation method iteratively and compute the membership degree matrix for each of the iterations. The iterations converge and stop, when the difference between the
5 membership degree matrix in previous and current iterations becomes less than the iteration-terminating threshold. After the first phase of FCM algorithm, we obtain the membership matrix to generate the initial pixel positions in number of fuzzy classes to denote overlapping regions. The and } { } using Rastrigrin function as shown below – is computed within the constraints { ∑ , (11) [ ], (12) . (13) } { } Using these new constraints, we generate new membership degree Similarly, { matrix and reassign the pixels to the clusters with maximum membership values. The cluster centroids are updated again and the iteration continues, until the convergence occurs with a difference between the best particle in current population old and Global Minimum to be smaller than the terminating threshold . The validity indices are computed lastly over final PSO-optimized solutions.
APPLICATION OF FPSO ALGORITHM IN PIXEL CLASSIFICATION OF REMOTE SENSING IMAGERY Experimental Framework The new FPSO algorithm is implemented using MATLAB 2010 on MacBook dual-core processor. To compare well-known K-Means and FCM methods are also executed. Dunn (Dunn, 1973) , DaviesBouldin (DB) (Davies, 1979) and Silhoutte (Rousseeuw, 1987) validity indices evaluate the effectiveness of FPSO over K-Means and FCM quantitatively. The efficiency of FPSO is also verified visually from the clustered images considering ground truth information of land cover areas.
Validity Indices The fitness of a solution indicates the degree of goodness of the solution of the proposed algorithm (Young, 2001). In this article, three validity indices values, namely Davies-Bouldin (DB), Dunn and Silhoutte indices, are used to determine the performance of the new hybrid algorithm. The validity indices are now described below. 1) ‘Davies – Bouldin index (DB)’ - The Davies–Bouldin index (DB) (Davies, 1979) is a metric for evaluating clustering algorithms. This is an internal evaluation validity index. The best clustering solutions essentially minimizes the Davies Bouldin Index. 2) ‘Dunn index’ - The Dunn index (DI) (Dunn, 1973) is another metric for evaluating clustering algorithms. This is an internal validity index. For one allocation of clusters, a higher Dunn index indicates better clustering. Let Ci be a cluster of vectors. if there are M clusters, then the Dunn Index for the set is defined as: ( ) { { }} 3) ‘Silhouette index s(C)’ - Let a denotes the average distance of a point from other points of same cluster and b denotes the minimum of the average distances of that point from the points in other clusters. Then the Silhouette Width (s) is defined as follows: s = ( b – a ) / max{a,b} (11) Silhouette Index s(C) (Rousseeuw, 1987) is the average Silhouette Width of all points, which reflects the compactness and separation of clusters. The value of s(C) varies from −1 to 1. For appropriate clustering s(C) should be high (Rousseeuw, 1987) .
6 PERFORMANCE ANALYSIS The chosen LANDSAT image of Sanghai (Small, 2006) is available in seven bands viz. green, red and near infrared bands in the multispectral mode with distribution of the pixels in the feature space as shown in Figure 2. We have chosen red, green, blue and near infrared bands for our executions due to limitation of processor capacity. Figure 2 shows the original LANDAST image of Sanghai with histogram equalization with 7 classes: turbid water (TW), pond water (PW), concrete (Concr.), vegetarian (Veg), habitation (Hab), open space (OS), and roads (including bridges)(B/R).
Figure 1 Original image of Shanghai
Figure 2 Scatter plot of original Shanghai image.
The river Huangpu cuts through the image, with one distinct black patch of water body on left bank near bottom-left corner of the image. In its upper right side of the river, a very thin line shows Su zhou river. There are two black patches in the upper-middle right bank of the river shown as a circle in Figure 1. Another canal is shown as another thin line stretching from the right bank of the river in the middle part of the image. In the lower right corner of the image, there exists another thin line indicating a canal.
7
Figure 3 Pixel classification of Shanghai obtained by K-Means algorithm (with K=7).
The segmented Sanghai LANDAST images obtained by K-Means and FCM algorithms respectively are shown in Figures 3 and 4 for (K = 7). In Figure 3, K-Means algorithm fails to classify the two water bodies on the right bank of the river in upper-middle part of the image. FCM clustering solutions in Figure 4 also fails to detect this region as TW or PW class. However, new FPSO algorithm is able to separate these patches with proper indication of water bodies. The thin Su Zhou on the upper right side of the river is also misclassified by K-Means with Concrete and OS classes. FCM algorithm succeeds to detect this canal, but fails to classify the canal on left bank of river in lower middle part of image. However, our new FPSO algorithm is able to separate all three canals and the river into TW class. These indicate that FPSO algorithm detects the overlapping arbitrary shaped regions significantly with better efficiency than K-Means and FCM algorithms. Table 1 Validity indices values of the classified remote sensing image provided by K-means, FCM and FPSO algorithms Shanghai image Index K-Means FCM FPSO DaviesBouldi 0.8376 0.7202 0.5569 n index Silhoue tte 0.3404 0.3331 0.5471 index Dunn 1.2468 1.1624 3.0596 index The clustering results have been evaluated objectively by measuring validity measures Davies-Bouldin (DB), Dunn and Silhoutte index, as defined in (Dunn, 1973) , (Davies, 1979) and (Rousseeuw, 1987) respectively, for K-Means, FCM and FPSO algorithms on the Shanghai remote sensing image in Table 1. It can be noticed that, FPSO produces best final value for minimized DB index as 0.5569, while K-Means obtains a DB value of 0.8376 and FCM obtains 0.7202. The maximizing Silhoutte index values on Shanghai image for K-Means, FCM and FPSO are respectively 0.3404, 0.3331 and 0.5471. Similarly the Dunn index produced by FPSO algorithm (maximizing Dunn) is 3.0562, but K-Means and FCM
8
Figure 4 FCM Cluster 1and 2 plt.
Figure 5 Pixel classification of Shanghai obtained FCM algorithm (with K=7).
9
Figure 6 Pixel classification of Shanghai obtained by FPSO algorithm (with K=7).
algorithms provide a slightly smaller Dunn value of 1.2468 and 1.1624 respectively. These results imply that FPSO optimizes DB, Dunn and Silhoutte indices more than both K-Means and FCM. Hence, it is evident that FPSO is comparable in goodness of solutions to K-Means and FCM algorithms and even FPSO sometimes outperform to obtain superior fuzzy clustering results.
TEST FOR STATISTICAL SIGNIFICANCE A non-parametric statistical significance test called Wilcoxon′s rank sum for independent samples has been conducted at 5% significance level (Hollander, 1999) . Two groups have been created with the performance scores, Silhoutte index values produced by 10 consecutive runs of K-Means, FCM and FPSO algorithms on the chosen remote sensing Image. From the medians of each group on the dataset in Table 2, it is observed that FPSO provides better median values than K-Means and FCM algorithms. Table 2 Median values of performance parameter Silhoutte index over 10 consecutive runs on different algorithms. Algorithms Data K-Means FCM FPSO Shanghai 0.3416 0.3331 0.5471 Image Table 3 shows the P-values and H-values produced by Wilcoxon′s rank sum test for comparison of two groups, FPSO-K-Means and FPSO-FCM. All the P-values reported in the table are less than 0.005 (5% significance level). For the chosen remote sensing Image on Shanghai, comparative P-value of rank sum test between FPSO and K-Means is very small 5.31E-5, indicating the performance metrics produced by FPSO to be statistically significant and not occurred by chance. Similar results are obtained for other group with FCM algorithm also. Hence, all results establish the significant superiority of FPSO over K-
10 Means and FCM algorithms. Table 3 P-values produced by rank sum while comparing FPSO with kmeans and FPSO with fcm respectively Comparison with FPSO Algorithm H P-value K-Means 1 5.31E-5 FCM 1 4.73E-5
CONCLUSION Conventional hard classification methods fail to map land covers properly to the ground information. This problem can be overcome by mapping land cover regions to the fuzzy sets. Fuzzy approach seems natural in order to capture the overlapping regions in the image. Moreover, the PSO method can obtain optimal fuzzy membership values with efficient search stability without using any exhaustive search. Therefore, the contribution of this article lies in efficient detection of overlapping land cover regions in the remote sensing image by implementing a new hybrid Fuzzy membership based particle swarm optimization method, named FPSO clustering algorithm. The primary contributions are – to define one new velocity space in the domain of Fuzzy membership values, which will iterate the positions of the image pixels to allocate it to one fuzzy set of a particular land cover region with highest membership value. The efficiency of the new FPSO algorithm is demonstrated over one chosen LANDSAT remote sensing image on Shanghai. Superiority of new FPSO clustering algorithm over the widely used K-Means and FCM algorithms is established quantitatively over three validity indices. The verification with ground truth information also shows significant efficiency of new FPSO algorithm over other two existing methods. Statistical tests also establish the statistical significance of FPSO over K-Means and FCM algorithms. As a scope of future research, the time-efficiency of FPSO algorithm may be improved further by mapping it to the master-slave paradigm (Sarkar, 2009) , (Sarkar1, 2009). Moreover, incorporation of spatial information in the feature vector as this is found to be effective in pixel classification (Bandyopadhyay, 2005), in lieu of intensity values at different spectral bands in FPSO method, constitutes an important direction for farther research.
REFERENCES (Gonzalez, 1992) Gonzalez RC, Woods RE, “Digital image processing”, Addison-Wesley, Massachusetts, 1992. (Cogalton, 1999) Cogalton, R.G., & Green, K. “Assessing the accuracy of remote sensed data: principles and practices”, Lewis publishers, London, New York, 1999. (Wang, 1997) Wang, W.J. , “New similarity measures on fuzzy sets and on elements”, Fuzzy Sets and Systems, 85:305-309, 1997. (Pappis, 1993) Pappis, C.P. & Karacapilidis, N.I., “A comparative assessment of measures of similarity of fuzzy values”, Fuzzy Sets and Systems, 56: 171-174, 1993. (Huang, 2008) Hung, C. C. , Liu, W.& Kuo, B. C. “A New Adaptive Fuzzy Clustering Algorithm for Remotely Sensed Images,” Geoscience and Remote Sensing Symposium, 2008. IGARSS 2008. IEEE International , 2:II-863-II-866, 2008. (Bardossy, 2002) Bárdossy, A. & Samaniego, L. , “Fuzzy Rule-Based Classification of Remotely Sensed Imagery”, IEEE TRANSACTIONS ON GEOSCIENCE AND REMOTE SENSING, 40(2), 2002.
11 (Kumar, 1997) Kumar, A.S. , Basu, S.K. & Majumdar, K. L. , “Robust classification of multispectral data using multiple neural networks and fuzzy integral,” Geoscience and Remote Sensing, IEEE Transactions on , 35(3):787-790, 1997. (Chen, 1995) Chen, S. M. , Yeh, M. S. & Hsio, P. Y. , “A comparison of similarity measures of fuzzy values, Fuzzy Sets and Systems”, 72: 79-89, 1995. (Jain, 1995) Jain, R. , Murthy, S. N. J. & Chen, P. L. J. , “Similarity measures for image databases”, in Proceedings of IEEE International Conference on Fuzzy Systems, Yokohama, Japan, 1247-1254, 1995. (De Luca, 1972) De Luca, A. , & Termini, S. “A definition of non-probabilistic entropy in the setting of fuzzy set theory”, Inform. Control, 20:301-312, 1972. (Bloch, 1999) Bloch, I. , “On fuzzy distances and their use in image processing under imprecision”, Pattern Recognition, 32:1873-1895, 1999. (Coppia, 2005) Coppia, R. , & D’Urso, P. , “Fuzzy unsupervised classification of multivariate time trajectories with the Shannon entropy regularization”, Computational Statistics & Data Analysis, 50:1452–1477, 2005. (Yager, 1992) Yager, R. Y. , “Entropy measures under similarity relations”, Int. J. General Systems, 20:341-358, 1992. (Bouchon-Meunier, 1993) Bouchon-Meunier, B. , & Yager, R. R. , “Entropy of similarity relations in questionnaires and decision trees”, in: Second IEEE International Conference on Fuzzy Systems, San Francisco, California, 1225-1230, 1993. (Bhandari, 1992) Bhandari, D. , Pal, N. R. & Majumder, D. D. , “Fuzzy divergence, probability measure of fuzzy events and image thresholding”, Pattern Recognition Lett., 13: 857-867, 1992. (Zadeh, 1965) Zadeh, L. A. , “Fuzzy sets”, Information and Control, 8:338-353, 1965. (Ruspini, 1970) Ruspini, E. , “Numerical methods for fuzzy clustering”, Inf. Sci., 2:319–350, 1970. (Dunn, 1974) Dunn, J. C. , “A fuzzy relative of the ISODATA process and its use in detecting compact, well separated clusters”, Cybernetics, 3: 95–104, 1974. (Bezdek, 1981) Bezdek, J. C. , “Pattern Recognition with Fuzzy Objective Function Algorithms”, Plenum Press, New York, 1981. (Reddi, 1984) Reddi, S.S. , Rudin, S.F. , Keshavan, H.R. , “An optimal multiple threshold Scheme for image segmentation”, IEEE–SMC, 14:611–665, 1984. (Dunn, 1973) Dunn, J. C. , “A Fuzzy Relative of the ISODATA Process and Its Use in Detecting Compact Well-Separated Clusters”, Journal of Cybernetics, 3(3):32–57, 1973. (Davies, 1979) Davies, David L. , & Bouldin, Donald W. , “A Cluster Separation Measure”, IEEE Transactions on Pattern Analysis and Machine Intelligence. PAMI, 1(2):224–227, 1979. (Rousseeuw, 1987) Rousseeuw, P. J., “Silhouettes: a Graphical Aid to the Interpretation and Validation of Cluster Analysis”, Computational and Applied Mathematics, 20:53–65, 1987. (Small, 2006) Small, C. “Urban Landsat: Cities from Space”. Palisades, NY: NASA Socioeconomic Data and Applications Center (SEDAC), 2006. http://dx.doi.org/10.7927/H4SQ8XB1. Accessed 19/6/2014. (Hollander, 1999) Hollander, M. & Wolfe, D. , “Nonparametric statistical methods”, 2nd ed. USA, Weily, 1999. (Sarkar, 2009) Sarkar, A., & Maulik, U. , “Parallel Point symmetry Based Clustering for Gene Microarray Data”, In the Proceedings of Seventh International Conference on Advances in Pattern Recognition-2009 (ICAPR, 2009),Kolkata, IEEE Computer Society, Conference Publishing Services (CPS), 351-354, 2009. (Sarkar1, 2009) Sarkar, A. & Maulik, U. , “Parallel Clustering Technique Using Modified Symmetry Based Distance”, In the Proceedings of 1st International Conference on Computer, Communication, Control and Information Technology (C3IT 2009), MacMillan Publishers India Ltd., 611-618 , 2009. (Bandyopadhyay, 2005) Bandyopadhyay S, “Satellite image classification using genetically guided fuzzy clustering with spatial information”, Int J Remote Sens, 26(3):579-593, 2005. (Cordasco, 2007) Cordasco G, Scarano V, Rosenberg AL, “Bounded-collision memory-mapping schemes for data structures with applications to parallel memories”, IEEE Trans Parallel Distrib Syst, 18(7):973982, 2007.
12 (Oleszkiewicz, 2006) Oleszkiewicz J, Xiao L, Liu Y, “Effectively utilizing global cluster memory for large data-intensive parallel programs”, IEEE Trans Parallel Distrib Syst, 17(1):66-77, 2006. (Bentley, 1990) JL Bentley, “K-d trees for semi dynamic point sets “,In Proceedings of the 6 th annual 362 Symposium on Computational Geometry (SCG 90), ACM-SIGACT ACM-SIGGRAPH, 1990. (Smith, 2002) AMS Smith, MJ Wooster, AK Powell & D Usher, “Texture based feature extraction: application to burn scar detection in earth observation satellite sensor imagery”, Int J Remote Sens, 23(8):1733–1739, 2002. (Everman, 2008) WJ Everman , Medline CR, RDD Jr, TT Bauman & L Biehl, “The effect of postmergence herbicides on the spectral reflectance of corn”, Weed Technol 22(3):514–522, 2008. (Jacobs, 2003) MA Jacobs, PB Barker, DA Bluemke, C Maranto, C Arnold, EH Herskovits & Z Bhujwalla, “Benign and malignant breast lesions: diagnosis with multiparametric mr imaging”, Radiology 229:225–232, 2003. (Bandyopadhyay, 2001) S Bandyopadhyay & SK Pal, “Pixel classification using variable string genetic algorithms with chromosome differentiation”, IEEE Trans Geosci Remote Sens 39(2):303-308, 2001. (Maulik, 2003) U Maulik & S Bandyopadhyay, “Fuzzy partitioning using areal-coded variable-length genetic algorithm for pixel classification”, IEEE Trans Geosci Remote Sens 41(5):1075–1081, 2003. (Maulik, 2009) U. Maulik, A. Mukhopadhyay & S. Bandyopadhyay, “Combining Pareto-Optimal Clusters using Supervised Learning for Identifying Co-expressed Genes”, BMC Bioinformatics, 10:27, 2009. (Bandyopadhyay, 2010) S, Bandyopadhyay, R. Mitra, U. Maulik & M. Q. Zhang, "Development of the Human Cancer microRNA Network", Silence, 1:6, 2010. ( Su, 2005 ) M C Su & C H Chou & C C Hsieh. (2005) “Fuzzy C-Means algorithm with a point symmetry distance.” International Journal of Fuzzy Systems. vol. 7. no. 4. pp. 175–181. (Tusher , 1940) Tusher VG, Tibshirani R & Chu G, “Significance analysis of microarrays applied to the ionizing radiation response.” Proc Natl Acad Sci U S A. vol. 98. no. 9. pp. 5116–5121. (Spang, 2003) Spang R, “Diagnostic signatures from microarrays: a bioinformatics concept for personalized medicine,” BIOSILICO, vol. 1, no. 2, pp. 64–68, 2003. (Eisen, 1998) M. Eisen. P. Spellman, P. Brown, & D. Botstein. “Cluster analysis and display of genomewide expression patterns.” Proc. Natl Acad. Sci. USA. vol. 95. pp. 14863–14868. 1998. (Tavazoie, 2001) S. Tavazoie, J. Hughes, M. Campbell, R. Cho, & G. Church, “Systematic determination of genetic network architecture. “Bioinformatics. vol. 17. pp. 405–414. 2001. (Hoon, 2004) M. J. L. de Hoon, S. Imoto, J. Nolan, & S. Miyano. “Open source clustering software.” Bioinformatics. vol. 20. no. 9. pp. 1453–1454. 2004. (Lukashin, 1999) A. Lukashin & R. Futchs. “Analysis of temporal gene expression profiles: clustering by simulated annealing and determining optimal number of clusters.” Nat. Genet.. vol. 22. pp. 281–285. 1999. (Maulik, 2012) Ujjwal Maulik & Anasua Sarkar, “Efficient parallel algorithm for pixel classification in remote sensing imagery”, GeoInformatica, vol. 16, no. 2, pp. 391-407, 2012. (Sarkar, 2013) Anasua Sarkar, Ujjwal Maulik, “Cancer Gene Expression Data Analysis Using Rough Based Symmetrical Clustering”, Handbook of Research on Computational Intelligence for Engineering, Science, and Business, Chapter: 27, Publisher: IGI Global, Editors: Siddhartha Bhattacharyya (RCC Institute of Information Technology, India) & Paramartha Dutta (Visva-Bharati University, pp.699-715, 2013. (Mauik, 2010) Ujjwal Maulik & Anasua Sarkar, “Evolutionary Rough Parallel Multi-Objective Optimization Algorithm”, Fundamenta Informaticae, Vol. 99, No. 1, pp. 13-27, 2010. (Xu, 1999) Y. Xu, V. Olman, & D. Xu. “Clustering gene expression data using a graph theoretic approach: an application of minimum spanning trees.” Bioinformatics. vol. 17. pp. 309–318. 1999. (Dembele, 2003) D. Dembele & P. Kastner. “Fuzzy c-means method for clustering microarray data.” Bioinformatics. vol. 19. pp. 973–980. 2003. (Qin, 2003) J. Qin, D. Lewis, & W. Noble, “Kernel hierarchical gene clustering from microarray gene expression data.” Bioinformatics. vol. 19. pp. 2097–2104. 2003.
13 (Giraud-Carrier, 2004) Giraud-Carrier C, Vilalta R & Brazdil P. “Introduction to the special issue on meta-learning.” Machine Learning. vol. 54. no. 3. pp. 187–193. 2004. (de Souto, 2008) de Souto MCP, R RBCP, Soares RGF, de Araujo DSA, Costa IG, Ludermir TB & Schliep A. “Ranking and Selecting Clustering Algorithms Using a Meta-Learning Approach.” In Proc. of IEEE International Joint Conference on Neural Networks. IEEE Computer Society. pp. 3728–3734. 2008. (Jain,1988) A. K. Jain & R. C. Dubes. Algorithms for clustering data. Englewood Cliffs. NJ: PrenticeHall. 1988. (Bandyopadhyay, 2007) S. Bandyopadhyaya, U. Maulik, & J. T. L. Wang.Analysis of biological data : a soft computing approach. science. engineering. and biology informatics - vol. 3 ed. Toh Tuck Link. Singapore: World Scientific Publishing Co.. 2007. (Duda,1981) R. O. Duda, P. E. Hart, & D. G. Stork, Pattern classification and scene analysis. New York: Wiley. 1981. (Gath, 1989) I. Gath & A. Geva. “Unsupervised optimal fuzzy clustering.” IEEE Transactions on Pattern Analysis and Machine Intelligence. no. 11. pp. 773–781. 1989. (Dave, 1989) R. N. Dave. “Use of the adaptive fuzzy clustering algorithm to detect lines in digital images.” Intell. Robots Comput. Vision VIII. vol. 1192. pp. 600–611. 1989. (Man, 1994) Y. Man & I. Gath. “Detection and separation of ring-shaped clusters using fuzzy clustering.” IEEE Trans. Pattern Anal. Mach. Intell.. vol. 16. no. 8. pp. 855–861. 1994. (Su, 2001) M.-C.Su & C.-H.Chou. “A modified version of the k-means algorithm with a distance based on cluster symmetry.” IEEE Transactions on Pattern Analysis and Machine Intelligence. vol. 23. no. 6. pp. 674–680. 2001. (Pawlak, 1982) Z. Pawlak. “Rough sets.” International Journal of Computer and Information. vol. 11. pp. 341–356. 1982. (Pawlak, 1991)Pawlak Z.. “Rough sets: Theoretical aspects of reasoning about data.” Kluwer Academic Publishers. 1991. (Gawrys, 1994) M. Gawrys & J. Sienkiewicz. “Rsl–the rough set library version 2.0.” ICS Research Report 27/94 Warsaw. Poland: Institute of Computer Science. W. U. of T. 1994. (Pacheco, 1997) P. Pacheco. Parallel programming with MPI. Morgan Kaufmann. 1997. (Young, 2001) K. Y. Young. “Validating clustering for gene expression data.” Bioinformatics. vol. 17. pp. 309–318. 2001. (Bezdek, 1981) J. C. Bezdek. Pattern recognition with fuzzy objective function algorithms. New York: Plenum. 1981. (Xie, 1991) X. L. Xie & G. Beni. “A validity measure for fuzzy clustering.” IEEE Transactions on Pattern Analysis and Machine Intelligence. vol. 13. pp. 841–847. 1991. (Maulik, 2001) U. Maulik & S. Bandyopadhyay. “Nonparametric genetic clustering : comparison of validity indices.” IEEE Transactions on Systems. Man. and Cybernetics-Part C: Applications and Reviews. vol. 31. no. 1. pp. 120–125. February 2001. (Rousseeuw, 1987) P. Rousseeuw. “Silhouettes: a graphical aid to the interpretation and validation of cluster analysis.” J. Comput. Appl. Math.. vol. 20. pp. 53–65. 1987. (Hollander, 1999) M. Hollander & D. Wolfe. Nonparametric statistical methods. 2nd ed. USA: Wiely. 1999. (Maulik, 2002) U. Maulik & S. Bandyopadhyay. “Performance evaluation of some clustering algorithms and validity indices.” IEEE Transactions on Pattern Analysis and Machine Intelligence. vol. 24. no. 12. pp. 1650– 1654. 2002. (Cordasco, 2007) G. Cordasco. V. Scarano. & A. L. Rosenberg. “Bounded-collision memory-mapping schemes for data structures with applications to parallel memories.” IEEE Trans. Parallel Distrib. Syst.. vol. 18. no. 7. pp. 973–982. 2007. (Oleszkiewicz, 2006) J. Oleszkiewicz. L. Xiao. & Y. Liu. “Effectively utilizing global cluster memory for large data-intensive parallel programs.” IEEE Trans. Parallel Distrib. Syst.. vol. 17. no. 1. pp. 66–77. 2006.
14 (Salazar, 2012) R. Salazar, P. Roepman, G. Capella, V. Moreno, I. Simon,C. Dreezen, A. LopezDoriga, C. Santos, C. Marijnen, J. Westerga, S. Bruin, D. Kerr, P. Kuppen, C.van de Velde, H. Morreau, L. V. Velthuysen, A. M. Glas, L. J. V. Veer & R. Tollenaar. “Gene Expression Signature to Improve Prognosis Prediction of Stage II and III Colorectal Cancer”. Journal of Clinical Oncology, vol. 29, no. 1, pp. 17-24. 2011. (Mackay, 2011) A. Mackay, B. Weigelt, A. Grigoriadis, B. Kreike, R. Natrajan, R. A’Hern, D. S.P. Tan, M. Dowsett, A. Ashworth & J. S. Reis-Filho. “Microarray-Based Class Discovery for Molecular Classification of Breast Cancer: Analysis of Interobserver Agreement.” JNCI Journal of The National Cancer Institute, vol.103, no. 8, pp. 662-673. 2011. (Nishida, 2012) N. Nishida, M. Nagahara, T. Sato, K. Mimori, T. Sudo, F. Tanaka, K. Shibata, H. Ishii, K. Sugihara, Y. Doki, & M. Mori. “Human Cancer Biology: Microarray analysis of colorectal cancer stromal tissue reveals upregulation of two oncogenic microRNA clusters.”Clinical Cancer Research, vol.1078. Published OnlineFirst March 27, 2012. (Tyson, 2012) J.J.Tyson, W.T. Baumann, C. Chen, A.Verdugo, I. Tavassoly, Y. Wang, L.M. Weiner & R. Clarke. “Dynamic models of estrogen signaling and cell fate in breast cancer cells.” Nature Review Cancer, vol 11, pp.523-532. 2011. (Gonge, 2011) T. Gong, J. Xuan, L. Chen, R.B. Riggins, H. Li, E.P. Hoffman, R. Clarke & Y. Wang. “Motif-guided sparse decomposition of gene expression data for regulatory module identification.” BMC Bioinformatics, vol. 12, no. 82 (doi:10.1186/1471-2105-12-82; 16 pages as published on-line). 2011. (Yu, 2011) G. Yu, H. Li, S. Ha, I.-M. Shih, R. Clarke, E.P. Hoffman, S. Madhavan, J. Xuan & Y. Wang. “PUGSVM: a caBIGtm analytical tool for multiclass gene selection and predictive classification.” Bioinformatics, vol. 27, pp. 736-738. 2011. (Lathi, 2012) L. Lahti, M. Schäfer, H.-U. Klein, S. Bicciato, & M. Dugas M. “Cancer gene prioritization by integrative analysis of mRNA expression and DNA copy number data: a comparative review”. Briefings in Bioinformatics. Online March 2012. (Ghorai, 2011)S. Ghorai, A. Mukherjee, S. Sengupta, & P. K. Dutta, “Cancer Classification from Gene Expression Data by NPPC Ensemble,” IEEE/ACM Transactions on Computational Biology and Bioinformatics, vol. 8, no. 3. 2011. (Souto, 2008) M. CP de Souto, I. G. Costa1, D. SA de Araujo, T. B. Ludermir & A. Schliep. “Clustering cancer gene expression data: a comparative study.” BMC Bioinformatics, vol. 9, no.497. 2008. (Glaab, 2009) E. Glaab, J. Garibaldi & N. Krasnogor. “ArrayMining : a modular web-application for microarray analysis combining ensemble and consensus methods with cross-study normalization”, BMC Bioinformatics, vol. 10, no. 1, pp. 358. 2009.
ADDITIONAL READING SECTION (Sharan, 2003) R. Sharan. “CLICK and EXPANDER: a system for clustering and visualizing gene expression data.” Bioinformatics. vol. 19. pp. 1787–1799. 2003. (DeRisi, 1997) J. DeRisi, V. Iyer, & P. Brown. “Exploring the metabolic and genetic control of gene expression on a genome scale.” Science. vol. 282. pp. 257–264. 1997. (Chu, 1998) S. Chu. “The transcriptional program of sporulation in budding yeast.” Science. vol. 202. pp. 699–705. 1998. (Cho, 1998) R. J. Cho. “A genome-wide transcriptional analysis of the mitotic cell cycle.” Molecular cell. vol. 2. pp. 65–73. July 1998. (Dhilon, 2003) I. Dhilon, E. Marcotte, & U. Roshan. “Diametrical clustering for identifying anticorrelated gene clusters.” Bioinformatics. vol. 19. pp. 1612–1619. 2003. (Hom, 2003) D. Horn & L. Axel. “Novel clustering algorithm for microarray expression data in a truncated svd space.” Bioinformatics. vol. 19. pp. 1110–1115. 2003. (Bandyopadhyay, 2007) S. Bandyopadhyay, A. Mukhopadhyay, & U. Maulik. “An improved algorithm for clustering gene expression data.” Bioionformatics.Oxford University Press. vol. 23. no. 21. pp. 2859– 2865. August 2007.
15 (Tou, 1974) J. T. Tou & R. C. Gonzalez. Pattern recognition principles. Reading. MA: Addison-Wesley. 1974. (Chen, 2006) Y. L. Chen & H. L. Hu. “An overlapping cluster algorithm to provide non-exhaustive clustering.” Eur. J. Oper. Res.. vol. 173. pp. 762–780. 2006. (Bandyopadhyay, 2007) S. Bandyopadhyay & S. Saha. “GAPS: A clustering method using a new point symmetry-based distance measure.” Pattern Recognition. vol. 10. no. 12. pp. 3430–3451. March 2007. (Bandyopadhyay, 2008) S. Bandyopadhyay & S. Saha. “A point symmetry based clustering technique for automatic evolution of clusters.” IEEE Transactions on Knowledge and Data Engineering. vol. 20. no. 11. pp. 1–17. 2008. (Kim, 2001) S. Y. Kim. “Effect of data normalization on fuzzy clustering of DNA microarray data.” BMC Bioinformatics. vol. 17. pp. 309–318. 2001. (Hvidsten, 2003) T. R. Hvidsten, A. Laegreid, & J. Komorowski. “Learning rule-based models of biological process from gene expression time profiles using gene ontology.” Bioinformatics. vol. 19. no. 9. pp. 1116–1123. 2003. (Kanungo, 2002) T. Kanungo, D. Mount, N. Netanyahu, C. Piatko, R. Silverman, & A. Wu. “An efficient k-means clustering algorithm: analysis and implementation.” IEEE Transactions on Pattern Analysis and Machine Intelligence. vol. 24. no. 7. pp. 881–892. 2002. (Kalyanaraman, 2003) A. Kalyanaraman, S. Aluru, & V. Brendel. “Space and time efficient parallel algorithms and software for EST clustering.” IEEE Transactions on Parallel and Distributed Systems. vol. 14. no. 12. pp. 1209–1221. December 2003. (Rajko, 2004) S. Rajko & S. Aluru. “Space and time optimal parallel sequence alignments.” IEEE Trans. Parallel Distrib. Syst.. vol. 15. no. 12. pp. 1070–1081. 2004. (Jiang, 2008) K. Jiang, O. Thorsen, A. E. Peters, B. E. Smith, & C. P. Sosa. “An efficient parallel implementation of the hidden markov methods for genomic sequence-search on a massively parallel system.” IEEE Trans. Parallel Distrib. Syst.. vol. 19. no. 1. pp. 15–23. 2008. (Liu, 2006) W. Liu & B. Schmidt. “Parallel pattern-based systems for computational biology: A case study.” IEEE Trans. Parallel Distrib. Syst.. vol. 17. no. 8. pp. 750–763. 2006. (Rajasekaran, 2005) S. Rajasekaran. “Efficient parallel hierarchical clustering algorithms.” IEEE Trans. Parallel Distrib. Syst.. vol. 16. no. 6. pp. 497–502. 2005. (Chen, 2004) L. Chen, Y. Pan, & X. hua Xu. “Scalable and efficient parallel algorithms for euclidean distance transform on the LARPBS model.” IEEE Trans. Parallel Distrib. Syst.. vol. 15. no. 11. pp. 975– 982. 2004. (Hollander, 1999) M. Hollander & D. Wolfe. Nonparametric statistical methods. 2nd ed. USA: Wiely. 1999. (Wen, 1998) X. Wen. “Large-scale temporal gene expression mapping of central nervous system development.” Proceedings National Academy Sciences USA. vol. 95. pp. 334–339. 1998. (Iyer, 1999) V. R. Iyer. “The transcriptional program in the response of human fibroblasts serum.” Science. vol. 283. pp. 83–87. 1999. (Gene Ontology, 2000) The Gene Ontology Consortium. “Gene ontology: tool for the unification biology.” Nat. Genet.. vol. 25. pp. 25–29. 2000. (Sharour, 2004) F. A. Shahrour. “FatiGO: a web tool for finding significant associations to gene ontology terms with groups of genes.” Bioinformatics. vol. 20. pp. 578–580. 2004.
KEY TERMS AND DEFINITIONS Clustering: Assigning similar elements to one group, which increases intra-cluster similarity and decreases inter-cluster similarity. Validity index: Index to estimate compactness of the clusters, leading to properly identified distinguishable clusters. K-Means algorithm: Clustering algorithm to classify n elements in k clusters, which iteratively computes the cluster centroids as the means of all elements in one cluster.
16 Fuzzy set: Set of elements with membership values between 0 and 1 for each of the clusters to which it belongs according to fuzzy set theory by Zadeh.