2002 IEEE International Workshop onNeural Networks for Signal Processing. (NNSP2002), Sep.4-6, 2002, Martigny, Switzerland, pp.435-444.
2002 IEEE International Workshop onNeural Networks for Signal Processing (NNSP2002), Sep.4-6, 2002, Martigny, Switzerland, pp.435-444.
REMOVAL OF RESIDUAL CROSSTALK COMPONENTS IN BLIND SOURCE SEPARATION USING LMS FILTERS Ryo Mukai Shoko Araki Hiroshi Sawada Shoji Makino NTT Communication Science Laboratories, NTT Corporation, 2–4 Hikaridai, Seika-cho, Soraku-gun, Kyoto 619–0237, Japan {ryo,shoko,sawada,maki}@cslab.kecl.ntt.co.jp Abstract. The performance of Blind Source Separation (BSS) using Independent Component Analysis (ICA) declines significantly in a reverberant environment. The degradation is mainly caused by the residual crosstalk components derived from the reverberation of the jammer signal. This paper describes a post-processing method designed to refine output signals obtained by BSS. We propose a new method which uses LMS filters in the frequency domain to estimate the residual crosstalk components in separated signals. The estimated components are removed by nonstational spectral subtraction. The proposed method removes the residual components precisely, thus it compensates for the weakness of BSS in a reverberant environment. Experimental results using speech signals show that the proposed method improves the signal-to-interference ratio by 3 to 5 dB.
INTRODUCTION Blind Source Separation (BSS) is a technique for estimating original source signals using only observed mixtures of signals. Independent Component Analysis (ICA) is a typical BSS method that is effective for instantaneous (non-convolutive) mixtures [3, 5, 7]. However, the performance of BSS using ICA declines significantly in a reverberant environment [2, 9]. In our recent research [11], we analyzed the separation and dereverberation performance of a separating system obtained by ICA using impulse responses, and revealed that, although the system can completely remove the direct sound of jammer signals, it cannot remove the reverberation, and this is one of the main causes of the deterioration in performance. We have also shown that when we use a long filter to cover the reverberation, the performance becomes poor with frequency domain BSS [2]. This is because the number of data in each frequency bin becomes small, when we
S1 S2 SN
X1
Y1
X2
Y2
w12
YN
w1N
XM
A
Mixing system
Spectral subtractor
B
Separating system using ICA
(c) Yˆ1
(s) Yˆ1
Refined output signal
Estimated crosstalk component
Residual crosstalk estimator
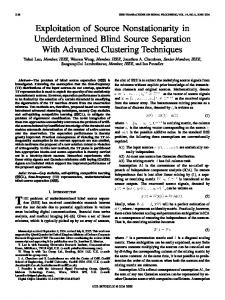
Figure 1: Block diagram of proposed system (for i = 1)
use a longer frame. Previously, we proposed a post-processing method for BSS using time delay and attenuation parameters to estimate and remove residual crosstalk components [12]. The method utilized the nature of BSS in which residual crosstalk components are derived from reverberation. In this paper, we propose a new method for refining output signals obtained by BSS. We introduce LMS filters in the frequency domain to model and estimate the residual crosstalk components. The filters are prepared for every frequency bin and combination of channels. The estimated residual crosstalk components are subtracted by non-stational spectral subtraction. The new method is a generalized version of our previous method. Figure 1 shows a block diagram of the proposed method for one output channel in one frequency bin. In contrast to the original spectral subtraction [4], which assumes stationary noise and periods with no target signal when estimating the noise spectrum, our method requires neither assumption because we use BSS in the first stage. Our method compensates for the weakness of BSS in a reverberant environment. We show the effect of the proposed method with experimental results obtained using speech signals.
BLIND SOURCE SEPARATION OF CONVOLUTIVE MIXTURES USING FREQUENCY DOMAIN ICA In this section, we briefly review the algorithm of BSS using frequency domain ICA. When the source signals are si (t)(1 ≤ i ≤ N ), the signals observed by microphone j are xj (t)(1 ≤ j ≤ M ), and the separated signals are yi (t)(1 ≤ i ≤ N ), the BSS model can be described by the following equations: xj (t) =
N �
(aji ∗ si )(t)
(1)
(bij ∗ xj )(t)
(2)
i=1
yi (t) =
M � j=1
where aji is the impulse response from source i to microphone j, bij is the
coefficient when we assume that a separating system is used as an FIR filter, and ∗ denotes the convolution operator. A convolutive mixture in the time domain corresponds to an instantaneous mixture in the frequency domain. Therefore, we can apply an ordinary ICA algorithm in the frequency domain to solve a BSS problem in a reverberant environment. Using a short-time discrete Fourier transform for (1), we obtain X(ω, n) = A(ω)S(ω, n).
(3)
The separating process can be formulated in each frequency bin ω as: Y (ω, n)
= B(ω)X(ω, n) = B(ω)A(ω)S(ω, n),
(4) (5)
where S(ω, n) = [S1 (ω, n), ..., S N (ω, n)]T is the source signal in frequency bin ω, X(ω, n) = [X1 (ω, n), ..., X M (ω, n)]T denotes the observed signals, Y (ω, n) = [Y1 (ω, n), ..., Y N (ω, n)]T is the estimated source signal, and B(ω) represents the separating matrix. B(ω) is determined so that Yi (ω, n) and Yj (ω, n) become mutually independent. For the calculation of separating matrix B, we use an optimization algorithm based on the minimization of the mutual information of Y . The optimal B is obtained by using the following iterative equation: B i+1 = B i + µ[I − �Φ(Y )Y H �]B i ,
(6)
where i is an index for the iteration, I is an identity matrix, µ is a step size parameter, �·� denotes the averaging operator, and Φ(·) is a non-linear function. Because the signals are complex valued in the frequency domain, we use a polar-coordinated based non-linear function [14]: Φ(Y ) = tanh(g · abs(Y ))e arg(Y ) ,
(7)
where g is a gain parameter to control the nonlinearity. The above calculations are carried out separately for each frequency. After ICA is solved in all frequency, we need to solve the permutation and scaling problem. We use the method in [10] to solve permutation and scaling (phase) problem, and the method in [8] to solve scaling (amplitude) problem.
RESIDUAL CROSSTALK ESTIMATION USING LMS FILTERS IN THE FREQUENCY DOMAIN In this section, we examine the nature of separated signals obtained by the frequency domain ICA described in the previous section. We then propose an algorithm to estimate and subtract residual crosstalk components in these signals.
amplitude
s1 (target)
Mixing system
A
x1
s2(jammer)
time
Separating system by ICA
B
Impulse response Impulse response of straight path of cross path
y1 =
y2 =
x2
(c)
(s)
y1
+
(c)
(s)
y2
y1
+
y2
Straight path for y1 Cross path for y1
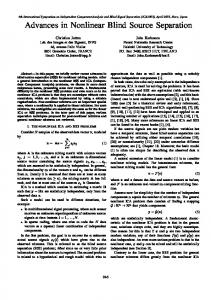
Figure 2: Impulse responses of straight path and cross path
Straight and crosstalk components of BSS When we denote the concatenation of a mixing system and a separating system as G, i.e., G = BA, each of the separated signals Yi obtained by BSS can be described as follows: Yi (ω, n) =
N �
Gij (ω)Sj (ω, n).
(8)
j=1 (s)
We decompose Yi into the sum of straight component Yi derived from (c) target signal Si and crosstalk component Yi derived from jammer signals Sj (j �= i). Then, we have Yi (ω, n) = (s) Yi (ω, n) (c) Yi (ω, n)
= =
(s)
(c)
Yi (ω, n) + Yi (ω, n) Gii (ω)Si (ω, n) � Gij (ω)Sj (ω, n).
(9) (10) (11)
j�=i (s) (c) (s) (c) We denote estimation of Yi and Yi as Yˆi and Yˆi , respectively. Our (c) goal is to estimate the spectrum of Yi using only Yj (1 ≤ j ≤ N ) and obtain (s) (c) Yˆi by subtracting Yˆi from Yi . In our previous research [11], we measured the impulse responses of the straight and cross paths of a BSS system. As a result, we found that the direct sound of a jammer can be almost completely removed by BSS, and also that residual crosstalk components are derived from the reverberation (Fig. 2). We utilize these characteristics of separated signals to estimate the crosstalk components.
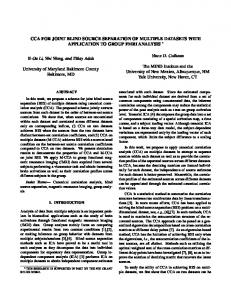
Model of residual crosstalk component estimation Figure 3 shows an example of a narrow band power spectrum of straight and crosstalk components in separated signals obtained by a two-input two(c) output BSS system. The crosstalk component Y1 is in Y1 and the straight
power
0.5 0 1.5 1
(c)
|Y1 (ω, n)|2 (s)
|Y2 (ω, n)|2
0.5 0 0
0.5
1
1.5 2 time (s)
2.5
3
3.5
Figure 3: Example of narrow band power spectrum of straight and crosstalk components (ω = 320 Hz) (s)
component Y2 is in Y2 . Both components are derived from source signal (c) (s) S2 ; Y1 is derived from the reverberation of S2 and Y2 is mainly derived from the direct sound of S2 . Accordingly, for the narrow band signal in (c) each frequency bin, the crosstalk component Y1 can be approximated by the output of the filter whose input is the straight component of the other (s) channel Y2 . We extend this approximation to multiple signals by introducing filters w ij (ω, n) = [wij0(ω, n), ..., w ijL−1(ω, n)]T for each frequency bin ω and combination of channels i and j (i �= j), where L is the length of filters. (s) (s) Furthermore, we use Yj as an approximation of Y j , because Yj is actually unknown. Therefore, the model for estimating residual crosstalk components is formulated as follows: (c) |Yi (ω, n)|β
≈
� � L−1
(s)
wijk (ω, n)|Yj (ω, n − k)|β
(12)
wijk (ω, n)|Yj (ω, n − k)|β
(13)
j�=i k=0
≈
� � L−1 j�=i k=0
where the exponent β = 1 for the magnitude spectrum and β = 2 for the power spectrum. Adaptive algorithm and spectrum estimation Figure 4 shows a block diagram of the proposed method for one output channel. We estimate filters wij described in the previous section by using an adaptive algorithm based on the normalized LMS (NLMS) algorithm [6]. ˆ ij (ω, n) are adapted so that the sum of the output signals beThe filters w (c) (s) (c) comes |Yi (ω, n)|β for input signals |Y j (ω, n)|β . Unfortunately, |Y i (ω, n)| (s)
and |Yj (ω, n)| are unknown, so they are substituted by |Yi (ω, n)| and (s)
|Yj (ω, n)|, respectively. We assume that |Yi (ω, n)| can be approximated (c) by |Yi (ω, n)| when |Yi (ω, n)| is large and |Y i (ω, n)| can be approximated by |Yi (ω, n)| when |Yi (ω, n)| is small. This assumption is based on the charac(s) (s) teristics of narrow band signals where Yi and Yj seldom have large power simultaneously, especially when the source signals are speech signals. A de-
(s)
Y1(ω, n)
Spectral subtractor
(c)
Y1 (ω, n) + Y1 (ω, n)
Y2(ω, n)
(s) Yˆ1 (ω, n)
w ˆ 12(ω, n) �
YN (ω, n)
(c) Yˆ1 (ω, n)
w ˆ 1N (ω, n)
Update algorithm (s)
Figure 4: Adaptive filters and spectral subtractor to estimate Yi
(for i = 1)
tailed analysis of overlapping frequency components of speech signals can be found in [1] and [13]. (c) (s) Since not all |Yi (ω, n)| and |Y i (ω, n)| can be approximated by |Yi (ω, n)|, only a subset of the filters is updated at each iteration. To formulate a selective update algorithm, we introduce sets of channel index (s) numbers, IS (ω, n) = {i : |Yi (ω, n)| ≈ |Yi (ω, n)|} and I C (ω, n) = {i : (c) (s) |Yi (ω, n)| ≈ |Yi (ω, n)|}. This means that |Y i (ω, n)| can be approxi(c) mated by |Yi (ω, n)| for i ∈ I S (ω, n) and |Yi (ω, n)| can be approximated by |Yi (ω, n)| for i ∈ I C (ω, n). One example implementation for determining I S (ω, n) and IC (ω, n) is IS (ω, n) = {i : i = argmaxi |Yi (ω, n)|} and I C (ω, n) = IS (ω, n) . Another example is IS (ω, n) = {i : |Yi (ω, n)| > threshold} and IC (ω, n) = IS (ω, n) . The filters w ˆij are updated for i ∈ IC (ω, n) and j ∈ IS (ω, n). The update procedure is given by µ Y j (ω, n)eij (ω, n) ˆ ij (ω, n) + w δ + ||Y j (ω, n)|| 2 w ˆij (ω, n + 1) = (if i ∈ IC (ω, n), and j ∈ I S (ω, n)) , (14) w ˆ ij (ω, n) (otherwise) where Y j (ω, n) = [|Yj (ω, n)|β , |Yj (ω, n − 1)|β , ..., |Y j (ω, n − L + 1)|β ]T is a � ˆTij (ω, n)Y j (ω, n) is an tap input vector and eij (ω, n) = |Yi (ω, n)|β − j�=i w estimation error. Here, µ is a step size parameter and δ is a positive constant to avoid numerical unstability when Y j is very small. We apply the estimated filters to the model (13), and obtain an estimation of the power of residual crosstalk components: (c)
|Yˆi (ω, n)|β ≈
�
w ˆ Tij (ω, n)Y j (ω, n).
(15)
j�=i (s) Finally, we obtain an estimation of the straight component as Yˆi by the following spectral subtraction procedure:
Table 1: Experimental conditions
Common
ICA part
NLMS & Spectral subtraction part
Sampling rate = 8 kHz Window = hanning Reverberation time tR =150 ms, 300 ms Length of source signal = 6 s Frame length TICA = 32, 512 points (4, 64 ms) Frame shift = frame length / 4 µ = 0.1, g = ∞ Number of iterations = 100 Frame length TSS = 1024 points (128 ms) Frame shift = 64 points (8 ms) Filter length L = 16 µ = 0.1, δ = 0.01, β = 2 5.73 m
3.12 m
1.56 m
1.15 m
2.15 m 4 cm microphones (height : 1.35 m)
loudspeakers (height : 1.35 m)
30 40 1.15 m room height : 2.70 m
Figure 5: Layout of room used in experiments
(c) β β 1/β Yi (ω, n) (|Yi (ω, n)| − |Yˆi (ω, n)| ) |Yi (ω, n)| (s) Yˆi (ω, n) = . (c) (ω, n)| > |Yˆi (ω, n)|) (if |Y i 0 (otherwise)
(16)
EXPERIMENTS To examine the effectiveness of the proposed method, we carried out experiments for N = M = 2 using speech signals convolved with impulse responses measured in a room. Experimental conditions The layout of the room we used to measure the impulse responses of the mixing system A is shown in Fig. 5. We used a two-element microphone array with an inter-element spacing of 4 cm. The directions of the source signals were −30◦ and 40◦. Other conditions are summarized in Table 1. To investigate the influence of the ICA performance on the effectiveness of the proposed method, we used two different reverberation times (tR = 150 ms and
(a)S1 source signal (target)
power
(b)S2 source signal (jammer) (c)Y1 output signal of ICA (s)
(d)Yˆ1
output signal of proposed method
1
2
3 time(s)
4
5
Figure 6: Example of narrow band power spectrum of source and output signals (ω=440 Hz, tR =150 ms, TICA = 32, TSS = 1024)
300 ms) and two different frame lengths of the ICA part (TICA = 32 and 512 points). To update filters w ˆij (ω, n), we used the following simple selective update policy: if |Y1 (ω, n)| > |Y2 (ω, n)| then I S (ω, n) = {1}, I C (ω, n) = {2} else IS (ω, n) = {2}, I C (ω, n) = {1} . We assumed the straight component as a signal, and the difference between the output signal and the straight component as a noise. We defined the output signal-to-interference ratio (SIRO ) in the time domain as follows: �
SIROi ≡ 10 log �
(s) 2 t |yi (t)| (s) (s) yi (t) − yi (t)|2 t |ˆ
(dB).
(17)
We used the average of SIRO1 and SIRO2 as a performance measure in order to cancel out the input SIR. This measurement is consistent with the performance evaluation of BSS in which the crosstalk components are assumed as noise. For each tR and TICA , we measured SIRs with 42 combinations of source signals using two male and two female speakers. Experimental results Before viewing the results of the SIR evaluation, let us investigate one example of a narrow band power spectrum of source and output signals; Figs. 6(a) and (b) show the source signals, Fig. 6(c) the output signal of ICA, and Fig. 6(d) the output signal of the proposed method. By comparing Figs. 6(c) and (d), we can see that the residual crosstalk component indicated by the dashed circles (which is derived from S2 ) is properly removed and also that there is no over-subtraction or under-subtraction.
22
20
SIR of proposed method (dB)
TICA = 512 18
16
TICA = 32
14
12
10
tR = 150ms
8
tR = 300ms
6 6
8
10
12
14
16
18
20
22
SIR of ICA (dB)
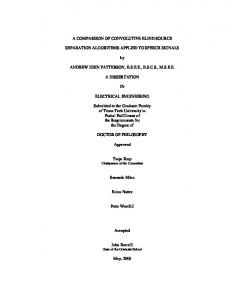
Figure 7: Comparison of SIR for ICA and proposed method Table 2: Average SIR
tR
TICA
150 ms
32 512 32 512
300 ms
ICA (dB) 7.9 13.4 6.4 9.7
Proposed method(dB) 12.9 17.4 10.6 13.0
Improvement (dB) 5.0 4.0 4.2 3.3
The results of the SIR evaluation are shown in Fig. 7. The horizontal axis denotes the SIR of ICA and the vertical axis denotes the SIR of the proposed method. Each point corresponds to one combination of source signals. The proposed method achieved better performance than ICA for all combinations. The improvement of the SIR was stable even when the separation performance of ICA was bad. Table 2 shows the average SIR and improvement for each frame length and reverberation time.
CONCLUSION We proposed a method for estimating and subtracting residual crosstalk components in separated signals obtained by BSS using ICA. The model and algorithm using NLMS filters in the frequency domain estimates residual crosstalk components accurately. This model is based on the nature of BSS in which the crosstalk components in the output signals are derived from reverberation. Experimental results using mixed speech signals proved the effectiveness of the method in compensating for weaknesses of BSS in a reverberant environment.
ACKNOWLEDGEMENTS We thank Dr. Hiroshi Saruwatari for valuable discussions. We also thank Dr. Shigeru Katagiri for his continuous encouragement.
REFERENCES [1] M. Aoki, M. Okamoto, S. Aoki, H. Matsui, T. Sakurai and Y. Kaneda, “Sound source segregation based on estimating incident angle of each frequency component of input signals acquired by multiple microphones,” Acoust. Sci. & Tech., vol. 22, no. 2, pp. 149–157, Feb. 2001. [2] S. Araki, S. Makino, T. Nishikawa and H. Saruwatari, “Fundamental limitation of frequency domain blind source separation for convolutive mixture of speech,” in Proc. of ICASSP’01, 2001, pp. 2737–2740. [3] A. J. Bell and T. J. Sejnowski, “An information-maximization approach to blind separation and blind deconvolution,” Neural Computation, vol. 7, no. 6, pp. 1129–1159, 1995. [4] S. F. Boll, “Suppression of acoustic noise in speech using spectral subtraction,” IEEE Trans. Acoust., Speech, and Signal Processing, vol. ASSP-27, no. 2, pp. 113–120, April 1979. [5] S. Haykin (ed.), Unsupervised Adaptive Filtering, John Wiley & Sons, 2000. [6] S. Haykin, Adaptive Filter Theory, Prentice Hall, 2002. [7] A. Hyv¨ arinen, J. Karhunen and E. Oja, Independent Component Analysis, John Wiley & Sons, 2001. [8] S. Ikeda and N. Murata, “A method of ICA in time-frequency domain,” in Proc. of ICA’99, 1999, pp. 365–370. [9] M. Z. Ikram and D. R. Morgan, “Exploring permutation inconsistency in blind separation of speech signals in a reverberant environment,” in Proc. of ICASSP’00, 2000, pp. 1041–1044. [10] S. Kurita, H. Saruwatari, S. Kajita, K. Takeda and F. Itakura, “Evaluation of blind signal separation method using directivity pattern under reverberant conditions,” in Proc. of ICASSP’00, 2000, pp. 3140–3143. [11] R. Mukai, S. Araki and S. Makino, “Separation and dereverberation performance of frequency domain blind source separation,” in Proc. of Intl. Conf. on Independent Component Analysis and Blind Signal Separation (ICA2001), 2001, pp. 230–235. [12] R. Mukai, S. Araki, H. Sawada and S. Makino, “Removal of residual cross-talk components in blind source separation using time-delayed spectral subtraction,” in Proc. of ICASSP’02, 2002, accepted. ¨ Yilmaz, “On the approximate W-disjoint orthogonality of [13] S. Rickard and O. speech,” in Proc. of ICASSP’02, 2002. [14] H. Sawada, R. Mukai, S. Araki and S. Makino, “A polar-coordinate based activation function for frequency domain blind source separation,” in Proc. of Intl. Conf. on Independent Component Analysis and Blind Signal Separation (ICA2001), 2001, pp. 663–668.