Sheet Absorbing Material Modeling and Application for Enclosures Andriy Radchenko #1, Joseph Bishop #2, Richard Johnson *3, Paul Dixon**4, Marina Koledintseva #5, Roman Jobava##6, David Pommerenke#7, James Drewniak #8 # 1
EMC Laboratory, Missouri University of Science and Technology 4000 Enterprise Dr. Rolla, MO 65401, USA
[email protected], *
2
5
[email protected],
[email protected],
7
[email protected],
8
[email protected]
**
Laird Technologies, San Marcos, CA, Laird Technologies, Randolph, MA 3
[email protected], ##
[email protected]
EMCoS Ltd., Tbilisi, GEORGIA
6
[email protected]
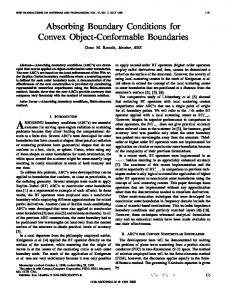
This is especially important, if electromagnetic field distributions are studied in complex-shaped geometries [5][8], including those of enclosures. Therefore an experimentally validated model is required. A test fixture for initial experimental validation of the simulation model is shown in Fig. 1. The fixture is a metallic box with dimensions of 11 cm 6 cm 3 cm. A monopole antenna is mounted inside the fixture and is fed by a VNA source. The reflection coefficient of the monopole antenna is observed.
Abstract— This paper demonstrates relevant physics and provides recommendations regarding thin sheet absorber material applications in enclosures of electronic circuitry. Sheet absorbers placed on the walls of an enclosure are studied herein both experimentally and through the full-wave numerical simulations. In practical applications, the applied absorbing patches need to be selected in terms of proper material type, thickness, size, and placement within an enclosure. The goal is to achieve the maximum effectiveness to suppress electromagnetic field at problem resonances in the enclosure.
I. INTRODUCTION Electronic circuits placed inside an enclosure of any shape may excite cavity resonances, which may produce emissions over regulatory limits through vent holes, seams, and slots. It is important to identify all sources of electromagnetic interference (EMI), understand coupling paths, and develop effective solutions for their mitigation [1]-[3]. Application of absorbing materials on the walls of an enclosure can be an effective way to solve both immunity and emissions problems [3]-[5]. Sheet absorbers placed on enclosure walls are considered in this work. It is important to efficiently predict and evaluate properties and effectiveness of application of absorbing materials for EMI mitigation - in modeled or actual electronic equipment. In this paper, both full-wave numerical simulation and experimental corroboration are used to demonstrate relevant physics associated with the absorber applications on some enclosure geometries. To achieve higher effectiveness of electromagnetic field reduction at problem resonances, the applied absorbing patches need to be selected in terms of proper material type, thickness, size, and placement within an enclosure [6], [7]. This study is aimed at the development of practical guidelines: How to choose proper materials among existing? Where to apply? How much of materials to take? What geometry to make of the chosen material?
(a)
(b)
(c) Fig. 1. The test fixture: closed cavity (a), open cavity (b), and monopole antenna (c).
Fig. 2 shows the frequency behavior of the reflection coefficient of the monopole antenna from two measurements. The black curve corresponds to the test case, when enclosure is kept open. The red curve shows the reflection coefficient, when the lid is placed on top forming the closed metal cavity. The resonances on the black curve are related to the antenna length, while strong resonances on the red curve are cavity resonances. The latter totally disturb antenna characteristics. To suppress the cavity resonances, a 1-mm thick patch of an absorbing magneto-dielectric material is applied to the cavity wall. The material is known, i.e., its complex permittivity and permeability characteristics are obtained
II. MODEL SETUP AND VALIDATION Numerical experiments using full-wave electromagnetic simulation tools can significantly expedite the process of solving the problems posed in the Introduction of this paper.
978-1-4799-0409-9/13/$31.00 ©2013 IEEE
4
645
from preliminary measurements using, e.g., the standard Nicolson-Ross-Weir (NWR) technique with 7/3-mm coaxial air line [9]. However, the type of the material is not specified herein. The patch covers more than 80% of the bottom side of the cavity, as is shown in Fig. 3.
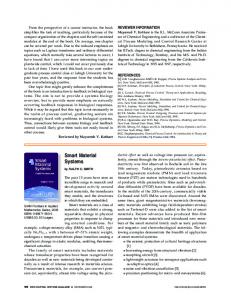
Fig. 5 shows a few views of the simulation model, which includes the interior cavity of the enclosure, the detailed model of the monopole antenna structure, and the lossy material patch. (a)
S11 Magnitude [dB]
0
-5
-10
(b)
-15
-20 0
2
4 6 Frequency [GHz]
Open Cavity Closed Cavity 8 10
Fig. 2. Measurement results – open cavity vs. closed cavity (c)
Absorbing material
Fig. 5. Method of Moments simulation model: constructed CAD model (a), top view of the meshed open cavity model (b), and cut plane view of the closed cavity with the absorbing material patch (c).
Fig. 3. Absorbing material attached to the cavity wall
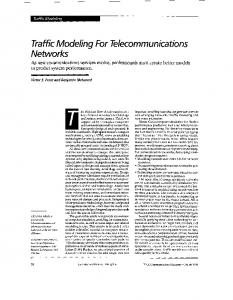
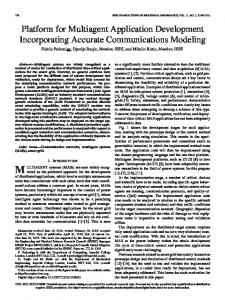
Application of Frequency Domain methods, such as MoM, is advantageous for absorbing materials modeling. Each frequency point is simulated independently from other frequencies, and in MoM (in contrast to Time Domain techniques, which usually require multi-term Debye models for absorbing materials), the frequency-dependent material characteristics can be used just as a look-up table. The drawbacks are – possibly longer calculation time if many frequency samples are required, limitations in layered dielectric modeling and difficulties of modeling extremely thin materials or surface coverings. Adaptive Frequency Sampling technique and special extensions of the general MoM scheme can be applied to enhance application range and usability of MoM solvers [11] - [14]. The measured frequency-dependent material characteristics (real parts and loss tangents of complex permeability and permittivity) of the absorbing material patch applied to the cavity are shown in Figs. 6 and 7. Fig. 8 shows the comparison of simulation results vs. measurements in the frequency range up to 10 GHz. Over the entire frequency range the results agree mostly within 1 dB, which validates the simulation approach, correctness of the numerical model setup, and the accuracy of the measured material characteristics.
Fig. 4 shows the effect of the absorbing material application. The red curve corresponds to the closed cavity loaded by the absorbing material. It can be seen that previously observed sharp cavity resonances are effectively suppressed, and characteristics of the antenna are similar to those for the open cavity case.
S11 Magnitude [dB]
0
-5
-10
-15
-20 0
Open Cavity Closed Cavity loaded by Absorbing Material 2 4 6 8 10 Frequency [GHz]
Fig. 4. Measurement results – open cavity vs. closed cavity loaded by absorbing material
To perform the abovementioned test fixture modeling, the Method of Moment (MoM) solver TriD of commercially available simulation tool EMCoS EMC Studio [10] is used.
646
components and input/output ports link-trace are located on the inner side of the enclosure, and the PCB itself forms a top wall for the enclosure. A few components seen in the bottom photo in Fig. 9 are configuration settings switches and power connection outlets. The observed cavity resonances significantly degrade the amplifier performance.
Permeability r
6 4 2
Magnetic Loss Tangent
0
0
5
10 Frequency [GHz]
15
20
0
5
10 Frequency [GHz]
15
20
2 1.5 1 0.5 0
Fig. 6. Magnetic properties of the absorbing material
Permittivity r
18 17.5 17 16.5
Dielectric Loss Tangent
16
0
5
10 Frequency [GHz]
15
20
0.08
Fig. 9. The photos of the amplifier
0.06 0.04 0.02
0
5
10 Frequency [GHz]
15
20
Fig. 7. Dielectric properties of the absorbing material
S11 Magnitude [dB]
0
-5
-10
-15 0
Measurement MoM Simulation 2 4 6 Frequency [GHz]
Fig. 10. TE/TM mode-resonances seen in the amplifier gain characteristic within an enclosure 8
To suppress the resonances, a variety of absorbing materials are tested by attaching them to the enclosure wall opposite to the mounted PCB. The experiments included samples of the materials of different thickness ranging from 0.15 mm to 8 mm, and of different compositions. These were polymer-based composites loaded with ferromagnetic inclusions of various types, volume fraction, and aspect ratio. All materials, even the thinnest ones, demonstrate good resonance suppression, when an absorber patch covers about 80% of the enclosure wall (24 cm size patch). Effectiveness of a smaller size patch, however, is significantly affected by the particular location and material characteristics. The performance of an absorbing material sample with the available accurately measured material characteristics can be optimized in terms of surface area coverage and placement
10
Fig. 8. Simulation model validation results
III. IMMUNITY PROBLEM RELATED TO CAVITY RESONANCES A. Device Under Test Practical evaluation of effectiveness of a number of absorbing materials for enclosure-resonance suppression was performed using a variable gain amplifier shown in Fig. 9. The frequency range of the amplifier is 100 MHz – 12 GHz. The black curve in Fig. 10 demonstrates the performance of the amplifier, when it is not mounted in the enclosure („Open‟ test condition). The red curve with resonances corresponds to the assembly, when the amplifier PCB is mounted in the enclosure. In this case, active
647
within the enclosure. The optimization can be done based on the full-wave numerical simulations, as is described, e.g., in [3], [6]-[8], and [15].
Fig. 12 shows the simulated transmission coefficient for the amplifier cavity model. Comparing to measured performance shown in Fig. 10 one can see that the experimentally observed cavity resonances are also excited in the simulation. Fig. 13 visualizes the resonant conditions inside the cavity at one of the resonant frequencies, particularly at 11.5 GHz. Fig. 13 (a) shows the distribution of surface currents on the enclosure surface. Fig. 13 (b) shows the simulation model of the enclosure with the field observation areas (grey mesh) and the excitation wire (red line). Cavity resonance pattern can be clearly seen in electric and magnetic field plots depicted in Figs. 13 (c) and (d). These plots represent electric and magnetic field distributions in the perpendicular planes in the enclosure center.
B. Simulation Model The amplifier DUT is an active electronic circuit with a number of ICs and corresponding peripheral components. However, suppression of resonances can be optimized using a simplified model based on cavity dimensions and approximate model of the input/output port link trace. Fig. 11 shows such a simplified model, which consists of a metal enclosure, a wire representing the link trace, and two 50-Ohm ports at the ends of the wire. Trace Model
Port 2
IV. EXPERIMENTAL EVALUATION Absorbing materials were applied to the walls of the enclosure having the dimensions of 11 cm 6 cm 3 cm. Port 1
A. Large Patch First, a large patch covering 80% of the enclosure wall is tested. Fig. 14 shows photo of the amplifier enclosure with an absorbing material patch applied to the wall opposite to the amplifier PCB.
Fig. 11. Simplified simulation model
Fig. 14. Placement of a large patch
1) Thick Material A few relatively thick samples of morphologically different absorbing materials were tested. Fig. 15 shows photos of 3-mm, 5-mm, and 12-mm thick samples. The material „A‟ is a comparatively dense rubber-based magnetodielectric material, while „B‟ and „C‟ are very lightweight non-magnetic foams.
Fig. 12. Simulation results of the amplifier cavity model
A
B
C
Fig. 15. Relatively thick absorbing material samples
Fig. 13. Resonance frequency (11.5 GHz) details: a) Currents distribution on the surface of the enclosure, b) Fields observation planes inside the enclosure, c) Electric field distribution, d) Magnetic field distribution
648
Fig. 16 shows experimental results of the material application. This is the measured insertion loss |S21|, dB as a function of frequency. Compared to the reference red curve in Fig. 10, it can be seen that the cavity resonances are equally effectively suppressed by all the tested samples A, B, and C.
resonances. For further tests, a smaller patch of the material „A‟ of 1-mm thickness and 2 2 cm size was used. Note that the constitutive parameters of the material „A‟ are close to those shown in Figs. 6 and 7. A patch of a smaller size can be placed in different locations within the cavity. Fig. 19 shows a number of typical locations – in front of the trace, in the center, and at the far side of the cavity.
a)
b)
c)
Fig. 16. Relatively thick material samples effect on the insertion loss Fig. 19. A 2-cm square patch placement: over the trace (a), in the center (b), and on the far side (c).
V. THIN MATERIAL The further tests were performed using the magnetodielectric materials having thickness of 0.15 mm and 0.5 mm. Fig. 17 shows photos of the applied material samples.
D-0.15 mm
D-0.50 mm
Fig. 20 shows the effect of the 2-cm square patch absorber material placement.
E-0.50 mm
Fig. 17. Thin absorbing material samples
The measured amplifier characteristics in the closed enclosure loaded by thin material samples are given in Fig. 18, and they are almost identical for all the three samples shown in Fig. 17. Compared to the unloaded case (Fig. 10, red curve), the amplifier response becomes significantly smoother.
Fig. 20. Simplified simulation model
Additionally, the placement of the patch on the side walls of the enclosure was tested. All positions demonstrate similar performance, effectively suppressing the resonance behavior. C. Patch Placement and Dimension Options Next, the 1 cm square 1 mm thick sample of the absorbing material „A‟ was tested. The patch was placed in 17 different positions within the amplifier cavity. Fig. 21 shows patch placement locations.
Fig. 18. Thin material samples effect
B. Smaller Patch Previous results have shown that when a significant area of the cavity wall is covered by an absorbing material, cavity resonances can be effectively suppressed even by very thin magneto-dielectric absorbing samples. The latter interact effectively with surface currents on the enclosure walls and thus significantly reduce Q-factors of the enclosure
Fig. 21. 1-cm square patch placement locations
Fig. 22 shows set of curves resulting from measured transmission coefficient of the amplifier in the closed enclosure with different locations of a small absorbing sample placement. It can be seen that a number of
649
pronounced resonances still affect the amplifier performance, even when absorbing patches are used. However, at the optimal placement of the sample, the resonances can be significantly damped. Fig. 23 shows the best observed results. A few locations of the 1-cm square patch were also modeled using the full-wave simulation. The position „2‟ corresponds to the best performance in both measurement and simulation.
VI. CONCLUSION The guidelines for an effective application of absorbing materials for suppressing the cavity resonances depend on the particular frequency range and geometry of the problem. Both experimental tests and electromagnetic numerical simulations can be applied to optimize a material choice, quantity, patch geometry, and placement within the enclosure.
24
ACKNOWLEDGMENT This material is based upon work supported by the National Science Foundation under Grant No. 0855878.
S21 Magnitude [dB]
23 22 21
REFERENCES
20
[1] C.R. Paul, Introduction to Electromagnetic Compatibility, 2nd ed., Wiley-Interscience, Hoboken, NJ, USA, 2006. [2] S. Celozzi, R. Araneo, and G. Lovat, Electromagnetic Shielding, Wiley, Hoboken, NJ, USA, 2008. [3] M. Koledintseva, K.N. Rozanov, and J. Drewniak, “Engineering, modeling and testing of composite absorbing materials for EMC applications”, in Advances in Composite Materials - Ecodesign and Analysis, ed. B. Attaf, InTech, Mar. 2011, ch. 13, pp. 291-316. [4] P.S. Neelakanta, Handbook of Electromagnetic Materials: Monolithic and Composite Versions and Their Applications, CRC Press, 1995. [5] M. Koledintseva, V.V. Khilkevich, A.G. Razmadze, A.Y. Gafarov, S. De, and J. L. Drewniak, “Evaluation of absorptive properties and permeability of thin sheet magneto-dielectric materials”, J. Magn. Magn. Mater., vol. 324, no. 21, Elsevier, 2012, pp. 3389-3392. [6] M. Koledintseva, J. Drewniak, R. DuBroff, K. Rozanov, and B. Archambeault, “Modeling of shielding composite materials and structures for microwave frequencies”, Progress In Electromagnetics Research B (PIER B), vol. 15, June 2009, pp. 197-215. [7] M. Koledintseva, J. Drewniak, Y. Zhang, J. Lenn, and M. Thoms, “Engineering of ferrite-based composite materials for shielding enclosures”, J. Magn. Magn. Mater., vol. 321, March 2009, pp. 730733. [8] J. Xu, M. Y. Koledintseva, S. De, A. Radchenko, R. E. DuBroff, J. L. Drewniak, Y. He, and R. Johnson, "FDTD modeling of absorbing materials for EMI applications", Asia-Pacific International Symposium on Electromagnetic Compatibility.(AP-EMC'2010), April 12-16, 2010, Beijing, China , paper #526, pp. 173-176. [9] L.F. Chen, C.K. Ong, C.P. Neo, V.V. Varadan, and V.K. Varadan, Microwave Electronics: Measurement and Materials Characterization, Wiley, Hoboken, NJ, USA. 2004. [10] EMCoS Ltd., EMCoS EMC Studio, Version 7.0, www.emcos.com [11] A. Gheonjian, R. Jobava, A. Radchenko, I. Ishmuhametov, and R. Kvaratskhelia, “Adaptive frequency sampling for solution of transient problems in frequency domain”, Direct and Inverse Problems of Electromagnetic and Acoustic Wave Theory, DIPED 2004, Oct. 11-14, 2004 [12] F. Bogdanov, R. Jobava, A. Gheonjian, K. Khasaia, “Application of loop-star and loop-tree basis functions to MoM solution of radiation and scattering problems on complicated surface and wire geometries from low to microwave frequencies”, Antennas and Propagation (EUCAP), 2012 European Conference, Prague, Czech Republic, March 26-30, 2012 [13] F. Bogdanov and R. Jobava, “Investigation of CFIE multipoint testing MoM scheme for triangulated dielectric objects at low frequencies”, Direct and Inverse Problems of Electromagnetic and Acoustic Wave Theory, DIPED 2007, Lviv-Tbilisi, 2007, pp. 109-112. [14] K. Umashankar, A. Taflove, and S.M Rao, “Electromagnetic scattering by arbitrary shaped three-dimensional homogeneous lossy dielectric objects, IEEE Trans. Antennas Propagation, vol. AP-34, no. 6, June 1986, pp. 758-766. [15] M.Y. Koledintseva, J. Xu, S. De, J.L. Drewniak, Y. He, and R. Johnson, “Systematic analysis and engineering of absorbing materials containing magnetic inclusions for EMC applications”, IEEE Trans. Magnetics, vol. 47, no. 2, Feb. 2011, pp. 317-323.
19 18 17 0
2
4 6 8 Frequency [GHz]
10
12
Fig. 22. 1 cm 1 cm square patch application results 24
S21 Magnitude [dB]
23 22 21 20 19 18 17 0
2
4 6 8 Frequency [GHz]
10
12
Fig. 23. The best performance at position „2‟
Fig. 24 (a) shows the simulation model with a small patch of the absorbing material. The surface current distribution at one of the damped resonances, particularly at 11.5 GHz, is presented in Fig. 24 (b). (a)
(b)
Fig. 24. Position „2‟: simulation model (a) and surface currents distribution at 11.5 GHz resonance frequency (b).
Surface current distribution demonstrates at the higherfrequency resonances multiple „hot-spots‟ with the high current density due to the particular cavity mode structure within the enclosure. This makes it difficult to suppress the resonances completely by applying a single small patch. A larger patch covering the key features of the surface current cavity mode pattern is able to effectively eliminate all the unwanted resonances. However, such solution is not costoptimal and could not be recommended as a general practice.
650