Martin algorithm and less than the PSD noise estimator [5]. The same dataset of ... Speech Recognition in Car,â In ISCA Tutorial and Research. Workshop on ...
SPEECH NOISE ESTIMATION USING ENHANCED MINIMA CONTROLLED RECURSIVE AVERAGING Ningping Fan, Justinian Rosca, Radu Balan Siemens Corporate Research Inc. {Ning.Fan, Justinian.Rosca, Radu.Balan}@siemens.com ABSTRACT Accurate noise power spectrum estimation in a noisy speech signal is a key challenge problem in speech enhancement. One state-of-the-art approach is the minima controlled recursive averaging (MCRA). This paper presents an enhanced MCRA algorithm (EMCRA), which demonstrates less speech signal leakage and faster response time to follow abrupt changes in the noise power spectrum. Experiments using real speech and noise recordings have validated the superiority of the proposed enhancements. EMCRA shows improvements both in intuitive subjective listening and objective quality measures in terms of higher output SNR and lower output distortion scores. Index Terms— noise power spectrum estimation, noise control, speech enhancement, noise cancellation filter 1. INTRODUCTION Noise power spectrum estimation is a key component in a practical speech enhancement system. An early approach is to average the noisy signal over non-speech section using a voice activity detector (VAD). However, its reliability severely deteriorates for weak speech components and low input SNR. Furthermore, there may not be sufficient nonspeech sections detectable to track a varying noise spectrum in continuous speech. Alternatively, a minimum statistics [1] based noise estimator does not rely on VAD. The noise estimate is obtained from minima values of smoothed noisy signal power spectrum multiplied by a bias compensation factor, because even for continuous speech there are some time-frequency spectral discontinuities where the minima will converge to the noise spectral value. However using minima makes this approach sensitive to outliers and of high variance. The MCRA [2] method uses spectral minima indirectly. It estimates noise by averaging past spectral power values with a smoothing parameter that is adjusted by the signal presence probability in sub-bands. That in turn is determined by the ratio between the local energy of the noisy speech and its spectral minima within a specified time window. The ratio is compared to a certain threshold, with
1424407281/07/$20.00 ©2007 IEEE
smaller value indicating the absence of speech. Temporal smoothing is also performed to reduce fluctuations between speech and non-speech segments, which exploit the strong correlation of speech presence in neighboring frames. The MCRA method is computationally efficient, robust with respect to the input SNR and type of underlying additive noise. However, there are also some problems. (1) The original MCRA algorithm uses an efficient local minima tracking technique, which reduces the complexity of searching the minima within a time window but it also doubles the delay to follow an abrupt noise spectral rise. (2) The speech leakage refers to the amount of speech spectral components being misclassified into the noise power spectrum, which is one of the causes of distortion in filtered speech. Generally speaking, the shorter the minima searching time window, the larger the speech leakage, because more likely the minima will hit on the weak speech components instead of noise. This paper proposes two novel techniques to remedy these problems, which jointly reduce the delay and the speech leakage. These two steps are the basis for the EMCRA algorithm that has achieved better results than the original MCRA. We first review the original MCRA method in section 2. Then the techniques for reducing time delay and speech leakage are presented in section 3 and section 4 respectively. These are followed by the experimental results and conclusions. 2. MINIMA CONTROLLED RECURSIVE AVERAGING In a spectral filtering based speech enhancement approach, the input noisy speech samples are organized as overlapped frames and each frame is transformed into spectral domain with each frequency as a subband. Let H 0 and H1 indicate the speech presence and absence hypotheses in the i-th frame of the k-th subband, then H 0 : X (k , i ) = S (k , i ) + N (k , i ) H 1 : X (k , i ) = N ( k , i )
IV 581
(1)
ICASSP 2007
where X (k, i) , S(k, i) , and N(k, i) represent the STFT of noisy, clean, and noise signals, respectively. The purpose of noise estimator is to obtain accurate value of noise spectral power magnitude as λn (k, i) = E{ N(k,i) 2} . The MCRA method
uses temporal recursive averaging as below: H 0 : λˆ n ( k , i + 1) = α n λˆ n (k , i) + (1 − α n) N ( k , i )
2
(2)
H 1 : λˆ n ( k , i + 1) = λˆ n (k , i )
where αn (0 < αn < 1) is a smoothing coefficient. Unlike the clear-cut decision such as from a VAD, a conditional speech presence probability p(k,i) = P(H0 | X (k,i)) is used, so that (2) can be written as λˆ n (k , i + 1) = λˆ n (k , i ) p (k , i ) 2
+ (α n λˆ n (k , i ) + (1 − α n ) N (k , i ) )(1 − p(k , i )) = α~ n (k , i )λˆ n (k , i ) + (1 − α~ n (k , i)) N (k , i )
(3)
2
where α~n (k , i ) = α n + (1 − α n) p(k , i )
Because (8) updates the minima using 2 variables in sequel with each of length L time window, the original MCRA algorithm takes 2 L time delay to response to abrupt noise rise, such as when turning on the air conditioner in a car. This can be improved by using the following new minimatracking scheme. if i = 0 ⎧S ( k ,0 ) ⎪min{ S min ( k , i − 1), S ( k , i )} ⎪ S min ( k , i ) = ⎨ l if (i + )% L ≠ 0 ⎪ n ⎪ ⎩min{S l (k , i − 1), S (k , i )} otherwise if i = 0 ⎧ S ( k , 0) ⎪min{ (k , i − 1), S (k , i )} Sl ⎪ S l (k , i) = ⎨ l if (i + )% L ≠ 0 ⎪ n ⎪ S k i otherwise ( , ) ⎩
(4)
is a time-varying smoothing parameter that is adjusted by the signal presence probability estimated as follows
⎧ pˆ (k , i) + (1 − ) if S (k , i ) > δ αp ⎪α p S min ( k , i ) pˆ ( k , i + 1) = ⎨ ⎪α p pˆ (k , i) otherwise ⎩
(5)
where and δ is a threshold for speech presence,
S (k , i) = α s S (k , i) + (1 − α s ) X (k , i)
3. TIME DELAY TO FOLLOW ABRUPT NOISE RISE
2
(6)
and Smin(k, i) = min{S(k, j)}; i − 2L < j < i
(7)
which is calculated as follows: if i = 0 ⎧S ( k ,0) ⎪ S min ( k , i ) = ⎨min{ S min (k , i − 1), S ( k , i )} if i % L ≠ 0 ⎪min{ S tmp (k , i − 1), S ( k , i )} otherwise ⎩ if i = 0 ⎧S (k ,0) ⎪ S tmp ( k , i ) = ⎨min{S tmp ( k , i − 1), S ( k , i )} if i% L ≠ 0 ⎪S ( k , i ) otherwise ⎩
l = 1,2,L, n
and n = 2 m
(9)
m∈ I
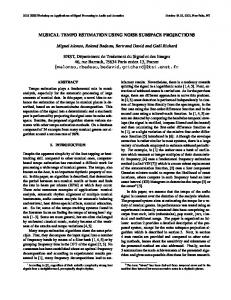
The new scheme contains n pairs of (8) but with overlapped positions, the noise rise delay is reduced from 2 L to (1 + 1n )L . The effects of this technique are shown in Figure 1 ( n = 4 ). The initial noise is low as indicated by a narrow dark strip in the beginning of the noise power spectrum in Figure 1(b), and then it rises abruptly to a high level. The corresponding estimated noise spectra for three different algorithms are shown underneath in Figure 1(c-e). The right side color strip is the color-coding of spectral sample values from bottom to top indicating zero to maximum spectral value in the figure. The time window size L is set to 96 frames for the Rainer-Martine algorithm [1], and 64 frames for the MCRA and the EMCRA algorithms. The original MCRA takes 2L = 128 frames delay and the EMCRA only takes (1 + .25)L = 80 frames delay. The delay enhancement can be easily observed. 4. SPEECH LEAKAGE
(8)
Figure 1 also shows that even with a larger window size, the speech leakage is clearly visible for the Rainer-Martin method, while it is not observable for the MCRA and the EMCRA algorithms. The speech leakage is mostly visible only when the noise estimator is applied on clean speech signal with no noise. Because the noise spectrum should be always zero, any detected noise magnitude is erroneously produced from the speech component.
IV 582
Figure 1– The comparison of (a) noisy waveform, (b) its power spectrum, and (c-e) various estimated noise power spectra. Note the speech leakage in (c), and smaller delay in (e).
This error certainly affects the speech quality when clean speech is filtered using that noise estimator. It also reflects the likelihood of misdetection of weak speech components as noise that will cause distortion in the filtered noisy speech signal. The technique that we propose to alleviate this problem is to introduce a control parameter at each timefrequency as follows. if C (k , i − 1) > S (k , i ) ⎧S ( k , i ) ⎪εC (k , i − 1) if 2C ( k , i − 1) < S ( k , i ) ⎪ C (k , i ) = ⎨ ⎪max{εC (k , i − 1), S min ( k , i − 1)} ⎪⎩ otherwise where
5. TEST RESULTS
(10)
1 S ( k , i ) or S ( k , i ) > ς S min λn ⎨ (11) ⎪ ˆ (k , i + 1) otherwise ⎪⎩λ n where
Figure 2- Speech leakage comparison for different noise power spectrum estimation techniques: (a) clean speech waveform, (b) its power spectrum, and (c-f) various estimated noise power spectra. Note the reduced speech leakage from (f) to (e).
ς >1
The control parameter is compared with the smoothed noisy signal spectrum and acting like a loose time-frequency strong voice component mask. The power spectral values are updated only at spots that do not have strong speech components. Examples of speech leakage for the clean speech signal are shown in Figure 2. The EMCRA algorithm has achieved least speech leakage, even equipped with the time-delay reduction technique that actually results in a slight increase in speech leakage shown in Figure 2(f).
The EMCRA noise estimator has been tested in comparison with the original MCRA and several other popular noise estimators. In all the tests, an adaptive parametric Wiener filter [3] has been used to perform the noise removal. The objective quality measures used are standard from literature [4]. The SNR indicates the global signal to noise ratio, the larger the better. The Itakura-Saito distortion (It-Sa) and Weighted Spectral Slope (WSS) are distortion criterions, the smaller the better. For one particular noisy speech file, results are summarized in the following table in terms of objective speech quality measures of filtered signal, as well as CPU computation time spent. Table 1: Speech Enhancement Comparison of Different Noise Power Spectrum Estimation Techniques
IV 583
noisy speech true noise Rainer Martin MCRA PSD EMCRA
SNR -5.17 4.78 -1.66 -1.55 -2.09 -0.86
It-Sa 0.4910 0.0767 0.4089 0.4382 0.4112 0.4113
WSS 41.8865 23.2398 41.9764 41.1159 44.2091 40.9234
Time (msec)
3976 3315 3425 3385
[4] J.H.L. Hansen, and B.L. Pellom, “An effective quality evaluation protocol for speech enhancement algorithm,” In Inter. Conf. on Spoken Language Processing, vol.7, pp. 2819-2822, Sydney, Australia, December 1998.
[5] S. Aalburg, C. Beaugeant, S. Stan, T. Fingscheidt, R. Balan, and J. Rosca, “Single- and Two-Channel Noise Reduction for Robust Speech Recognition in Car,” In ISCA Tutorial and Research Workshop on Multi-Modal Dialogue in Mobile Environments, Stuttgart, Germany, June 2002. [6] Z. Lin, and R.A. Goubran, “Instant noise estimation using Fourier transform of AMDF and variable start minima search”, In ICASSP2005, Philadelphia, USA, pp. 161-164, 2005. [7] S. Rangachari, and P. Loizou, “A noise estimation algorithm for highly non-stationary environments,” Speech Communication, 28, pp. 220-231, 2006.
EMCRA
PSD
MCRA
RM
-5dB
10dB
-5dB 0dB
noisy
-5dB RM
0.6 0.5 0.4 It-Sa 0.3 0.2 0.1 0
MCRA
Novel techniques to enhance the MCRA noise estimation algorithm have been developed for speech enhancement in adverse environments. Our approach is to reduce the time delay for adapting to abrupt noise change while at the same time decreasing the speech leakage to avoid speech distortions. Experimental tests have demonstrated positive results. The need to reduce time delay to follow abrupt noise changes has also been addressed by others like [6] and [7]. However they did not consider the speech leakage problem, so that such alternative solutions may be enhanced in a rapid varying noisy environment at the cost of some decreased performance and distortions in a relatively stable noise environment.
0dB 10dB 5dB noisy
6. CONCLUSIONS
-5dB
PSD
15 10 5 SNR 0 -5 -10
EMCRA
The “true noise” is the power spectrum of the actual noise used for mixing with the clean speech to form the noisy speech, which serves as the ground truth. It also demonstrates the achievable potential for this noise reduction filter, should noise estimation totally accurate. The results show that the proposed enhanced MCRA noise estimator achieved the best speech quality among all the estimators tested. It consumes more CPU time than the original MCRA algorithm, but much less than the Rainer Martin algorithm and less than the PSD noise estimator [5]. The same dataset of 112 different speech and noise mixtures used in [3] is tested for the average performance. The results are shown in Figures 3 in terms of the average filtered SNR scores, average Itakura-Saito distortions, and average Weighted Spectral Slope values. Our EMCRA algorithm achieved top rank in SNR improvement while maintaining the second rank in other two evaluation criteria. The first ranks in the Itakura-Saito distortion and the Weighted Spectral Slope measures are the PSD and the MCRA respectively. When considering the two distortions simultaneously, the EMCRA algorithm is clearly the winner. Subjective listening to the wave files also confirms the conclusion.
10dB
5dB 10dB
50
7. REFERENCES
40
[1] R. Martin, “Noise power spectral density estimation based on optimal smoothing and minimum statistics,” IEEE Trans. Speech and Audio Processing, vol. 9, no. 5, pp. 504-512, July 2001.
WSS
30
-5dB
20
0dB
[3] N. Fan, “Low distortion speech denoising using an adaptive parametric Wiener filter”, In ICASSP2004, Montreal, Canada, pp. 309-312, 2004.
-5dB 5dB 10dB 10dB noisy
RM
MCRA
[2] I. Cohen and B. Berdugo, “Noise estimation based by minima controlled recursive averaging for robust speech enhancement,” IEEE Signal Processing Letters, vol. 9, no. 1, pp. 12-15, January 2002.
PSD
0
EMCRA
10
Figure 3 - Average filtered SNR (top), Itakura-Saito distortion (middle), and Weighted Spectral Slopes (bottom) scores at different input SNR for various noise estimators: RM [1], MCRA[2], PSD[5], and EMCRA.
IV 584