Statistical Genetic Programming: The Role of Diversity Maryam Amir Haeri, Mohammad Mehdi Ebadzadeh, and Gianluigi Folino 1
2
Department of Computer Engineering and Information Technology, Amirkabir University of Technology, Tehran, Iran
[email protected] Department of Computer Engineering and Information Technology, Amirkabir University of Technology, Tehran, Iran
[email protected] 3 ICAR-CNR, Rende, Italy
[email protected]
Abstract. In this paper, a new GP-based algorithm is proposed. The algorithm, named SGP (Statistical GP), exploits statistical information, i.e. mean, variance and correlationbased operators, in order to improve the GP performance. SGP incorporates new genetic operators, i.e. Correlation Based Mutation, Correlation Based Crossover, and Variance Based Editing, to drive the search process towards fitter and shorter solutions. Furthermore, this work investigates the correlation between diversity and fitness in SGP, both in terms of phenotypic and genotypic diversity. First experiments conducted on four symbolic regression problems illustrate the goodness of the approach and permits to verify the different behavior of SGP in comparison with standard GP from the point of view of the diversity and its correlation with the fitness.
1
Introduction
Maintaining diversity in the genetic programming is important, because it helps to prevent the GP process from a premature convergence. The lack of diversity may lead to convergence towards local optima or towards a not optimal behavior in dynamic environments. Therefore, experimental analysis of diversity can give us a better perspective about the population transition and the search process in GP. According to this, diversity in genetic programming is studied by many researchers working in the GP field. Some of them tried to define appropriate phenotypic or genotypic diversity measures. Rosca [10, 11] suggested a phenotypic measure based on the number of different fitness values in the population. Analogously, Langdon [7] defined genotypic diversity as the number of different structures in the population. Some of the genotypic diversity measures have been defined on the basis of the edit distance between structures in the GP population [2, 3]. Folino et al. [5] analyzed the effectiveness of parallel genetic programming models in maintaining diversity in a population, i.e. island and cellular GP, using phenotypic and genotypic entropy. Their study confirms that the considered parallel models help to promote diversity but the authors conclude no relation between diversity measures and goodness of the fitness can be obtained. Jackson [6] investigated the effects of mutation operator on enhancing the diversity in GP population. He reported that the role of mutation operator in enhancing the diversity depends on the nature of the problem. In three of his test problems mutation did not have a significant effect on any diversity measures, while in one case, mutation operator had a strong influence on improving the structural diversity. Burke et al. [1] analyzed different types of diversity measures and investigated the importance of these measures and their correlation with the fitness in genetic programming. Their results demonstrate that there is a correlation between fitness and diversity. In particular, a positive correlation between the phenotypic diversity and the fitness and a negative correlation between the genotypic diversity and the fitness were observed in many problems. However, they concluded that this correlation must not be interpreted as a factor of causality, i.e. ”...higher diversity does not necessarily cause better performance, but better performance is seen with higher diversity.”
Finally, in regression problems, they discovered the weakest values of correlation and that is one of the reasons why we decided to explore more deeply the behavior in terms of diversity in this kind of problems. In recent years, both analyzing diversity and correlation and improving genetic programming has become the focus of many researchers. Among the desired properties, a GP-based algorithm should reduce the code growth and efficiently explore the huge search space of real hard problems considered. To this aim, a new GP algorithm, named Statistical Genetic Programming (SGP) is introduced in this paper. The novelty of the method is based on the exploitation of statistical information obtained in the structure of the individuals and in the building of new powerful genetic operators. SGP introduces three new operators, Correlation Based Crossover, Correlation Based Mutation and Variance Based Editing. The effect of these three operators is to decrease the rate of the code growth, while maintaining efficacy in exploring the search space. SGP is particularly apt to cope with symbolic regression problems; however we would like to remark that the algorithm can be also used for other kinds of problems, if the function associated to a node can be computed as a function of the input variables. It will be clearer in the next section. To study the behavior of the search process in SGP, and in regression problems in particular, the population diversity and its correlation with the fitness is analyzed, using phenotypic and genotypic measure of diversity. The rest of the paper is organized as follows: In the Section 2, Statistical Genetic Programming is introduced. Section 3 presents the diversity measures used in this paper. Section 4 is devoted to the description of the test problems and to the experimental results. Section 5 concludes the paper.
2
Statistical genetic programming
In this section, a new GP algorithm named Statistical Genetic Programming (SGP) is introduced. The SGP utilizes statistical information to improve the performance of the standard GP. Before introducing the operators of SGP, firstly, it should be clarified what we mean by the statistical information of a GP tree. 2.1
Statistical Information of a GP Tree
Statistical information in a GP tree can be exploited in order to drive the evolutionary process in the case in which each node in the GP tree is a function of the input variables, i.e. in symbolic regression problems. The SGP algorithm computes, for each node of all its subtrees, the following values: E[gi ] = M M M P P P 1 1 1 gi (Xj ), E[gi2 ] = M gi2 (Xj ) and E[gi .y] = M yj gi (Xj ), where gi (Xj ) is the function M j=1
j=1
j=1
of node i. Xj = (xj1 , xj2 , ..., xjn ) is the vector of input variables and n is the number of variables. M is the number of training data and yj = f (Xj ) is the value of the (to be estimated, in the following named regression) function f at the point Xj . In order to compute these values the mean (m) and variance (σ 2 ) of each node and the correlation coefficient (ρ) of each node with f can be computed as follows: m = E[gi ] 2
σ = ρ=
E[gi2 ]
(1) 2
− E[gi ]
E[gi .y] − E[gi ]E[y] σgi σy
(2) (3)
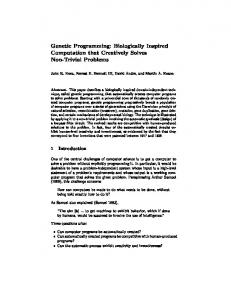
An example of a GP tree and its statistical information is shown in Fig.1.
Fig. 1. An example of a GP tree and its statistical information.
Suppose that we have a symbolic regression problem with regression data (fitness cases) as shown in Fig.1, and let the depicted tree represent an individual of the GP population. Each node of the tree implies some function; for instance, the function of node n6 is g6 = 0.6 ∗ x1 . The “tree function” is the function implied by the root of the tree. Based on the regression data, one can compute statistical information—mean or variance—for each node of the tree (i.e. the function implied by it). For instance, for node n4 (g4 = x2 + x1 ∗ 0.6) and the given regression data, the mean of output of g4 is equal to E[g4 ] = 0.68. All relevant data are tabulated in Fig.1. Another useful statistical information is the correlation coefficient of the outputs of each node function with the desired output values of f (Regression function). This measure can indicate the relation between the function of each node and desired function, and shows how much a subtree is effective in constructing the desired function.
Although SGP computes some additional information during the evolution, these computations do not load considerable overheads and they are not very time consuming. Because most of the statistical information is reusable, and those need updating can be computed simultaneity and in parallel with updating the fitnesses. In practice, SGP uses statistical information of the population to drive the search process. SGP has three operators that use this information: (1) Correlation Based Crossover, Correlation Based Mutation and Variance Based Editing, described in detail in the next subsections. 2.2
Correlation Based Crossover
In the standard crossover, two individuals are selected using a particular selection method and, from each of the parent trees, a subtree is randomly selected and swapped with the subtree of the other parent. In correlation based crossover (CB crossover), for each parent, the subtrees that are more correlated to the regression function f (i.e. the ones having the maximum value of the correlation coefficient between the subtree root and the regression function f , using the absolute value) have more chance to be selected as swapping subtree. As in tournament selection, the subtrees of each parent compete with each other based on their absolute value of the correlation coefficient with f . The winner subtree of each parent is replaced with the winner of the other parent. The tournament size is proportional to the tree size. On the basis of experimental tries, the tournament size was set from 10 to 20 percent of the tree size. Using this kind of crossover, the nodes, which are more correlated to f , have more chance to be selected as crossover points; so it is more likely that the crossover points are located in the most effective parts of the parent trees. Therefore, the probability of neutral crossover, i.e. is a crossover that results in generating offspring that is not different from its parents, is decreased. Furthermore, more effective subtrees are selected as a swapping genetic material and this should lead to the relocation of valuable subtrees in the population and increase the probability of constructive crossover (crossover generating an offspring that is fitter than its parents). 2.3
Correlation Based Mutation
In the standard mutation, after that an individual is selected, one of its subtrees, randomly selected is replaced by a new random subtree. In CB mutation, the subtrees of the selected individual that are less correlated to the regression function f are more likely to be chosen as the point of mutation. In practice, the probability of choosing each node for mutation is inversely proportional to its absolute correlation. The subtree corresponding to the chosen node is replaced by a random subtree. Unlike the standard mutation, CB mutation selects the mutant subtree non-uniformly at random. If a subtree has less correlation (considering the absolute value) with f , it has less influence in constructing the solution tree. Thus, changing this subtree may be productive. 2.4
Variance Based Editing
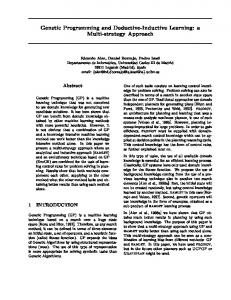
One of the problems of the GP is code bloat, i.e. producing code which is slower and larger, without a significant improvement in terms of fitness. More precisely, code bloat is a considerable increase in the average code size of the population with no significant change of the fitness. In this work, we use a method based on the editing of the tree in order to perform bloat reduction. In practice, variance and mean of each node are used to edit the trees. Every subtree of each GP individual whose variance of its root is zero is replaced with the mean of its root.
+ 0.3
* x1
+
+
0.3
*
g 5 = x 2 − (0.6 − x 2 )
x1
σ 2 (g 5 ) = 0
0.6
E ( g 5 ) = 0.6
x2
0.6
x2
Fig. 2. Variance Based Editing Operator
Most of the subtrees of GP trees are introns or just for constructing a numeric constant. The variance of these subtrees is equal to zero. Thus, this editing operator can restrict the code growth significantly. The VB editing operation is shown in the Fig. 2.
3
Diversity in Genetic Programming
One of the objectives of this paper is to try to understand the correlation between the performance of our algorithm and some diversity measures, i.e. the phenotypic and genotypic diversity. This section presents the diversity measures which are used in this paper. Phenotypic diversity is related to different fitness values in the population. In this paper phenotypic entropy is utilized as a phenotypic diversity measure. The phenotypic entropy of the population P can be calculated as follows [10]: Hp (P ) = −
N X
pj log(pj )
j=1 n
where pj is the portion ( Nj ) of the population P that have fitness j and N is the number of different fitness values in the population P . As in our case, fitness is a continuous quantity, in order to discretize the fitness values, we used an adaptive procedure, in which the ranges are determined on the fly, while the fitness values become known gradually. In practice, for each generation, the first fitness value computed becomes the representative for the first range. Subsequently, we compute the following quantity for each fitness range i: new fitness value − avg. fitness in the range i δi = , avg. fitness in the range i and if it is less than a predefined threshold τ , we put the new fitness value into that range (in case of ties, the i having minimum δi wins). Otherwise, if no such i is found, a new range is created. In the experiments, τ is set to 0.02. In order to measure the genotypic diversity, the genotypic entropy is used in the paper. Genotypic diversity is related to the different structures in the population. A tree distance measure is needed to keep into account the different structures. We use the tree edit distance measure, as defined by Ek´ art and N´emeth [4]. The distance between two trees T1 and T2 can be computed as follows: d(a, b) if neither T1 nor T2 have any chidren m P dist(T1 , T2 ) = dist(sl , tl ) otherwise d(a, b) + K × l=1
where a and b are the roots of T1 and T2 . T1 and T2 have m possible subtrees s and t. The parameter K is set to 1/2 . d(a, b) is 0 if the nodes a and b are equal, 1 if they are different. The edit distance is calculated for each individual against the best individual in the run so far (note that it is different from the best individual in the current population).
As in the case of the phenotypic entropy, genotypic entropy is computed as follows: Hg e(P ) = −
N X
gej log(gej )
j=1
where gej is the portion of the population that has a given distance from the best individual in the run so far.
4
Experimental Results and Discussion
This section is devoted to assessing the performance of SGP and the effects of the new genetic operators. Specifically, we aim to understand the effect of the new operators on the diversity in the population, using the measure of genotypic and phenotypic diversity, introduced in the previous section. 4.1
Test Problems and GP Parameter Settings
Four real valued symbolic regression problems were chosen in order to perform an experimental evaluation. The benchmark functions were selected from [8, 12–14]. The benchmark problems are illustrated in Table 1. Each experiment were performed over 30 runs. The function set is the set F = {+, −, ×, ÷}. Note that the ÷ represents protected division 4 . The terminal set consists of random numbers, and of the function variables. Standard GP parameters are used, as shown in Table 2. The fitness function is the Mean Squared Error (MSE). For the GP system we used TinyGP 5 . TinyGP was developed by Poli and it is a highly optimized genetic programming system [9]. Table 1. Test Problems
Benchmark Number Benchmark Function Function Formula Benchmark1 Benchmark2 Benchmark3 Benchmark4
4.2
f1 (x1 , x2 ) f2 (x1 , x2 ) f3 (x1 , x2 ) f4 (x)
(x1 −3)4 +(x2 −3)3 +(x2 −3) (x2 −2)4 +10
Domain
x1 , x2 ∈ [−6, 6] x1 x2 + sin((x1 − 1)(x2 + 1)) x1 , x2 ∈ [−3, 3] 6 sin(x1 ) cos(x2 ) x1 , x2 ∈ [−3, 3] x4 + x3 + x2 + x x ∈ [−1, 1]
Number of Instances 50 20 20 20
Accuracy Evaluation
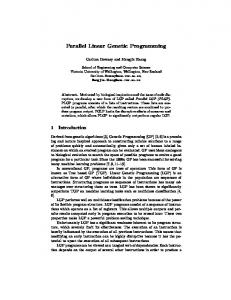
In order to compare the accuracy of standard GP and SGP, we run GP and SGP for 200 generations using a population of 100 individuals on the above described benchmarks. Fig.3 shows the result of the comparison. According to the figure, SGP performs better than the standard GP in terms of accuracy. Probably, lower probability of neutral crossover, higher constructive crossover rate and more effective mutation lead SGP to explore the GP search space more properly. Furthermore, variance based editing removes introns and decreases the 4 5
Protected division returns one when the denominator is zero. http://cswww.essex.ac.uk/staff/rpoli/TinyGP
Table 2. GP Settings Population Size 100 Function Set F = {+, −, ×, ÷} Fitness Function Mean Squared Error (MSE) Initial Population Method Ramped half and half Selection Method Tournament Selection Tournament Size 4 Crossover Rate 90% Mutation Rate 5% Maximum Tree Depth in initial population 6 Maximum Tree Depth 17 Maximum Generation 200 Number of Runs 30 independent runs for each test
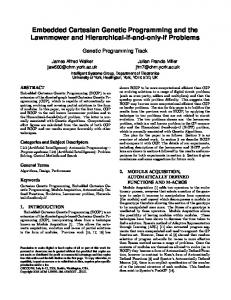
computational cost by making the tree shorter. This can be seen in Fig.4, in which standard and statistical GP are compared in terms of average size of trees in the overall population. Benchmark1
Benchmark2 GP SGP
2
10 Best MSE
Best MSE
3
1
0
0
50
100 Generation Benchmark3
150
5
0
200
0
50
100 Generation Benchmark4
150
200
0
50
100 Gneratiom
150
200
1
3
Best MSE
Best MSE
4
2
0.5
1 0
0
50
100 Generation
150
0
200
Fig. 3. Comparison of SGP and GP accuracy Benchmark1
Benchmark2 3000 Average Tree Size
Average Tree Size
6000 GP SGP
4000
2000
0
0
50
100 Generation
150
2000
1000
0
200
0
50
Benchmark3
200
150
200
800 Average Tree Size
Average Tree Size
150
Benchmark4
5000 4000 3000 2000 1000 0
100 Generation
0
50
100 Generation
150
200
600 400 200 0
0
50
100 Generation
Fig. 4. Average Tree Size for GP and SGP
4.3
Diversity and SGP
In this subsection, we want to investigate the correlation between diversity and fitness in SGP, using both the phenotypic and genotypic diversity as defined in the diversity section, and the Spearman correlation, defined later in this section. Fig.5 shows the phenotypic entropy for SGP in comparison with the standard GP. It can be seen that SGP has a higher phenotypic diversity than the standard GP, probably because the CB crossover operator increases the rate of constructive crossover. For example the average rate of constructive crossover of SGP for benchmark1 is 13.92 percent, however the constructive
crossover rate of GP is equal to 6.73 percent. In addition to that, CB mutation decreases the rate of ineffective mutation and increases the rate of constructive mutation. For example the average rate of constructive mutation of SGP for benchmark1 is 7.17 percent, but the constructive mutation rate of GP is equal to 2.93 percent. So in SGP, the probability of generating offspring, which are better than its parents is higher than in standard GP. Furthermore, VB editing is effective in eliminating the introns and this could help to significantly decrease the rate of neutral genetic operations. Benchmark1
Benchmark2 2 Phenotypic Entropy
Phenotypic Entropy
3 SGP GP
2
1
0
0
50
100 Generation Benchmark3
150
1.5 1 0.5 0
200
Phenotypic Entropy
Phenotypic Entropy
50
100 Generation Benchmark4
150
200
0
50
100 Generation
150
200
3
4 3 2 1 0
0
0
50
100 Generation
150
2
1
0
200
Fig. 5. Phenotypic Entropy in GP and SGP populations Benchmark1
Benchmark2 4 SGP GP
3
Genotypic Entropy
Genotypic Entropy
4
2 1 0
0
50
100 Generation Benchmark3
150
1
0
50
100 Generation
150
200
150
200
Benchmark4 4 Genotypic Entropy
Genotypic Entropy
2
0
200
4 3 2 1 0
3
0
50
100 Generation
150
200
3 2 1 0
0
50
100 Generation
Fig. 6. Genotypic Entropy in GP and SGP populations
In a sub-optimal tree, higher nodes are more correlated to the regression function f . Hence, in CB crossover the higher nodes of the trees have more chance to be selected as a swapping subtrees. In the measure of genotypic diversity the higher nodes of trees have more influence, because the coefficient K is less than 1 (here is 0.5) . Therefore, as can be seen in Fig. 6, in SGP the genotypic diversity is higher than in GP. A second set of experiments aims to answer to the hard question whether populations with higher phenotypic or genotypic diversity can obtain a better solution. In practice, we want to investigate the correlation between the fitness and these measures of diversity. Similar to [1], Spearman correlation is adopted in order to determinate if a relation between N P d2i i=1 N 3 −N
6
fitness and diversity exists. The Spearman correlation can be defined as 1 − , where di is the difference between the rank of the best fitness and the rank of the diversity of population i. The population that have a better fitness (less MSE) have a greater fitness rank. Similarly, the diversity rank is higher for the population having higher diversity.
Fig.7 and 8 respectively illustrate the Spearman correlation between the fitness and the phenotypic entropy and the correlation between the fitness and the genotypic entropy. Each point in the graphs depicts the correlation between 30 populations, collected from 30 independent runs in the different phases of the evolutive process.
GP SGP
200
Spearman Correlation (Fitness, Phenotypic Entropy)
Benchmark1 1
200
Spearman Correlation (Fitness, Phenotypic Entropy)
Spearman Correlation (Fitness, Phenotypic Entropy)
Spearman Correlation (Fitness, Phenotypic Entropy)
As can be seen in Fig 7, for all benchmarks, at the beginning, as the population is randomly created there is no positive (or negative) correlation between fitness and diversity. Afterwards, a positive correlation can be found both for SGP and GP, then the correlation decreases and no significant correlation can be found. This is probably due, in accordance with the results found in the paper of Burke, to the presence of many local optima.
0.5 0 −0.5 −1 0
50
100 Generation Benchmark3
150
1 0.5 0 −0.5 −1 0
50
100 Generation
150
Benchmark2 1 0.5 0 −0.5 −1 0
50
100 Generation Benchmark4
150
200
50
100 Generation
150
200
1 0.5 0 −0.5 −1 0
GP SGP
0.5 0 −0.5 −1 0
50
100 Generation Benchmark3
150
200
1 0.5 0 −0.5 −1 0
50
100 Generation
150
200
Spearman Correlation (Fitness, Genotypic Entropy)
Benchmark1 1
Spearman Correlation (Fitness, Genotypic Entropy)
Spearman Correlation (Fitness, Genotypic Entropy)
Spearman Correlation (Fitness, Genotypic Entropy)
Fig. 7. Correlation Between Fitness and Phenotypic Diversity Benchmark2 1 0.5 0 −0.5 −1 0
50
100 Generation Benchmark4
150
200
50
100 Generation
150
200
1 0.5 0 −0.5 −1 0
Fig. 8. Correlation Between Fitness and Genotypic Diversity
In the case of genotypic diversity (see Fig.8) in SGP, in very early generations the correlation between the fitness and genotypic entropy is positive. After these early generations, the correlation becomes lower and close to zero and afterward becomes negative. In the experimental results of Burke et. al, a similar behavior have been evidenced. Our investigation results are similar to those of [1]. There is a positive correlation between the phenotypic entropy and fitness and a negative correlation between genotypic diversity and fitness. It should be considered that, the correlation coefficient represents the association between fitness and diversity, not the causality. This means that, for example, higher phenotypic diversity is not necessarily the cause of better fitness. However, better performance is observed with higher phenotypic diversity. Burke et al. [1] expressed that crossover and selection methods have very important roles in constructing the structures of GP population. Any simple implementation
difference may change the diversity of the population. Therefore, care must be taken when inferring causality from diversity.
5
Conclusions
This paper proposed a new GP paradigm, Statistical Genetic Programming, exploiting the statistical information of the population in order to improve the accuracy of GP, mainly for symbolic regression problems. Experiments conducted on four symbolic regression problems confirm the improvement obtained using the new paradigm. A diversity analysis, based on genotypic and phenotypic diversity measures and on the study of correlation coefficients obtains results comparable with other classical model of GP, with the exception of the capacity of SGP to maintain a higher genotypic diversity. Future works will be conducted in order to try to understand better the relation between the performance of SGP and diversity and to study the different contributions of the three operators introduced.
Bibliography [1] E. Burke, S. Gustafson, and G. Kendall. Diversity in genetic programming: An analysis of measures and correlation with fitness. Evolutionary Computation, IEEE Transactions on, 8(1):47–62, 2004. [2] E. de Jong, R. Watson, and J. Pollack. Reducing bloat and promoting diversity using multiobjective methods. 2001. [3] A. Ek´ art and S. N´emeth. A metric for genetic programs and fitness sharing. Genetic Programming, pages 259–270, 2000. [4] A. Ek´ art and S. N´emeth. Maintaining the diversity of genetic programs. Genetic Programming, pages 122–135, 2002. [5] G. Folino, C. Pizzuti, G. Spezzano, L. Vanneschi, and M. Tomassini. Diversity analysis in cellular and multipopulation genetic programming. In Evolutionary Computation, 2003. CEC’03. The 2003 Congress on, volume 1, pages 305–311. IEEE, 2003. [6] D. Jackson. Mutation as a diversity enhancing mechanism in genetic programming. In Proceedings of the 13th annual conference on Genetic and evolutionary computation, GECCO ’11, pages 1371– 1378, New York, NY, USA, 2011. ACM. [7] W. Langdon. Genetic programming and data structures: genetic programming+ data structures. Springer, 1998. [8] C. L. Pennachin, M. Looks, and J. a. A. de Vasconcelos. Robust symbolic regression with affine arithmetic. In Proceedings of the 12th annual conference on Genetic and evolutionary computation, GECCO ’10, pages 917–924, New York, NY, USA, 2010. ACM. [9] R. Poli, W. Langdon, and N. McPhee. A field guide to genetic programming. Lulu Enterprises Uk Ltd, 2008. [10] J. Rosca. Entropy-driven adaptive representation. In Proceedings of the workshop on genetic programming: From theory to real-world applications, volume 9, pages 23–32. Tahoe City, California, USA, 1995. [11] J. Rosca. Genetic programming exploratory power and the discovery of functions. In Evolutionary Programming IV Proceedings of the Fourth Annual Conference on Evolutionary Programming, pages 719–736. Citeseer, 1995. [12] A. Topchy and W. F. Punch. Faster genetic programming based on local gradient search of. In Proceedings of the Genetic and Evolutionary Computation Conference (GECCO-2001, pages 155– 162. Morgan Kaufmann, 2001. [13] N. Uy, N. Hien, N. Hoai, and M. ONeill. Improving the generalisation ability of genetic programming with semantic similarity based crossover. In A. Esparcia-Alczar, A. Ekrt, S. Silva, S. Dignum, and A. Uyar, editors, Genetic Programming, volume 6021 of Lecture Notes in Computer Science, pages 184–195. Springer Berlin / Heidelberg, 2010. [14] E. J. Vladislavleva, G. F. Smits, and D. Den Hertog. Order of nonlinearity as a complexity measure for models generated by symbolic regression via pareto genetic programming. Trans. Evol. Comp, 13:333–349, April 2009.