Stereo for Image-Based Rendering using Image Over-Segmentation C. Lawrence Zitnick (
[email protected]) and Sing Bing Kang (
[email protected]) Microsoft Research One Microsoft Way Redmond, WA 98052 Special issue of IJCV Abstract. In this paper, we propose a stereo method specifically designed for image-based rendering. For effective image-based rendering, the interpolated views need only be visually plausible. The implication is that the extracted depths do not need to correct, as long as the recovered views appear to be correct. Our stereo algorithm relies on over-segmenting the source images. Computing match values over entire segments rather than single pixels provides robustness to noise and intensity bias. Color-based segmentation also helps to more precisely delineate object boundaries, which is important for reducing boundary artifacts in synthesized views. The depths of the segments for each image are computed using loopy belief propagation within a Markov Random Field framework. Neighboring MRFs are used for occlusion reasoning and ensuring that neighboring depth maps are consistent. We tested our stereo algorithm on several stereo pairs from the Middlebury data set, and show rendering results based on two of these data sets. We also show results for video-based rendering. Keywords: stereo correspondence, multi-view stereo, segmentation, image-based rendering.
1. Introduction
Stereo is a fundamental problem in computer vision that requires establishing correspondences between multiple images. It is used in a host of applications such as creation of 3D models, robot navigation, parts inspection, and image-based rendering. We are interested in developing a robust stereo technique for imagebased rendering (IBR), i.e., we wish to enable photorealistic view interpolation of scenes. There are many issues that make stereo an unresolved problem. One set of issues is related to the property of the scene itself, namely textureless areas (making stereo ill-posed), non-Lambertian surfaces, reflections and translucency, and occlusions. The other issues are camera-related, such as image noise and errors due to imperfect calibration. The use of multiple cameras introduces another set of problems: differences in c 2006 Kluwer Academic Publishers. Printed in the Netherlands. °
SegmentStereo.tex; 7/11/2006; 13:07; p.1
2 exposure, white balancing, and other radiometric properties. Stereo algorithms should also be reliable and efficient for them to be practical. Stereo algorithms consist of three fundamental elements, namely the representation, the objective function, and the optimization technique. The representation refers to how the images are used to decide depth or disparity: independent pixels, voxels, rectangular local windows, 1D features (lines, contours), or segments (fine to coarse). The objective function specifies the weighting of the data fit term relative to the regularization term, and indicates how occlusion is handled (if at all). Finally, optimizing the objective function can take various forms, such as winner-take-all, dynamic programming (Ohta and Kanade, 1985), relaxation labeling (Li et al., 1997), quadratic programming (Torr, 2002), graph cuts (Boykov et al., 2001), and belief propagation (Sun et al., 2003). Since our goal is the photorealistic rendering of novel views, the extracted depth need not be correct, but plausible. This is consistent with the notion of using prediction error as the quality metric (Szeliski, 1999). In other words, our goal is achieved as long as the interpolated views using the extracted depth distributions look physically correct. This is in contrast with the default measure of success being the minimization of deviation from actual depth or disparity. We assume Lambertian scenes, but we handle issues related to noise and slightly differing radiometric properties in the multiple source cameras. We aim for reliability and efficiency—we believe we have achieved a good trade-off by over-segmenting the image and approximating the scene depth with piecewise step functions. Our design decisions were made using valuable insights gathered from past approaches described in Sections 2. A brief outline of the paper is as follows: In section 2, we describe prior work in stereo and image-based rendering. Section 3 discusses the use of over-segmentation in stereo. An overview of the algorithm as well as our segmentation technique is described in Section 4. The stereo algorithm is covered in Section 2.1. Finally, results are shown in Section 6, followed by a discussion and conclusion.
2. Prior Work
In this section, we first review stereo techniques and highlight representative examples. We then discuss issues associated with IBR systems, in particular camera setups and scene representations.
SegmentStereo.tex; 7/11/2006; 13:07; p.2
3 2.1. S TEREO T ECHNIQUES
As mentioned earlier, stereo techniques can be categorized based on the representation used in the estimating scene depth: individual pixels, voxels, lines or contours, windows, and segments. For a comprehensive survey on two-frame stereo techniques, see (Scharstein and Szeliski, 2002).
2.1.1. Pixel-based Techniques Pixel-based techniques typically operate in disparity space (Intille and Bobick, 1994), where non-reference source images are stabilized with respect to the reference image and match errors are aggregated. A popular technique for enumerating errors is that of plane sweep (Collins, 1996). A representative pixel-based technique is Zitnick and Kanade’s cooperative algorithm (2000), which votes in disparity space using the properties of uniqueness, continuity through local support, and occlusion through local inhibition. Other techniques include a diffusion technique to extract pixels with opacity (Szeliski and Golland, 1999), graph cut (Boykov et al., 2001), and belief propagation (Sun et al., 2003; Sun et al., 2005).
2.1.2. Voxel-based Techniques Rather than operating in disparity space, these techniques establish occupancy explicitly in 3D space through voxels. To reduce the memory requirement, the spatial resolution of voxels is often limited. As a result, the footprint of each voxel typically spans multiple pixels in the source images. The primary idea of voxel-based techniques is to have pixels from the source images voting for the occupancy of voxels. Representative approaches include the original voxel coloring work (Seitz and Dyer, 1997), recovery of voxels with opacity (De Bonet and Viola, 1999; Reche et al., 2004), and treatment of voxels in a probabilistic framework (Broadhurst et al., 2001).
2.1.3. Line or Contour-based Techniques Many early approaches for stereo involve computing correspondences across features such as edges, lines, and contours. Stereo on edges has been accomplished through dynamic programming (Ohta and Kanade, 1985) and through plane sweep (Collins, 1996). Other techniques perform line matching using epipolar geometry and gray level information (Schmid and Zisserman, 1997), and contour matching using epipolar
SegmentStereo.tex; 7/11/2006; 13:07; p.3
4 geometry (Han and Park, 2000). While this is useful as a preprocessing step for generating polygonal 3D models, the output of such techniques is sparse correspondence.
2.1.4. Window-based Techniques Window-based techniques are very popular as a simple means for increasing robustness. Local windows are used to support the depth hypothesis for the pixel of interest, usually with the assumption that neighboring pixels have similar depths. They range from being fixed (Okutomi and Kanade, 1993) and adaptive (Kanade and Okutomi, 1994) to shiftable (Okutomi et al., 2002) and with view selection (Kang et al., 2001).
2.1.5. Segment-based Techniques Using the reasonable assumption that neighboring pixels with similar colors have similar or continuous depths, researchers have used image segments to simplify the stereo problem. This has three important effects. First, it reduces the ambiguity associated with textureless regions. The side effect of the assumption is that depth discontinuities tend to occur at color boundaries. Second, by dealing with much larger segments, the computational complexity is reduced. Finally, noise tolerance is enhanced by aggregating over likecolored pixels. Many techniques have been proposed to break up the image into segments and operating on these segments. One such early technique makes the assumption that the transform across views is piecewise affine (Wang and Adelson, 1994). Baker et al.(1998) use manually segmented regions to compute the plane equations, followed by plane plus parallax to find local depth distributions. More recent work directly relies on color segmentation (Tao et al., 2001), and over-segmented regions (Zitnick et al., 2004). The specific notion of over-segmentation for stereo is further explored in Section 3. We now briefly review issues associated with IBR systems.
2.2. I MAGE -BASED R ENDERING S YSTEMS
Image-based rendering (IBR) (Kang, 1999; Shum et al., 2006) refers to techniques that rely primarily on the source images to produce new virtual views. IBR range from using dense sets of images with no geometry (Levoy and Hanrahan, 1996) or some rough geometry (Gortler et al., 1996) to sparse source images with
SegmentStereo.tex; 7/11/2006; 13:07; p.4
5 high-quality geometry (layered depth images with multiple depths per pixel (Shade et al., 1998) and viewdependent textures (Debevec et al., 1996)). There are a variety of design decisions made for image-based rendering systems. There are differences in system setup and camera configuration, types of data extracted, scene representation, and rendering algorithm. The rendering algorithm used is intimately tied to the representation used, which also affects the rendering speed. The prior approaches provide us with valuable lessons on what works well and what works less effectively, given the goal of photorealistic (that is, artifact-free) scene rendering.
2.2.1. Camera setup The camera setups range from dense configuration (Stanford Light Field Camera (Wilburn et al., 2005)) to intermediate camera spacing (Zitnick et al., 2004) to wide camera distribution (Virtualized RealityTM (Kanade et al., 1997)). Currently, only the Virtualized RealityTM camera setup allows a nearly complete 360 degree range of virtual pan and tilt. However, the wider spacing between the cameras in this system provide more of a challenge in producing locally consistent geometries and hence photorealistic views. This is because occlusions become more of an issue and the non-rigid effects associated with non-Lambertian surface properties (specularities) are much more difficult to deal with. A significantly denser camera configuration such as that of the Stanford Light Field Camera allows effects such as synthetic aperture and focusing (Isaksen et al., 2000). Note that synthetic aperture imagery allows objects that are occluded with respect to any given camera to be seen. As demonstrated by the Light Field-related approaches for static scenes (Gortler et al., 1996; Levoy and Hanrahan, 1996), dense sampling permits photorealistic rendering with just either a simple planar geometric representation or a rough geometric approximation. However, the disadvantage is the large number of images required for rendering. This issue of the image-geometry trade-off was discussed in (Kang et al., 2000). The work of Zitnick et al.(2004) attempts to reduce the required number of input cameras and compensate for this by providing high-quality stereo data. Resolution obviously plays an important role in achieving photorealism, but having a higher resolution will not help if rendering artifacts are not properly handled. These artifacts include boundary or cut-out effects, incorrect or blurred texturing, missing data, and flickering. Boundary or cut-out effects are caused by mixed foreground and background colors in object boundary pixels. Incorrect or blurred texturing can be caused by incorrect stereo extraction, occlusion, and non-rigid effects, while flickering sometimes occurs
SegmentStereo.tex; 7/11/2006; 13:07; p.5
6 if temporal consistency is not accounted for. Unfortunately, humans are highly sensitive to high-frequency spatial and temporal artifacts. Although using a reduced resolution would conveniently help to mask or ameliorate such artifacts, it should not be viewed as a solution or an excuse.
2.2.2. Scene representation The choice of scene representation is critical to the goal of photorealism. Since surfaces of a real scene tend to be non-Lambertian, using a single extracted 3D geometry to represent the scene is not recommended. An exception may be if the scene is highly structured as in the Fac¸ade work on modeling and rendering buildings (Debevec et al., 1996). In such a case, view-dependent texturing on a single geometry may be adequate. However, in general, we think the best choice would be to use view-dependent geometries. This has been demonstrated in a number of approaches, such as (Pulli et al., 1997; Debevec et al., 1998; Heigl et al., 1999), with considerable success. As Zitnick et al.(2004) have demonstrated, using view-dependent geometries as well as extracting the matting (alpha) information at the boundaries and using it for rendering have proven to be highly effective. Boundaries need to be handled correctly in order to avoid artifacts (blurring and/or cut-out effects), and using matting information has been shown to be effective. The difficulty is in avoiding the manual process of indicating the matting areas for subsequent matte extraction. The manual component is required in prior matte extraction techniques. Zitnick et al.use depth discontinuities to automatically indicate areas where foreground and background pixel colors exist, and apply an existing technique for matte extraction (Chuang et al., 2001; Wexler et al., 2002). A more systematic technique for simultaneously extracting matte information and refining depths at discontinuities uses 3D deformable contours as unifying structures (Hasinoff et al., 2004). The spatial-temporal view interpolation technique of Vedula et al.(2005) is an appropriate approach to ensure temporal continuity and thus avoid flickering during rendering. Interestingly, Zitnick et al.showed that it is possible to produce flicker-free rendering without considering the time domain if the stereo data extracted is accurate enough (from the photoconsistency point of view). However, this feat will be difficult to replicate for general scenes with significant non-rigid effects such as specularities and translucencies.
SegmentStereo.tex; 7/11/2006; 13:07; p.6
7 SSD
Over-segmentation stereo
Standard color segmentation stereo
Small segments
Panorama stitching
Large segments
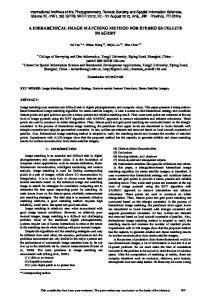
Figure 1. Diagram of various image matching approaches with respect to size of pixel groupings used for correspondence.
3. Image Over-Segmentation
As mentioned in Section 2.1.5, segmentation methods have been proposed for stereo (Wang and Adelson, 1994; Baker et al., 1998; Tao et al., 2001; Zitnick et al., 2004). If we view segmentation methods based on how coarse images are segmented, we arrive at the continuum shown in Figure 1. At one end, pixel-wise matching algorithms such as SSD (sum of square differences) can be viewed as using each individual pixel as a segment. At the other end, algorithms that align entire images using global motion models, such as for panorama stitching, can be viewed as treating each entire image as one large segment. Standard color segmentation approaches (Tao et al., 2001; Bleyer and Gelautz, 2004; Sun et al., 2005) lie between the two ends of the continuum. The effect of using larger segments is to increase the area of support, which usually improves the reliability and accuracy of pixel correspondence. Using segments, correct matches are possible even in the presence of noise, intensity bias, or slight deviations from the Lambertian assumption. The segment size needs to be at a trade-off point where the amount of information within a segment is sufficient for matching without compromising the characterization of the true disparity distribution. Segments that cover a complex disparity distribution or straddle more than two objects are often undesirable. If a segment is too small, it is difficult for it to unambiguously find the correct pixel correspondence. As a result, some mechanism for using information from neighboring segments is typically required to reduce the ambiguity. For single pixel correspondence, graph cuts (Boykov et al., 2001) or belief propagation (Sun et al., 2003) provides this mechanism. In (Tao et al., 2001), neighboring segments are used to help in finding correct correspondences in the vicinity of occlusions. The use of over-segmentation strikes a good balance between providing segments that contain enough information for matching and reducing the risk of a segment spanning multiple objects. The over-segmentation approach occupies the space between single pixel matching and standard segmentation approaches, as shown
SegmentStereo.tex; 7/11/2006; 13:07; p.7
8 in Figure 1. The use of over-segmentation also reduces the computational complexity of the algorithm, since disparities only need to be estimated per-segment rather than per-pixel. Given the smaller size of the segments, more information needs to be shared between segments to find correct correspondences than other segmentation approaches. However, more confidence can be placed in simple matching functions than with single pixel approaches.
4. Algorithm Overview
Stereo vision is known to be a 1D search problem. Given the reduced search space of stereo, it is possible to construct methods that compute and store an estimate for each pixel at each disparity. If we assume each segment has a constant disparity (i.e., each segment is fronto-parallel with respect to some global viewpoint), the requirements become even less demanding. The disparity estimates only need to be stored for each segment rather than each pixel. As we will show, we can create a Markov Random Field (MRF) with the segments as nodes, and the disparity levels as states. The values at each node, called the disparity space image (DSI) (Intille and Bobick, 1994), can then be updated using loopy belief propagation (Sun et al., 2003). Unlike most previous algorithms, we construct a DSI for each image. All of the images are treated equally, and no reference image is designated (Kolmogorov and Zabih, 2002). Initially, a method for computing each disparity map independently is proposed using belief propagation, as opposed to the mean field approach of Zitnick et al.(2004). We then discuss a method for iteratively sharing disparity information across images, while updating the segments’ disparity beliefs. After convergence, the segment is assigned to the disparity with the maximum probability or belief. Before we discuss the exact formulation of the MRF, let us first describe our method for over-segmenting each image.
SegmentStereo.tex; 7/11/2006; 13:07; p.8
9
Figure 2. Neighboring pixels groups used for averaging.
(a)
(b)
(c)
(d)
Figure 3. Segmentation procedure: (a) original image close-up, (b) smoothing image, (c) image broken into square grid and (d) the final segmentation.
4.1. S TEREO S EGMENTATION
The goal of segmentation is to split each image into regions that are likely to contain similar disparities. In creating these segments, we assume that areas of homogeneous color generally have smooth disparities, i.e., disparity discontinuities generally coincide with intensity edges. Since we would like to only construct an MRF and its properties once for each image, a rigid segmentation is computed prior to finding stereo information. Segmentation is done in a two-step process as shown in Figure 3. We first smooth the image using an anisotropic technique described in Zitnick et al.(2004). Next, unlike Zitnick et al.(2004), we cluster neighboring colors using a simple K-means technique. The purpose of smoothing prior to segmentation is to remove as much image noise as possible in order to create more consistent segments. We also want to reduce the number of thin segments along intensity edges, which may result from grouping mixed pixels. Our smoothing algorithm iteratively averages (8 times) a pixel with three contiguous neighbors as shown in Figure 2. The set of pixels used for averaging is determined by which pixels have the minimum absolute difference in color from the center pixel. This simplified variant
SegmentStereo.tex; 7/11/2006; 13:07; p.9
10 of the well known anisotropic diffusion and bilateral filtering algorithms produces good results for our application (Perona and Malik, 1990; Tomasi and Manduchi, 1998). After smoothing, the image is partitioned into a grid of equally sized segments (8×8), as shown in Figure 3(c). The shape and size of each segment are then refined using an iterative K-means algorithm (Figure 3(d)). Each segment sj is modeled as a Gaussian in color space with mean µj and covariance matrix Σj . Similarly, the spatial extent of the segment is modeled with a Gaussian with mean ηj and covariance matrix ∆j . During each K-means iteration µj , ηj , and ∆j are updated. To ensure that segments consist of pixels with roughly constant color, Σj is held fixed to some scalar multiple of the image noise ΣI : Σj = aΣI
(1)
The value of a is typically greater than one, so that the spatial extent of the segment has a slightly greater influence over a pixel’s membership in the segment. As a result, segments maintain an approximate elliptical shape (Figure 3(d)). During the K-means process, if a segment becomes too small (less than 10 pixels) it is removed from consideration.
5. Stereo
Stereo vision assumes two or more images were taken of a static scene, and that the camera parameters, both intrinsic and extrinsic, are known. Given the calibration data, it can be shown that corresponding pixels between cameras lie along the epipolar line. The reduced search space from 2D to 1D allows many approaches for stereo vision to be tractable. In a standard stereo vision examples, such as those in the Middlebury data set, only between 20 to 50 disparity levels need to be considered along the epipolar line. Graph-cuts and belief propagation both iteratively compute values for every disparity value at each pixel. More specifically, belief propagation creates an MRF using the pixels as nodes, and edges between all 4-connected neighbors. The probabilities or beliefs for each disparity at each pixel are then iteratively computed using the loopy belief propagation algorithm. We take a similar approach, except we construct an MRF using segments as nodes. An edge is constructed between two segments if their boundaries touch each other. Thus, the number of neighbors for each node will vary. However, we still formulate our model as a pairwise MRF.
SegmentStereo.tex; 7/11/2006; 13:07; p.10
11
Figure 4. Triangulation of segments used for the MRF.
Sun et al. (2005) modeled stereo using three coupled MRFs, with each modeling disparity, discontinuities, and occlusion. We adopt a different approach and use a single MRF to model disparities. However, unlike (Sun et al., 2005) (which handles only two source images), we handle multiple images; we construct an MRF for each image and use their estimates to predict disparities in other images.
5.1. S TEREO MRF S Given our segmentation, we construct a pairwise MRF for each image using a triangulated graph as shown in Figure 4. Each MRF, Di , for image Ii has a node corresponding to each segment, sk ∈ Si , and an edge between all neighboring segments, sl for l ∈ n(k). Segments are considered neighbors if any two pixels within the segments are 4-connected. The number of states for each node is equal to the number of disparity levels. Our goal is to compute the most probable disparities, Di , given our images I, P (Di | I). Using Bayes’ rule we can rearrange our function to get P (Di | I) =
P (I | Di )P (Di ) . P (I)
(2)
Given that P (I) is fixed for a set of images, we only need to maximize the numerator in equation (2). In the next two sections, we define our values of P (I | Di ) and P (Di ).
5.1.1. Stereo Likelihood Assuming i.i.d. (independent identical distribution) for the noise at each pixel location, the standard likelihood function for an MRF created from pixels locations is P (I | Di ) ∝
Y Y
F (x, dx , Ij ),
(3)
j∈N (i) x
SegmentStereo.tex; 7/11/2006; 13:07; p.11
12
Good match Bad match
0.0
0.0
(a)
(b)
Figure 5. Histogram of segment intensity differences for a bad match (a) and good match (b).
where N (i) is the set of neighboring images to Ii . Typically, F (x, dx , Ij ) is defined as a cost function between the images Ii and Ij , at pixel x ∈ Ii for disparity dx within the range of possible disparities. Using the segmentation approach, our cost function is determined over segments and not pixels. Thus our likelihood function will take the following form: P (I | Di ) ∝
Y
Y
G(sk , dk , Ij ),
(4)
j∈N (i) k∈Si
where G(sk , dk , Ij ) is the segment cost function with image Ij at disparity dk . The segment cost function could use a variety of measures, including sum of square differences (SSD), normalized correlation, mutual information (Kim et al., 2003), etc. Depending on the color balancing across images, the amount of image noise, and the number of specularities, the measures will yield varying results. For applications involving image-based rendering of dynamic scenes, video cameras are used. Images captured from video cameras typically have a higher amount of noise and a wider variation in gain and intensity offsets. To handle these problems, we have developed a matching score computed in two steps. First, we find the greatest percentage of pixels within a segment that match over a range of possible offset differences. Second, given the number of matching pixels, we estimate the match probability. Our first step is to compute the greatest number of matching pixels within a segment over a range of offsets for each possible disparity. To do this, we first project each pixel in the segment onto the neighboring image and find the difference in color or intensity. Each difference is then added to a histogram with bins ranging from −² to ² with the bin width being 1 (see Figure 5(a) and (b)). In our experiments, we set ² = 30, i.e., we do not expect any images to have intensity differences greater than 30 intensity levels. Next, the histogram is convolved with a Gaussian with a standard deviation equal to that of the image noise. Thus, each bin in the histogram will have a value equal to the number of matching pixels for a corresponding offset and given amount of image noise. The largest bin in the histogram, designated h∗k (d), is found for
SegmentStereo.tex; 7/11/2006; 13:07; p.12
13 Teddy
Cones
Cones
# of Segments
# of Segments
Teddy
0
0.1
0.2
0.3
0.4
0.5
0.6
0.7
0.8
0.9
1
0
0.1
0.2
0.3
Match Percentage
0.4
0.5
0.6
0.7
0.8
0.9
1
Scaled Match Percentage
(a)
(b)
Figure 6. Plot of the number of segments with (a) a certain match percentage or (b) scaled match percentage at their correct disparity.
each segment k and disparity d. If the number of pixels in segment k is Ck , the percentage of matching pixels is h∗k (d)/Ck . If we examine the distribution of match percentages h∗k (d)/Ck for non-occluded segments at the correct disparities, we get the results in Figure 6(a). The two plots show the results using the ground truth disparities for the Teddy and Cones stereo pairs from the Middlebury stereo data set. The range of match percentages varies widely, depending on the amount of texture within the segment. Since the Teddy stereo pair has more areas of low texture, its match percentages are generally higher. Since the correct match percentage of each segment varies, we scale the maximum histogram values by each segment’s maximum over all possible disparities, i.e., mk (d) =
h∗k (d) . maxd0 h∗k (d0 )
(5)
After scaling, we get the distribution for mk (d) shown in Figure 6(b), in which the values are clustered around 1. The result is a more reliable indicator of a correct match. To compute the final match probability, we approximate the functions shown in Figure 6(b) using a polynomial of the following form G(sk , dk , Ij ) ∝ mk (d)κ ,
(6)
where κ can be set to any reasonable value which approximates Figure 6(b), and in our experiments κ = 4. At this point, we assume our likelihood function is just a measure of image similarity. In Section 5.1.3, we describe how to extend this to include disparity information from MRFs in neighboring images. This
SegmentStereo.tex; 7/11/2006; 13:07; p.13
14 0.8
0.7
% Same Surface
0.6
0.5
0.4 0.3
0.2 Teddy 0.1
Cones
0 0
10
20
30
40
50
Color Distance
Figure 7. Plot of the percentage of neighboring segments with similar disparities (+/- 1 pixel) with respect to the difference in color between the segments for the Teddy and Cones stereo pairs. The average ground truth disparities for the segments were used.
additional information allows us to handle occlusions, as well as ensures the disparity estimates computed for each image are consistent.
5.1.2. Stereo Prior We strictly enforce the color consistency constraint within segments by assigning all pixels the same disparity. We extend this assumption across segments as well as pixels, that is, neighboring segments with similar color should have similar disparities. In Figure 7, we plotted the percentage of neighboring segments with similar disparities (±1 pixel) with respect to the difference in color between the segments for the Teddy and Cones stereo pairs. We can see the segments with similar color are more likely to have similar depths. Unlike pixels in the same segment, we use a soft constraint between neighboring segments, enforced within our prior. This prior takes the form of the following potential function: P (Di ) ∝
Y
Y
λkl N (dik ; dil , σs2 ) + (1 − λkl )U.
(7)
k∈Si l∈ni (k) 2 ) is a normal distribution with mean d and variance σ 2 , and U is the uniform The function N (dik ; dil , σk,l il s
distribution. The value of σs2 remains fixed and controls the expected amount of variation between similarly colored segments. A smaller value of σs2 biases disparities towards fronto-parallel planes. In our experiments σs2 = 2.5. The value of λkl controls the amount of influence for each neighboring segment. The smaller a value for λkl , the more uniform (7) becomes for a particular segment, which results in that segment exerting less influence. The value for λkl is computed based on the color similarity between segments: 2 /2σ 2 c
λkl = ξe−kck −cl k
+ $,
(8)
SegmentStereo.tex; 7/11/2006; 13:07; p.14
15 where ck and cl are the average colors of segments sk and sl . In our experiments, we set σc = 15, ξ = 0.8, and $ = 0.001. The value of ξ < 1 is used to ensure that no neighboring segment has too much influence, while the value of $ is used to ensure each segment has some influence.
5.1.3. Using neighboring MRFs Previously, we defined our likelihood P (I|Di ) as a function of image similarity. This approach can be quite limited for a couple of reasons. First, some pixels in an image will be occluded in neighboring images. For these pixels, their likelihood cannot be measured using a similarity measure. Second, if we create an MRF for each image, the information contained within each image’s MRF is not passed between neighboring images. For instance, if we project a segment into a neighboring image at a certain disparity, the segments it projects onto should also have a similar disparity. The neighboring MRF can also be used to estimate which segments are occluded. Previously, our goal was to maximize P (Di |I). If D\i is the set of all disparity estimates for every image except Ii , our new goal is to maximize P (Di |I, D\i ) ∝ P (I, D\i |Di )P (Di ).
(9)
Our new likelihood is then a function of both the images and neighboring disparity estimates D\i . Before we define our new likelihood function, we define several values and equations. We denote the probability estimate for segment sik at disparity d within our MRF as pik (d). For each neighboring image Ij , segment sik , and disparity d, we would like to compute the estimated probability of that disparity in the neighboring MRF. To do this, we project the segment sik onto image Ij using the disparity d, and find the set of segments its projection overlaps. If π(x, d) is the segment pixel x ∈ sik projects onto and Cik is the number of pixels within sik , our projected disparity estimate qijk (d) is qijk (d) ∝
1 X p (d). Cik x∈sik jπ(x,d)
(10)
In other words, our projected disparity estimates qijk (d) are the weighted average of disparity probabilities from the segments overlapping the projection of sik in the neighboring image. The sum of qijk (d) over all d will not typically equal 1. For instance, consider Figure 8. The areas of the scene visible by the left camera are shown by solid lines and those visible to the right camera are shown by dotted lines. The projection of segment s1 is occluded from the right camera’s perspective, so
SegmentStereo.tex; 7/11/2006; 13:07; p.15
16
s1
s2
s3
Figure 8. For a given segment in the left image (solid line) a varying number of segments in the right (dotted line) image may be intersected in 3D space. Segment s1 is occluded so it intersects no segments in the right image. Segments s2 and s3 are both non-occluded so they intersect one or more segments in the right image.
P
d qij1 (d)
= 0. For non-occluded segments such as s2 and s3 in Figure 8, the value of P
equal to one if it only intersects with one segment ( P
multiple segments (
d qij3 (d)
d qij2 (d)
P
d qijk (d)
may be
= 1), or greater than one if it intersects with
= 2).
For our likelihood function, we need to estimate whether a segment sik is occluded in image j or not. If the value of
P
d qijk (d)
is low, there are no segments in image j with high belief that they project to sik in
image i. Thus, the segment sik is most likely occluded. We therefore define our occlusion estimate as ωijk = min(1.0,
X
qijk (d)).
(11)
d
ωijk has a continuous value between 0 (occluded) and 1 (not occluded). Along with the projected disparity estimates, we compute another set of disparity estimates for the case when the segment is occluded. An occluded segment should lie behind any segments in the neighboring image. As a result, the disparity estimates oijk (d) for an occluded segment sik should have a value of 0 if it occludes another segment in image j and 1 if it does not. More specifically, we define oijk (d) as oijk (d) ∝ 1.0 −
1 X p (dˆ )h(d − dˆjπ(x,d) + τ ), Cik x∈sik jπ(x,d) jπ(x,d)
(12)
SegmentStereo.tex; 7/11/2006; 13:07; p.16
17 where h(x) = 1 if x ≥ 0 and 0 otherwise, is the Heavyside step function and τ is a constant used to determine if two surfaces are the same. For our experiments, we set τ to 1. dˆik is the disparity d for which pik (d) is maximum. Finally, we define our likelihood function for image Ii using the above definitions: P (I, D\i |Di ) =
Y Y
ωijk qijk (dk )G(sik , dk , Ij ) + (1 − ωijk )oijk (dk ).
(13)
j∈N (i) k
If the segment is not occluded, i.e., ωijk = 1, we define the likelihood function as the product between the projected disparity estimates and the image similarity function. If the segment is occluded, we use the occlusion function to ensure occluded segments lie behind non-occluded segments in other images. Before computing (13), both qijk and oijk are normalized to 1 for each segment.
5.2. U PDATING THE MRF S ’ B ELIEFS If our likelihood function was computed directly from image similarity as in equation (4), we could use standard loopy belief propagation techniques to find a MAP estimate for each image’s MRF. However, in order to handle occlusions and enforce consistency between neighboring disparity estimates, the likelihood function for each MRF is dependent on the neighboring MRFs in equation (13). We could attempt to perform loopy belief propagation over the entire system. Unfortunately, this approach would lead to a prohibitively large number of messages being passed between neighboring MRFs, since each segment is dependent on many segments in the neighboring image, such as with the computation of qijk (d). We propose an iterative approach, where each MRF’s beliefs are updated independently, followed by the likelihood functions being recomputed given the new beliefs of the neighboring MRFs. While this approach cannot be guaranteed to converge, in practice, stable convergence is found. In general, vision algorithms typically demonstrate favorable convergence when using loopy belief propagation, since the problems are largely constrained by the image data terms. A brief outline of the algorithm is as follows: 1. Initialize a) Compute G(sik , d, Ij ) for every segment and disparity. b) Assign uniform distribution for all messages between nodes in the MRFs.
SegmentStereo.tex; 7/11/2006; 13:07; p.17
18 2. Compute the beliefs for each segment. 3. Compute new qijk , ωijk , and oijk values for each segment. 4. Update messages between segments using loopy belief propagation. 5. Repeat steps 2 through 4 until convergence, or a maximum number of iterations is attained. When updating the messages between segments, we use the sum-product method for belief propagation. Since the number of nodes in the segmentation-based MRF are significantly fewer than a pixel-based MRF, we can use this more expensive and exact algorithm over the more commonly used max-product algorithm. To reduce the effect of double counting when passing information between MRFs, we do not use the current image’s beliefs when updating the values in step 3. In other words, when computing equations (10) and (12) for image i with respect to image j, the value of pjπ(x,d) (d) is computed without knowledge of image i’s MRF. Thus, equation (4) is used to compute the likelihood of image j with respect to image i and not equation (13). As occurs with loopy belief propagation, some information about the neighboring image’s MRF is still passed indirectly through the messages of the neighboring segments. When computing the final beliefs for a segment, all the neighboring images are used.
6. Results
We evaluate our algorithm on three sets of experiments. We first compare our results to others using Middlebury’s second version stereo evaluation data set (Scharstein and Szeliski, 2002). Next, we demonstrate the results of our algorithm when noise is added to the images, as well as when the gain and offset between images is varied. Finally, we show some interpolation results between several stereo pairs.
6.1. M IDDLEBURY S TEREO PAIRS To test the accuracy of our method, we computed disparity maps for the Tsukuba, Venus, Teddy and Cones stereo pairs from the Middlebury data set (Scharstein and Szeliski, 2002). The parameters of our algorithm were kept constant for all stereo pairs, with the standard deviation of the image noise set to σI = 2.0. We
SegmentStereo.tex; 7/11/2006; 13:07; p.18
19 discretized the disparity space at 0.5 disparity intervals. The running times were approximately 10 seconds for segmentation and 40 seconds for computing the stereo information for both images with 90 disparity levels on a 2.8GHz PC. Our comparative results are supplied courtesy of the Middlebury stereo evaluation web page (as of March, 2006). The results shown in Table I are based on an error threshold of one pixel in disparity. Four stereo pairs were tested, namely, the Tsukuba, Venus, Teddy, and Cones data sets. For each pair, the number of non-occluded pixels, all pixels and pixels near discontinuities with incorrect disparities are measured. Our results are ranked within the top ten, with our results having an average rank of 6. The actual disparity maps are shown in Figure 9. Notice the sharp boundaries between objects with the minimum of object fattening. This is especially apparent within the lattice of the Cones data set, and in Figure 11. While the disparity estimates for occluded areas is often incorrect, the disparities assigned to the occluded segments lie behind un-occluded segments. As a result, visual errors when interpolating between images is minimized. Several of the visible errors occur due to incorrect segmentation. For example, segmentation errors can be seen at the upper left hand corner of the lower righthand plane in the Venus data set (Figure 9(n)), and the gaps in the lamp (Figure 9(m)). Some scenes, such as the Map sequence from the Middlebury data set, are especially difficult for our algorithm. This is due to the difficultly in cleanly segmenting the foreground and background objects using information from just one image (Figure 10). An additional result in Figure 11 from (Sun et al., 2005) is shown for visual comparison.
6.2. ROBUSTNESS TO N OISE
Our next experiment attempts to demonstrate our algorithm on more realistic scenarios. For IBR, the data is usually captured using video cameras. These video cameras typically have more noise than the Middlebury data set; in addition, they tend to contain intensity offsets and gain differences between images. To simulate video data, we have added white noise, as well as different intensity gains and offsets, to the Teddy and Cones data sets. We tested the algorithm with three levels of difficulty with the noise having a maximum magnitude of 5, 10, and 15 intensity levels. For these experiments we also varied the offsets by 5, 10, and 15 intensity levels and gains by 1.01, 1.02, and 1.03. The numerical results are shown in Table II. The error values are computed using the same technique as in the previous section. In other words, the error measurements were done for all non-occluded pixels, all pixels, and pixels near discontinuities, respectively. Also, an error
SegmentStereo.tex; 7/11/2006; 13:07; p.19
20 threshold of one pixel is used. The image noise σI for each image pair is adjusted based on the amount of noise added. The error results worsen as the noise and differences in intensity gain and offset increase. However, the increase in errors is gradual, and reasonable results are found with even large amounts of noise (Figure 12).
6.3. I NTERPOLATION
Our final set of experiments tests the quality of the image interpolation results using our stereo algorithm. For interpolation, we used the same method as described in (Zitnick et al., 2004). This method computes matting information around all depth discontinuities for each image and depth map. Given a desired projection matrix for the virtual camera viewpoint, the two closest cameras are found. Each camera’s color information is then projected into the virtual camera’s viewpoint and combined using an inverse weighting based on the distance to the cameras. The rendering algorithm uses the matting information to ensure the foreground objects’ boundaries remain smooth and that the foreground colors do not contaminate the background colors. Our first interpolation test uses the Teddy and Cones data sets. Each set contains 8 viewpoints with equal spacing. We only used the second and sixth frames for computing stereo information and rendering. We then rendered a predicted image for the third, fourth and fifth frames that we can compare against the ground truth. The results are shown in Figures 13 and 14. The difference images are also shown along with the rendered and ground truth images. From the difference images, we can see the majority of the errors occur at intensity edges as a result of slight disparity or sub-sampling errors. When viewed as a video, few artifacts are visible. The second interpolation experiment uses a real IBR setup. Each image is captured using a video camera with relatively high noise and slight offset differences. Four images were used to compute disparity information. The disparity maps were all computed simultaneously, and each camera’s MRF was used to update its neighbors. The images and disparity maps are shown in Figure 15. We show three interpolation results in Figure 15(e-g). The cameras were arranged vertically, so the motion between cameras is vertical. Notice the clean separation and soft boundaries between the foreground and background objects. An error in rendering did result in an artifact with the metal vertical bar in the upper righthand corner in Figure 15(f,g) due to incorrectly computed depths.
SegmentStereo.tex; 7/11/2006; 13:07; p.20
21
Table I. Stereo results using version 2 of Middlebury’s data set. The best results are highlighted in bold. Tsukuba Algorithm
nonocc
all
Venus disc
nonocc
all
Teddy disc
nonocc
all
Cones nonocc
disc
all
disc
AdaptingBP
1.11
1.37
5.79
0.1
0.21
1.44
4.22
7.06
11.8
2.48
7.92
DoubleBP
0.88
1.29
4.76
0.14
0.6
2
3.55
8.71
9.7
2.9
9.24
7.8
SymBP+occ
0.97
1.75
5.09
0.16
0.33
2.19
6.47
10.7
17
4.79
10.7
10.9
Segm+visib
1.3
1.57
6.92
0.79
1.06
6.76
5
6.54
12.3
3.72
8.62
10.2
C-SemiGlob
2.61
3.29
9.89
0.25
0.57
3.24
5.14
11.8
13
2.77
8.35
8.2
OUR METHOD
1.69
1.97
8.47
0.5
0.68
4.69
6.74
11.9
15.8
3.19
8.81
8.89
RegionTreeDP
1.39
1.64
6.85
0.22
0.57
1.93
7.42
11.9
16.8
6.31
11.9
11.8
AdaptWeight
1.38
1.85
6.9
0.71
1.19
6.13
7.88
13.3
18.6
3.97
9.79
8.26
SemiGlob
3.26
3.96
12.8
1
1.57
11.3
6.02
12.2
16.3
3.06
9.75
8.9
Layered
1.57
1.87
8.28
1.34
1.85
6.85
8.64
14.3
18.5
6.59
14.7
14.4
7.32
Table II. Results of our algorithm using the Teddy and Cones data sets with white noise added and offsets and gains adjusted. Noise / Offset / Gain
Teddy
Noise / Offset / Gain
nonocc
all
disc
0/0/1
6.74
11.9
15.8
5 / 5 / 1.01
8.32
14.2
10 / 10 / 1.02
10.7
15 / 15 / 1.03
12.5
Cones nonocc
all
disc
0/0/1
3.19
8.81
8.89
19.5
5 / 5 / 1.01
4.4
10.4
10.7
17.1
23.8
10 / 10 / 1.02
6.33
12.3
13.3
18.7
26.1
15 / 15 / 1.03
7.97
13.8
15.2
SegmentStereo.tex; 7/11/2006; 13:07; p.21
22
(a)
(b)
(c)
(d)
(e)
(f)
(g)
(h)
(i)
(j)
(k)
(l)
(m)
(n)
(o)
(p)
Figure 9. Example stereo results: (a-d) original left images, (e-h) segmented image, (i-l) ground truth disparity maps and (m-p) found disparity maps using our method.
SegmentStereo.tex; 7/11/2006; 13:07; p.22
23
(a)
(b)
(c)
Figure 10. Results of Map sequence: (a) original left image, (b) segmentation, and (c) computed disparity map. Since it is difficult to segment the foreground plane from the background from a single image, the performance of our algorithm is worse.
(a)
(b)
(c)
(d)
Figure 11. Results from Puppet sequence: (a) original left image, (b) segmentation, (c) computed disparity map, and (d) result from Sun et al.(2005).
SegmentStereo.tex; 7/11/2006; 13:07; p.23
24
(a)
(b)
(c)
(d)
(e)
(f)
(g)
(h)
(i)
(j)
(k)
(l)
(m)
(n)
(o)
(p)
Figure 12. Results of our algorithm using the Teddy and Cones data sets with white noise added and offsets and gains adjusted: (a-d) close-up on right image from Teddy sequence using amounts of noise and changes in offset and gains from Table II, (e-h) resulting disparity maps using our algorithm, (i-l) close-up of manipulated Cones images, and (m-p) resulting disparity maps.
SegmentStereo.tex; 7/11/2006; 13:07; p.24
25
(a)
(b)
(c)
(d)
(e)
(f)
(g)
(h)
(i)
Figure 13. Rendering results on Teddy sequence: (a-c) ground truth images, (d-f) rendered images, and (g-i) difference map.
SegmentStereo.tex; 7/11/2006; 13:07; p.25
26
(a)
(b)
(c)
(d)
(e)
(f)
(g)
(h)
(i)
Figure 14. Rendering results on Cones sequence: (a-c) ground truth images, (d-f) rendered images, and (g-i) difference map.
SegmentStereo.tex; 7/11/2006; 13:07; p.26
27
(a)
(b)
(e)
(h)
(c)
(f)
(d)
(g)
(i)
(j)
(k)
Figure 15. Rendering and disparity map results on a real IBR scene captured with video cameras: (a-d) original input images, (e-g) rendered virtual camera viewpoints, and (h-k) computed disparity maps.
SegmentStereo.tex; 7/11/2006; 13:07; p.27
28 7. Discussion
As mentioned earlier, future techniques will have to be able to handle more general scenes with strong specularities, reflections, and translucencies. While preliminary techniques for separating the non-linear effects from the diffuse components exist, for example, (Tsin et al., 2003; Lin et al., 2002; Swaminathan et al., 2002), a substantial amount of work is still required to ensure robustness. The new representation would likely be view-dependent and multi-layered to account for depth, matting, and non-linear effects. For practical IBR systems to be interesting and engaging, they would have to handle dynamic scenes. In order for the dynamic scene rendering technology to feasible, the rendering system will have to read from a regular PC hard drive, or even better, from a DVD. Compression will thus be part of the critical path to a practical system. Typically, the DVD reader has the worst I/O bottleneck, but the decoder and renderer must also be able to sustain the stream of data read from the medium. The applications for a dynamic scene rendering system are numerous: games (football, hockey), performances (plays, circus acts), instructional videos (martial arts, golf), and DVD extras (accompanying a movie DVD). The goal of online (real-time) photorealistic viewing (Kanade et al., 1997) is very difficult to achieve today. Not only does the I/O bandwidth issue have to be addressed, the input video has to be processed in real-time as well. With rapid advancements in processor speeds, compression techniques, and other hardware technology, it is just a matter of time before a system capable of real-time video acquisition and scene rendering becomes a reality. Based on prior work on stereo and IBR, it seems that a good trade-off between output quality and efficiency can be obtained by presegmenting the source images. However, we have to consider the fact that segmentation is typically imperfect; in addition, we do not wish to underfit the distribution of depths with large segments with uniform or planar motions. We err on the side of caution by over-segmenting, so that each segment is unlikely to straddle different objects and hence across different depths. In addition, this allows us to approximate sloping disparities as a set of smaller piece-wise constant patches.
SegmentStereo.tex; 7/11/2006; 13:07; p.28
29 8. Conclusion
We have described a stereo method specifically designed for image-based rendering (IBR). IBR techniques have additional requirements, such as being robust to image noise and offset differences that occur with video based systems. While these requirements make the problem more difficult, some types of errors in the extracted depths are permitted. More specifically, depth errors can be tolerated as long as the synthesized views appear physically plausible and artifact-free. For instance, disparity errors in non-textured areas will create minimal rendering artifacts, while errors along object boundaries can be particularly noticeable. Our stereo method is based on image over-segmentation. An MRF is created for each image with the segments as nodes. In the MRF, the disparity estimates for each segment are updated using loopy belief propagation. Since entire segments are matched instead of single pixels, the initial match values are more robust to image noise and intensity bias. Color segmentation also helps to precisely delineate object boundaries; this feature is important to reduce boundary artifacts in the synthesized views. Occlusion reasoning and consistency between disparity maps are handled using MRFs from neighboring images. This ensures that occluded segments lie behind their occluders in neighboring images, which reduces rendering artifacts due to “floaters” (i.e., objects that appear to float in space). We demonstrated our algorithm on several image pairs from the Middlebury stereo data set, and showed that our results are comparable to the state-of-the-art. In addition, our method can handle significant amounts of image noise and offset differences while still maintaining the quality of results. Finally, we have achieved high quality image synthesis using our stereo algorithm and the rendering technique described in (Zitnick et al., 2004). Rendering examples were generated using stereo pairs from the Middlebury data set as well as from sets of synchronized video streams.
References
Baker, S., R. Szeliski, and P. Anandan: 1998, ‘A layered approach to stereo reconstruction’. In: IEEE Conference on Computer Vision and Pattern Recognition. pp. 434–441. Bleyer, M. and M. Gelautz: 2004, ‘A layered stereo algorithm using image segmentation and global visibility constraints.’. In: ICIP. pp. 2997–3000.
SegmentStereo.tex; 7/11/2006; 13:07; p.29
30 Boykov, Y., O. Veksler, and R. Zabih: 2001, ‘Fast approximate energy minimization via graph cuts’. IEEE Transactions on Pattern Analysis and Machine Intelligence 23(11), 1222–1239. Broadhurst, A., T. W. Drummond, and R. Cipolla: 2001, ‘A probabilistic framework for space carving’. In: International Conference on Computer Vision. Chuang, Y.-Y., B. Curless, D. H. Salesin, and R. Szeliski: 2001, ‘A Bayesian approach to digital matting’. In: IEEE Conference on Computer Vision and Pattern Recognition, Vol. 2. pp. 264–271. Collins, R. T.: 1996, ‘A space-sweep approach to true multi-Image matching’. In: IEEE Conference on Computer Vision and Pattern Recognition. San Francisco, pp. 358–363. De Bonet, J. S. and P. Viola: 1999, ‘Poxels: Probabilistic voxelized volume reconstruction’. In: International Conference on Computer Vision. pp. 418–425. Debevec, P., Y. Yu, and G. Borshukov: 1998, ‘Efficient view-dependent image-based rendering with projective Texture-mapping’. In: Eurographics Workshop on Rendering. pp. 105–116. Debevec, P. E., C. J. Taylor, and J. Malik: 1996, ‘Modeling and rendering architecture from photographs: A hybrid geometry- and image-based approach’. Computer Graphics (SIGGRAPH) pp. 11–20. Gortler, S. J., R. Grzeszczuk, R. Szeliski, and M. F. Cohen: 1996, ‘The Lumigraph’. In: Computer Graphics (SIGGRAPH). New Orleans, pp. 43–54. Han, J. H. and J. S. Park: 2000, ‘Contour matching using epipolar geometry’. IEEE Transactions on Pattern Analysis and Machine Intelligence 22(4), 358–370. Hasinoff, S. W., S. B. Kang, and R. Szeliski: 2004, ‘Boundary matting for view synthesis’. In: IEEE Workshop on Image and Video Registration. Washington, DC. Heigl, B., R. Koch, M. Pollefeys, J. Denzler, and L. Van Gool: 1999, ‘Plenoptic modeling and rendering from image sequences taken by hand-held camera’. In: DAGM. pp. 94–101. Intille, S. S. and A. F. Bobick: 1994, ‘Disparity-space images and large occlusion stereo’. In: European Conference on Computer Vision. pp. 179–186. Isaksen, A., L. McMillan, and S. Gortler: 2000, ‘Dynamically reparameterized light fields’. Computer Graphics (SIGGRAPH) pp. 297–306. Kanade, T. and M. Okutomi: 1994, ‘A stereo matching algorithm with an adaptive window: Theory and experiment’. IEEE Transactions on Pattern Analysis and Machine Intelligence 16(9), 920–932. Kanade, T., P. W. Rander, and P. J. Narayanan: 1997, ‘Virtualized Reality: Constructing virtual worlds from real scenes’. IEEE MultiMedia Magazine 1(1), 34–47. Kang, S. B.: 1999, ‘A survey of image-based rendering techniques’. In: Videometrics VI (SPIE International Symposium on Electronic Imaging: Science and Technology), Vol. 3641. San Jose, CA, pp. 2–16. Kang, S. B., R. Szeliski, and P. Anandan: 2000, ‘The geometry-image representation tradeoff for rendering’. In: International Conference on Image Processing.
SegmentStereo.tex; 7/11/2006; 13:07; p.30
31 Kang, S. B., R. Szeliski, and J. Chai: 2001, ‘Handling occlusions in dense multi-view stereo’. In: IEEE Conference on Computer Vision and Pattern Recognition, Vol. 1. pp. 103–110. Kim, J., V. Kolmogorov, and R. Zabih: 2003, ‘Visual correspondence using energy minimization and mutual information’. In: International Conference on Computer Vision. pp. 1033–1040. Kolmogorov, V. and R. Zabih: 2002, ‘Multi-camera scene reconstruction via graph cuts’. In: European Conference on Computer Vision, Vol. 3. pp. 82–96. Levoy, M. and P. Hanrahan: 1996, ‘Light field rendering’. Computer Graphics (SIGGRAPH) pp. 31–42. Li, S. Z., H. Wang, K. L. Chan, and M. Petrou: 1997, ‘Energy minimization and relaxation labeling’. Journal of Mathematical Imaging and Vision 7(2), 149–161. Lin, S., Y. Li, S. B. Kang, X. Tong, and H.-Y. Shum: 2002, ‘Simultaneous separation and depth recovery of specular reflections’. In: European Conference on Computer Vision, Vol. 3. Copenhagen, Denmark, pp. 210–224. Ohta, Y. and T. Kanade: 1985, ‘Stereo by intra- and inter-scanline search using dynamic programming’. IEEE Transactions on Pattern Analysis and Machine Intelligence PAMI-7(2), 139–154. Okutomi, M. and T. Kanade: 1993, ‘A Multiple-Baseline Stereo’. IEEE Transactions on Pattern Analysis and Machine Intelligence 15(4), 353–363. Okutomi, M., Y. Katayama, and S. Oka: 2002, ‘A simple stereo algorithm to recover precise object boundaries and smooth surfaces’. International Journal of Computer Vision 47(1-3), 261–273. Perona, P. and J. Malik: 1990, ‘Scale space and edge detection using anisotropic diffusion’. IEEE Transactions on Pattern Analysis and Machine Intelligence 12(7), 629–639. Pulli, K., M. Cohen, T. Duchamp, H. Hoppe, J. McDonald, L. Shapiro, and W. Stuetzle: 1997, ‘View-based rendering: Visualizing real objects from scanned range and color data’. In: Eurographics Workshop on Rendering. St. Etienne, France. Reche, A., I. Martin, and G. Drettakis: 2004, ‘Volumetric reconstruction and interactive rendering of trees from photographs’. Proceedings of SIGGRAPH (ACM Transactions on Graphics) pp. 720–727. Scharstein, D. and R. Szeliski: 2002, ‘A taxonomy and evaluation of dense two-frame stereo correspondence algorithms’. International Journal of Computer Vision 47(1), 7–42. Schmid, C. and A. Zisserman: 1997, ‘Automatic line matching across views’. In: IEEE Conference on Computer Vision and Pattern Recognition. pp. 666–671. Seitz, S. M. and C. M. Dyer: 1997, ‘Photorealistic scene reconstruction by voxel coloring’. In: IEEE Conference on Computer Vision and Pattern Recognition. pp. 1067–1073. Shade, J., S. Gortler, L.-W. He, and R. Szeliski: 1998, ‘Layered depth images’. In: Computer Graphics (SIGGRAPH). Orlando, pp. 231–242. Shum, H.-Y., S.-C. Chan, and S. B. Kang: 2006, Image-Based Rendering. Springer. Sun, J., Y. Li, S. B. Kang, and H.-Y. Shum: 2005, ‘Symmetric stereo matching for occlusion handling’. In: IEEE Conference on Computer Vision and Pattern Recognition, Vol. 2. pp. 399–406.
SegmentStereo.tex; 7/11/2006; 13:07; p.31
32 Sun, J., H.-Y. Shum, and N.-N. Zheng: 2003, ‘Stereo matching using belief propagation’. IEEE Transactions on Pattern Analysis and Machine Intelligence 25(7), 787–800. Swaminathan, R., S. B. Kang, R. Szeliski, A. Criminisi, and S. K. Nayar: 2002, ‘On the motion and appearance of specularities in image sequences’. In: European Conference on Computer Vision, Vol. 1. Copenhagen, Denmark, pp. 508–523. Szeliski, R.: 1999, ‘Prediction error as a quality metric for motion and stereo’. In: International Conference on Computer Vision. pp. 781–788. Szeliski, R. and P. Golland: 1999, ‘Stereo matching with transparency and matting’. International Journal of Computer Vision 32(1), 45–61. Tao, H., H. S. Sawhney, and R. Kumar: 2001, ‘A global matching framework for stereo computation’. In: International Conference on Computer Vision, Vol. 1. pp. 532–539. Tomasi, C. and R. Manduchi: 1998, ‘Bilateral filtering for gray and color images’. In: International Conference on Computer Vision. pp. 839–846. Torr, P. H. S.: 2002, ‘Quadratic programming and MAX CUT to solve matching, segmentation and other Markov Random Fields’. Technical Report MSR-TR-2002-68, Microsoft Research. Tsin, Y., S. B. Kang, and R. Szeliski: 2003, ‘Stereo matching with reflections and translucency’. In: IEEE Conference on Computer Vision and Pattern Recognition, Vol. 1. Madison, WI, pp. 702–709. Vedula, S., S. Baker, P. Rander, R. Collins, and T. Kanade: 2005, ‘Three-Dimensional Scene Flow’. IEEE Transactions on Pattern Analysis and Machine Intelligence 27(3), 475 – 480. Wang, J. and E. Adelson: 1994, ‘Representing moving images with layers’. IEEE Transactions on Image Processing 3(5), 625–638. Wexler, Y., A. W. Fitzgibbon, and A. Zisserman: 2002, ‘Bayesian estimation of layers from multiple images’. In: European Conference on Computer Vision, Vol. 3. pp. 487–501. Wilburn, B., N. Joshi, V. Vaish, E.-V. Talvala, E. Antunez, A. Barth, A. Adams, M. Horowitz, and M. Levoy: 2005, ‘High performance imaging using large camera arrays’. Proceedings of SIGGRAPH (ACM Transactions on Graphics) 24(3), 765–776. Zitnick, C. L. and T. Kanade: 2000, ‘A cooperative algorithm for stereo matching and occlusion detection’. IEEE Transactions on Pattern Analysis and Machine Intelligence 22(7), 675–684. Zitnick, C. L., S. B. Kang, M. Uyttendaele, S. Winder, and R. Szeliski: 2004, ‘High-quality video view interpolation using a layered representation’. Proceedings of SIGGRAPH (ACM Transactions on Graphics) pp. 600–608.
SegmentStereo.tex; 7/11/2006; 13:07; p.32