Full Length Research Paper
Support vector regression and rule based classifier comparison for power quality diagnosis Azah Mohamed*, Mohamed Fuad Faisal and Hussain Shareef Department of Electrical, Electronic and Systems, University Kebangsaan Malaysia. Accepted 18 October, 2011
This paper presents a comparative study for performing automated power quality diagnosis using rule base classifier (RBC) and support vector regression (SVR) to identify the causes of short duration voltage disturbances such as voltage sag and swell. In the proposed power quality diagnosis method, a time frequency analysis technique called as the S-transform was used to analyse and extract features of voltage disturbances recorded from the power quality monitoring system. The RBC and SVR which are intelligent techniques were then used to identify whether the voltage disturbances were caused by permanent, non-permanent transient or incipient faults. Test results proved that the RBC performed better than the SVR in diagnosing the causes of short duration voltage disturbances. Key words: Power quality diagnosis, support vector regression, s-transform.
INTRODUCTION One of the most important steps in power quality (PQ) management is to diagnose the causes of the PQ problems. The types of PQ problems frequently experienced by customers are voltage sags and momentary interruptions while the less frequent ones include harmonics, transient, flicker and noise. Voltage sags and momentary interruptions are commonly caused by faults in the power networks. Quick identification of network faults will allow more time for network operators to perform counter measure, planning and implement suitable mitigation measures. Network faults resulting in voltage sags are the most common events and can occur within the customer’s plant or in the utility power system. These faults may be categorized as permanent and non-permanent faults. Permanent faults are short circuits caused by external interferences and may cause outages and PQ related disturbances such as voltage sag and voltage swell. A permanent fault normally requires some form of repair before power can be restored and its outage times range from 1 min to many hours and produces
*Corresponding author. E-mail:
[email protected].
sustained interruption (IEEE 1159 2009). Examples of permanent faults are underground cable joint faults, termination cable faults and flashover at medium voltage circuit breakers. Non-permanent faults, however, occur at random moments and affect the system behavior for finite period of time. These faults comprise either of transient faults which can be caused by environmental conditions, or intermittent faults which are caused by non-environmental conditions such as loose connections and aging components. These intermittent faults are called ‘incipient faults’ which occur due to partial damage that progressively weakens the integrity of the network components over time and will lead to permanent insulation failure (Weeks and Steiner, 1982). These incipient faults typically last between half-cycle (10 m/s) to 3 half-cycles (30 m/s) in a 50 Hz power system. During such period, partial discharges (PD) are present in the voltage and current waveforms. The primary objectives of PQ diagnosis are to identify the sources and causes of the PQ problems. Next is to identify and implement solutions to resolve the PQ problems. From the literature, many research works have been performed in developing various methods for performing PQ diagnosis (Santoso et al., 2000; Styvaktakis et al., 2002; Schmaranz et al., 2004;
Chunga et al., 2007; Gerek et al., 2006; Bollen et al., 2007). Santoso et al. (2000) showed that unique features which include peak amplitudes, frequency, RMS values, and wavelet transform coefficients can be used to identify causes of voltage events due to converter operation, transformer energization and capacitor energization. These features were used to build a PQ cause identification module using a rule-based expert system. However, no verification of results was made to evaluate the accuracy of this approach. The emphasis of the study is the importance of identifying the right features for classifying the causes of the PQ events. A simpler method for identifying the causes of voltage sags using only RMS values was developed by Styvaktakis et al. (2002). The method starts with segmenting the RMS voltage series into event and transition segments in which the segmentation is based on detecting sudden changes in the voltage magnitude. Classification of voltage sag causes is done by characterizing the segments of each phase as well as comparing the corresponding segments between the phases. Seven types of causes considered are energizing of cable, non-fault interruption, fault interruption, transformer saturation, induction motor starting, voltage step change and permanent fault. It is noted that the accuracy of the voltage sag cause identification is 92%. Schmaranz et al. (2004) developed an event detector and classifier to identify the causes of voltage sags and momentary interruption due to isolation faults, broken lines, capacitor switching, motor starting, transformer energizing and turbine swinging. The features used for performing the event and cause identification are based on the RMS voltages, RMS currents, values of fundamental frequency and phase angle jumps. These features are then applied to a fuzzy expert system in which the accuracy in identifying the causes of sags and momentary interruption is 86%. Gerek et al. (2006) implemented a PQ diagnosis method by classifying two causes of short duration disturbances using a common vector classifier and wavelet transform coefficients together with spectral harmonic ratios as features. The two causes are arcing faults or high impedance fault and motor startup events. The PQ diagnosis method depends on the change in the behavior of the voltage waveform by monitoring its variance. Chunga et al. (2007) developed a PQ diagnosis system (PQDS) based on available data from an existing PQ monitoring system. The PQDS which is a GUI based software diagnosed PQ disturbance data stored in the related PQ Server in order to identify the types, sources and causes of the disturbance. From the study conducted, it is noted that the PQDS is only able to diagnose voltage sags and harmonics and not able to diagnose multiple PQ disturbances in non-stationary waveforms. In real situations, many PQ disturbances are non-stationary and occur in multiple forms. In a related study, the performance of two classification methods for
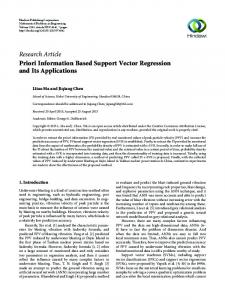
diagnosing the causes of PQ disturbances was evaluated by Bollen et al. (2007). The first method based on expert system and deterministic classification is compared with the second method based on SVM and statistical classification. The list of underlying causes of disturbances being considered in this study includes energizing, non-fault interruption, fault interruption, transformer saturation due to fault, induction motor starting, transformer saturation followed by protection operation, single stage dip due to fault and multistage dip due to fault. The results of the study showed that the expert system and the SVM gave diagnosis accuracies of 97 and 92.1%, respectively for diagnosing a total of 962 disturbance data. Ismail et al. (2009) also applied SVM to classify the causes of voltage sags. Two kernels functions were used, namely: the radial basis function (RBF) and ‘polynomial function’ for the SVM. Based on the result of the study, it was found that the SVM-polynomial kernel performed better compared to the SVM-RBF kernel in classifying the causes of voltage sags. In this research, a novel and practical PQ diagnosis method is proposed by classifying the causes of the short duration disturbances as either permanent or non-permanent fault. The causes due to permanent faults will be further categorized as network faults and faults in the customer’s installations. The non-permanent faults will be categorized either as transient and incipient faults. These disturbance causes are considered more practical in the daily operation of distribution networks. The aim of this paper is to evaluate the accuracy of the widely used artificial intelligence techniques, namely: rule base classifier (RBC) and support vector regression (SVR) in developing this PQ diagnosis method. The RBC is the most preferred technique for performing diagnosis due to its simplicity and practicality and has been developed in Faisal et al. (2011). MATERIALS AND METHODS Application of S-transform for identifying and diagnosing the voltage disturbances The S-transform (Pinnegar and Mansinha, 2003) is used to extract features for identifying the short duration voltage disturbances and causes of the disturbances which may be due to either permanent or non-permanent faults. Here, two S-transform indices, namely: the S-transform magnitude-time voltage (STMV) and the ST frequency-time voltage (STFV) (Faisal et al., 2011) are used as features to categorize the types of network faults described in Figure 1. The STMV are the maximum values of the elements present in the column of the S-matrix while the STFV are the change in values of the frequency resolutions in the S-matrix. Here, the S-matrix gives the output of the S-transform in the form of M × N matrix in which M are the rows pertain to frequency and N are the columns pertain to time (Faisal et al., 2011). Each element of the S-matrix is a complex number. The information in the S-matrix can be plotted as time-frequency contours. Features of a disturbance signal are extracted from the S-transform analysis in terms of time-frequency
Figure 1. Categories of network faults.
representation (TFR) curve or S-transform contour that represents the energy distribution at different frequency bands over a certain period of time. The magnitude of the ST contours can be extracted from the S-matrix by isolating the maximum values of the elements present in the column of the S-matrix. These maximum values are named as the STMV features. The STMV feature for the red phase is given as:
S R Vi , j
Where
f 2
S RVi , j
v
R
(t )e
( t )2 2
e i 2ft dt
(1)
is the S-matrix for voltage,
vR , i = 1………N, number
of columns and j = 1………M, number of rows. The STMV for the red, yellow and blue phases which are the maximum values in all the columns of the S-matrix are given as:
VSTMVR max( S RVi )
(2)
VSTMVY max( SY Vi )
(3)
VSTMVB max( S BVi )
(4)
Next, the integrity of STMV is evaluated against the RMS using a scatter plot. The minimum STMV values for 215 numbers of voltage sags data are calculated and plotted on a scatter plot and are compared with the minimum values of the RMS voltage magnitudes. All the values of the voltage sags meet the definition of voltage sags based on the IEEE 1159 standard (2009) in which voltage sag values are from 10 to 90% of the nominal voltage. It was found that the range of STMV values to detect voltage sags are from 12 to 95% of the nominal STMV value. This STMV
range of values is then used in detecting as well as for extracting features of voltage sags. The duration of voltage sags based on the STMV values are evaluated against the duration of voltage sags detected using the RMS technique. According to the IEEE 1159 standard (2009), the duration of voltage sag is the duration when the RMS voltage sagged below 90 to 10% of the nominal voltage and then recovers back above 90% of the nominal voltage after the cause of the sag is isolated. Using the STMV, the duration of voltage sag is the duration when the value of the STMV sagged below 95 to 12% and recovers back above 95% once the cause of the voltage sag is isolated. Therefore, the duration calculated from the STMV values are used for extracting feature of a voltage sag. To evaluate the accuracy of the STMV in detecting voltage swell, it is also compared with the RMS voltage values using a scatter plot. The minimum/maximum STMV values for 31 numbers of voltage swell data are calculated and plotted on a scatter plot and both the minimum and maximum values of the RMS voltage magnitudes are plotted in the same figure. All the values of the RMS voltage swells meet the standard voltage swell value which is above 110% of the nominal voltage. The range of the STMV values to detect voltage swell are above 117%. This STMV values is then used for detecting voltage swell. According to the IEEE 1159 standard (2009), the duration of a voltage swell is the duration when the RMS voltage increases above 110% of its nominal voltage and recovers back when the voltage is below 110% of its nominal voltage after the cause of the voltage swell is isolated. The duration of a voltage swell is determined when the STMV value increases above 117% and recovers back when the STMV value is below 117% once the cause of the voltage swell is isolated. Therefore, the duration calculated from the STMV values are used for detecting as well as for extracting features of voltage swell. From the STMV values, four features denoted by F1, F2, F3 and F4 are selected for detecting short duration voltage disturbances such voltage sag and swell. The detailed descriptions of these features are described as shown in Table 1. The range of values for features F1 and F2 are based on the time duration of the STMV in detecting voltage sags and swells which are the values below 0.95 and above 1.17 per unit, respectively. The range of
Table 1. Description of features based on the STMV values.
Features F1 F2 F3 F4
Description Duration (ms) of the STMV value between 0.12 to 0.95 per unit. Duration (ms) of the STMV value above 1.17 per unit. The minimum STMV values between 0.12 to 0.95 per unit. The maximum STMV values above 1.17 per unit.
values for features F3 and F4 are based on the minimum and maximum values of the STMV in detecting voltage sags and swells, respectively. Thus, voltage sags and swells are characterized based on the STMV features (F1, F2, F3 and F4) described in Table 1. The second set of features is based on the ST frequency-time voltage (STFV) plot which indicates the changes in the frequency resolutions. For extracting the features of disturbances such as transients and waveform distortions, the STFV is developed based on the values of the frequency resolutions in the S-matrix. The values of the STFV will indicate the changes in the system frequency. For the derivation of the STFV index, consider the STFV for the red phase which is given by:
S R Vi , j Where
f 2
S RVi , j
v
R
(t )e
( t )2 2
e i 2ft dt
(5)
is the S-matrix for voltage,
vR , i = 1………N, number
of columns and j = 1………M, number of rows. Considering the vectors of the maximum value for all the rows in the S-matrix for the voltages of all the three phases, the STFV for the red, yellow and blue phases are derived as follows:
VSTFVR max( S RV j )
(6)
VSTFVY max( SY V j )
(7)
VSTFVB max( S BV j )
(8)
To systematically categorize the types of network faults, two new features, F5 and F6 are derived from the STFV. Feature F5 is the sum of the standard deviations STDVR, STDVY and STDVB for the red, yellow and blue phase voltage waveforms, respectively. The equation for feature F5 is derived as follows:
F 5 STDVR2 STDVY2 STDVB2
(9)
The next feature, F6, is the difference between the maximum and minimum values of the STFV plots. The equation for feature F6 is derived as follows:
F 6 MAXVR2 MAXVY2 MAXVB2 Where MAXVR = max(STFVR)-min (STFVR), MAXVY = max(STFVY)-min(STFVY), and
(10)
MAXVB = max(STFVB)-min(STFVB) The features, F5 and F6 are used for identifying the causes of the short duration voltage disturbances such as voltage sag and swell. To extract the features, 105 numbers of data which comprised of both voltage sags and voltage swells were used. The actual causes of the voltage sags and swells were known earlier based on correlation done with the power utility reliability databases. Once the causes are known, the respective values of the features F5 and F6 were calculated and plotted on a scatter plot. From the scatter plots, the ranges for feature, F5 to differentiate between permanent faults and non-permanent faults were identified. It is noted that the feature F5 to classify permanent faults and non-permanent faults has values greater than 0.100 and less than 0.100, respectively as shown in Table 2. Later, the non-permanent fault are further classified either as transient and incipient faults. Similar methodology was applied for feature F6. The values of feature F6 for 105 numbers of short duration disturbance data were calculated and plotted on as a scatter plot. From the scatter plot, the ranges for feature F6 for classifying permanent faults and non-permanent faults are greater than 0.400 and less than 0.400, respectively as shown in Table 3. The same features, F5 and F6, developed earlier for detecting permanent and non-permanent faults are now calculated for the incipient fault waveforms. After the non-permanent faults are detected, the respective values of the features F5 and F6 are calculated and plotted on a scatter plot. From the scatter plots, the ranges for feature F5 to differentiate between transient and incipient faults are identified. The transient and incipient faults are detected such that if the features meet the specific data ranges for incipient fault, then it is considered as an incipient fault. If the data range does not meet the limits of incipient fault, then the fault is categorized as a transient fault. The summary of all the F5 ranges to detect transient and incipient fault is shown in Table 4. Similar procedure was applied for feature F6. The range of values of feature F6 for detecting transient and incipient fault is shown in Table 5. All these feature values are used as inputs to the RBC and SVR techniques.
Power quality diagnosis using rule based classifier and support vector regression PQ diagnosis was developed using the S-transform and applied to two artificial intelligence techniques that is, the RBC and the SVR techniques. The process flowchart for PQ diagnosis using the RBCs is shown in Figure 2 in which it begins with recording of disturbance data using the on-line PQ management system. These data are then processed using the S-transform to extract the features that characterize the short duration disturbances. These features are then applied to three RBCs in which the first RBC classifies the types of short duration voltage disturbances either as voltage sag/swell or other types of PQ disturbances, while the second RBC diagnoses the cause of sag/swell as either due to permanent or non-permanent faults. The third RBC than further classifies the non-permanent fault as either transient or incipient fault. And the final result of the RBC is the cause of
Table 2. Feature F5 for classifying permanent and non-permanent faults.
Feature F5
Permanent fault F5>0.100.
Description Square root of the sum of the standard deviations (std) for STFV.
Non-permanent fault F50.400
F6