Supporting Information Appendix S1. Summary statistics for infection ...
Recommend Documents
0.43, P < 0.001) and marked dissimilarity (Bray Curtis index: mean ± SD = 0.75 ± 0.15, N = 55). ANOSIM paired ... List of plant species with its family and growth type, recorded with ripe fleshy-fruits in ... Sampling site acronyms as in. Table 1.
S1 Appendix. Summary Statistics: Demographics. Denmark. NoInt. R1Int. R2Int. Obs. Mean Std. Dev. Obs. Mean Std. Dev. Obs. Mean Std. Dev. Age. 72. 23.88.
Johnston CA, Lipcius RN (2012) Exotic macroalga Gracilaria vermiculophylla provides superior nursery habitat for native blue crab in Chesapeake Bay. Marine ...
Cingolani, P., Platts, A., Wang le, L., Coon, M., Nguyen, T., Wang, L., Land, S. J., Lu, X. and Ruden, D. M. (2012) A program for annotating and predicting the ...
Adam Lampert and Tsvi Tlusty. S1 Appendix: Calculating the thresholds. Here, we calculate (i) s0, the critical value of s above which q = 1 is not dominant, and ...
2011) is a portion of the Buffalo Gap. National ... Prairie dog colonies in Conata Basin, Badlands National Park, and Buffalo Gap National Grasslands in southwestern ...... Ecke, D.H. & Johnson, C.W. (1952) Plague in Colorado and Texas.
8 University of British Columbia, Vancouver, Canada. 9 Harvard University .... Note that as the Indo-Fijian sample (Lovu) contributed no local deity data, all local.
Raw data for this plot was produced by MultiGeneBlast (28) using the C. higginsianum CTB cluster (see Figure 3) as query; and listed are the best records per ...
acquisition time [ms]; D1: relaxation delay [ms]; NE: number of F1 increments in 2D NMR spectra; WDW1, WDW2: apodization functions in F1/ F2 (EM/GM: line ...
... Francesco d'Errico, Francisco Giles Pacheco, Ruth Blasco, Jordi ... Gutiérrez López, José S. Carrión, Juan José Negro, Stewart Finlayson, Luís M. Cáceres, ...
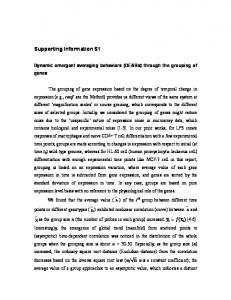
asymptotic frequency distribution for temporal expression of genes within the group ... cell differentiation, gene expression dynamics exhibits coherent oscillating ...
Cardin JA, Carlen M, Meletis K, Knoblich U, Zhang F, et al. (2009) Driving fast-spiking cells induces gamma rhythm and controls sensory responses. Nature 459: ...
labeled in the inner nuclear layer near the border to the inner plexiform layer. Layers of the retina: 1, photoreceptor outer and inner segments; 2, outer nuclear ...
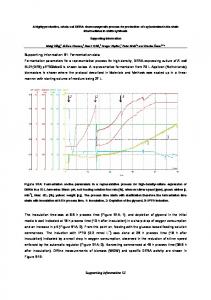
BL21(DE3) pET30/deoC is shown below. A representative fermentaion from 70 L Applicon (Netherlands) bioreactors is shown where the protocol described in ...
Investigation of the VUV and UV-C Photolysis of Fluorocarbons. ... Leea, Steffen Jockuscha, Nicholas J. Turro*a, Roger H. Frenchb, Robert C. Whelandb, M.
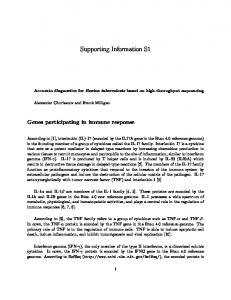
According to RefSeq, the interleukin-2 (IL-2) receptor α (IL2RA) and β (IL2RB) chains, ... α chains (IL2RA) result in a low-affinity receptor, while homodimeric β ...
Where HRi,j are the hazard ratios estimated at time i in trial j through the use of the log-rank observed minus expected number of deaths and its variance.
cm, the distance between viewer and screen be d cm, and the horizontal ... theoretical approach to improving face recognition in disorders of central vision: ... S > 0 be the maximum phosphene size, which we fix to 0.357 multiplied by.
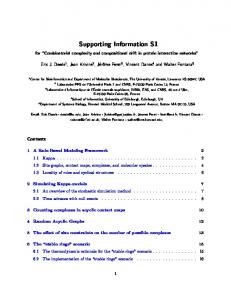
Corresponding time series plots are shown below, with significant linear fits indicated by a solid line. Sample sizes: spring (n = 47); fall (n = 54). Spring. Fall.
a show-up fee of AC4 will be paid for taking part to this experiment. The experiment is made of two phases which are conducted in two days (Phase 1 today ...
distributions the defecation probability distributions, which we plot in S1 Fig. Two Gaussian probability density functions, P1(t) and P2(t), have been fitted to these ...
Supporting Information Appendix S1. Summary statistics for infection ...
Appendix S1. Summary statistics for infection load over the ten populations of wood frog including sample size, median infection load, mean infection load, and ...
Supporting Information Appendix S1. Summary statistics for infection load over the ten populations of wood frog including sample size, median infection load, mean infection load, and 95% CI for mean infection load (log (1+ Bd genomic equivalents)) for each population. Population