Soil Biology & Biochemistry 38 (2006) 1290–1297 www.elsevier.com/locate/soilbio
Temporal and spatial dynamics of soil solution C and N concentrations during Lolium perenne L. sward establishment and the effects of elevated CO2 and N additions P.W. Hill a,*, D.L. Jones b, C. Marshall c, J.F. Farrar a,c a
Institute of Environmental Science, University of Wales Bangor, Robinson Building, Deiniol Road, Bangor, Gwynedd LL57 2UW, UK b School of Agricultural and Forest Sciences, University of Wales Bangor, Bangor, Gwynedd LL57 2UW, UK c School of Biological Sciences, University of Wales Bangor, Deiniol Road, Bangor, Gwynedd LL57 2UW, UK Received 8 July 2005; received in revised form 6 September 2005; accepted 30 September 2005 Available online 2 November 2005
Abstract There is now clear evidence for a prolonged increase in atmospheric CO2 concentrations and enrichment of the biosphere with N. Understanding the fate of C in the plant–soil system under different CO2 and N regimes is therefore of considerable importance in predicting the environmental effects of climate change and in predicting the sustainability of ecosystems. Swards of Lolium perenne were grown from seed in a Eutric Cambisol at either ambient (ca. 350 mmol molK1) or elevated (700 mmol molK1) atmospheric pCO2 and subjected to two inorganic N fertilizer regimes (no added N and 70 kg N haK1 monthK1). After germination, soil solution concentrations of dissolved organic C (DOC), dissolved inorganic N (DIN), dissolved organic N (DON), phenolics and HC were measured at five depths down the soil profile over 3 months. The exploration of soil layers down the soil profile by roots caused transient increases in soil solution DOC, DON and phenolic concentrations, which then subsequently returned to lower quasi-stable concentrations. In general, the addition of N tended to increase DOC and DON concentrations while exposure to elevated pCO2 had the opposite effect. These treatment effects, however, gradually diminished over the duration of the experiment from the top of the soil profile downwards. The ambient pCO2 plus added N regime was the only treatment to maintain a notable difference in soil solution solute concentration, relative to other treatments. This effect on soil solution chemistry appeared to be largely indirect resulting from increased plant growth and a decrease in soil moisture content. Our results show that although plant growth responses to elevated pCO2 are critically dependent upon N availability, the organic chemistry of the soil solution is relatively insensitive to changes in plant growth once the plants have become established. q 2005 Elsevier Ltd. All rights reserved. Keywords: Dissolved organic carbon; Elevated CO2; Humic substances; Lolium perenne grassland; Nitrogen fertilizer; Soil solution pH
1. Introduction The concentration of atmospheric CO2 has increased by 32% in the last 250 years of increasing global industrialisation (Nowak et al., 2004). Given this relatively rapid rise in CO2 concentration, and its links to projected increases in global temperature, there has been considerable interest in C cycling in biological systems and their potential to mitigate the effects of rising CO2 concentrations by enhanced C sequestration. In addition, approximately 80 Tg of anthropogenically fixed N is applied to land globally as fertilizer during normal agricultural * Corresponding author. Tel.: C44 1248 351151x2545; fax: C44 1248 383646. E-mail address:
[email protected] (P.W. Hill).
0038-0717/$ - see front matter q 2005 Elsevier Ltd. All rights reserved. doi:10.1016/j.soilbio.2005.09.024
practice (Vitousek et al., 1997), which has led to the enrichment of both agricultural and semi-natural ecosystems with N. Grasslands receive considerable additions of N and account for approximately 20% of the terrestrial land area and 10% of global C storage (Ainsworth et al., 2003), with most of this C being stored in soils. Thus, the fate of the applied N and its effect on C cycling in grassland is of great importance. The soil solution is the main interface between the main suppliers of C to the soil, plants, and the main consumers of the plant-derived C, soil microbes (van Hees et al., 2005). It also mediates the supply of inorganic (and to a lesser degree, organic) N to plants, which enters the soil solution during N mineralisation by microbes or as a result of fertilizer addition (Jones et al., 2005). Furthermore, soil solution is the main route of supply of organic N for mineralisation by soil microbes. Therefore, it is important to understand how the dynamics of C and N compounds in the soil solution are affected by global
P.W. Hill et al. / Soil Biology & Biochemistry 38 (2006) 1290–1297
change; in this case increased atmospheric CO2 concentrations and changes in the supply of N to the grassland ecosystem. The loss of dissolved organic C (DOC), dissolved organic N (DON) and dissolved inorganic N (DIN) from soils have also been shown to be important in regulating freshwater productivity (Nurnberg and Shaw, 1998). Further, climate change has been implicated as a key driver in the sustained rise of DOC in some temperate rivers observed over the last few decades (Freeman et al., 2004). It is common for arable land used for crop production to be rotated with grassland, either during periods of fallow land or when land is switched from crop production to animal production (Aslam et al., 1999). As roots colonise soil, C is lost to the soil from both cell sloughing at the root cap and from root exudation, which is thought to be most intense immediately behind the root cap (Nguyen, 2003). We hypothesised that soil solution C and N concentrations would differ over the period of grass sward establishment and that the temporal dynamics and final soil solution C and N concentrations would be influenced by increasing atmospheric CO2 and N inputs. Increased C (elevated pCO2) and N availability have been reported to alter factors, which would be expected to, in turn, affect soil solution chemistry. Elevated pCO2 and N have both been found to increase plant biomass (independently, and together), although the effect of elevated pCO2 has often been found to be most positive under high N availability (Daepp et al., 2000; Ko¨rner, 2000; Hill et al., 2004). Enrichment of both C and N has also been reported to alter plant C partitioning, but the effects act in opposite directions. Elevated pCO2 has frequently been linked to an increase in below-ground C allocation (Cotrufo and Gorissen, 1997; Suter et al., 2002), whereas N has been found to reduce C allocation to roots (Cotrufo and Gorissen, 1997; van Ginkel et al., 1997; Paterson and Sim, 1999; Kuzyakov et al., 2002). Elevated pCO2 has also been linked to altered patterns (generally decreased) of root exudation (Hodge et al., 1998; Hodge and Millard, 1998). Furthermore, both elevated pCO2 and N additions alter the plant tissue C-to-N ratio (increased by CO2 and decreased by N), which tends to alter the decomposability of plant residues (Gorissen et al., 1995; Heal et al., 1997; van Groenigen et al., 2005). These effects on plants would be expected to feedback on solution solute quantity or quality. However, currently there appears to be no conclusive link between elevated pCO2 or N addition and soil solution organic solute concentrations (Aandahl Raastad and Mulder, 1999; Hagedorn et al., 2002; Niklaus et al., 2003; Cheng et al., 2005). Our aim was to investigate the effects of elevated pCO2 and N enrichment on soil solution C and N dynamics over a 3-month period of sward establishment such as might be seen following the return of land previously used for crop production to grassland. Our second aim was to assess the interrelationships between key soil solution parameters to assess whether the treatments affected not just the quantity but also the quality of the dissolved organic substances. Our third aim was to assess the effect of elevated pCO2 and N addition on
1291
the concentration of plant-available forms of inorganic and organic N in soil solution. Plant biomass and gas-exchange results from this investigation have already been published in Hill et al. (2004). 2. Materials and methods 2.1. Plants and soil A Eutric Cambisol grassland soil was collected from a depth of 10–40 cm at the University of Wales Henfaes Experimental Station, Abergwyngregyn, Gwynedd (53814 0 N, 4801 0 W), sieved to pass 6 mm and thoroughly mixed. Sieved soil was packed to a bulk density of 1.4 g cmK3, into 16 10 cm diameter, 50 cm long, cylindrical UPVC tubes, and seeds of Lolium perenne L. cv. S23 were sown in the columns (0.5 g tubeK1). Eight tubes were placed in each of two climate-controlled cabinets (Sanyo-Gallenkamp, Fi-totron PG660/C/RO/HQI, Loughborough, UK), which were maintained at 20 8C and 70% relative humidity with a 16 h photoperiod (500 mmol photons mK2 sK1 PAR at canopy height). CO2 concentrations within the growth cabinets were either maintained at ambient (ca. 350 mmol molK1) or elevated (700 mmol molK1) concentrations. The CO2 concentrations in the cabinets were reversed twice weekly and soil tubes moved between and within cabinets to avoid bias. During germination, seeds were kept moist with daily, manual additions of deionised water. Once established (after 23 d), swards received a constant drip feed of either 888 mM potassium nitrate (CN; 12.4 mg N lK1) or potassium chloride (KN) at a rate of 150 ml tubeK1 dK1 for 3 months. The rate of N addition was equivalent to 70 kg N haK1 monthK1. In summary, there were four main treatments: ambient pCO2 KN, ambient pCO2 CN, elevated pCO2 KN, and elevated pCO2 CN. An additional treatment containing no plants was also included in which the irrigated soil columns were maintained at ambient pCO2 and without N addition. All treatments received the same amount of water (150 ml tube K1 dK1) and were performed in quadruplicate. 2.2. Soil solution sampling and analysis During the experiment, soil solution samples were taken every 2 weeks, beginning 10 d before the commencement of N treatments, using 5 cm long Rhizon soil moisture samplers (Rhizosphere Research Products, Wageningen, The Netherlands). The samplers were inserted into the soil through the side of the columns at depths of 5, 15, 25, 35 and 45 cm down the soil profile. Samples were analysed for dissolved organic C (DOC), total dissolved N using a Shimadzu TOC-V-TN analyser (Shimadzu Corp., Kyoto, Japan), and dissolved C C inorganic N (NOK 3 and NH4 ) using a Skalar SAN segmented-flow autoanalyser (Skalar, Brede, The Netherlands). Soil solution pH was measured using an Inlab 423 electrode (Mettler-Toledo, Schwerzenbach, Switzerland). Phenolic concentrations were assessed using Folin Ciocalteau reagent, calibrated with a phenol standard, according to Swain
1292
P.W. Hill et al. / Soil Biology & Biochemistry 38 (2006) 1290–1297
and Hillis (1959). Free amino acids were measured fluorometrically according to Jones et al. (2002). Soil solution colour was determined at 630 nm using a Versamax microplate reader (Molecular Devices Corp., Sunnyvale, CA). 2.3. Statistical analysis Analysis of the experimental results (ANOVA, t-test, linear and non-linear regression) was undertaken with SPSS v12.0 (SPSS Inc., Chicago, IL). 3. Results 3.1. Dynamics of DOC, DON, DIN and phenolics in soil solution At the first sampling (day 1) when the shoots of the seedlings were ca. 2 cm high but 10 d prior to the start of N treatments, soil solution DOC concentrations were highest in the top 5 cm of the soil profile in all treatments (P!0.0001; Fig. 1). DON concentration followed a similar pattern to DOC, however, in contrast the DIN concentration was highest in the lower portion of the soil profile (P!0.0001). All the
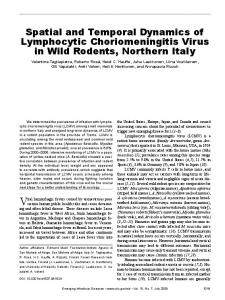
Fig. 1. Soil solution concentrations of dissolved organic C (DOC), organic N (DON), inorganic N (DIN) and the proportion of total soluble N (TSN) present as DON at different depths down the soil profile over the course of the experiment averaged across all CO2 and N treatments with plants. Values are meanGSEM; nZ16.
measurable DIN was present as NOK 3 . At the next sampling (day 14), the DOC concentration was 24% lower (PZ0.02) at the top of the profile than at day 1, but was 145% higher (P! 0.0001) than on day 1 at a depth of 15 cm. At this time the DOC concentration was highest (P%0.03) at 15 cm depth. Over the course of the experiment the point of highest DOC concentration moved progressively down the soil profile. This contrasted with the soil-free control, which did not show a progressive movement of the highest DOC concentration down the profile (data not shown). Following the large pulse in DOC, the concentrations of DOC in soil solution declined progressively in all treatments and at all depths to reach a quasi-stable concentration of 18G1 mg lK1 (meanG SEM; nZ78). In the plant-free control treatment the DOC concentrations were not significantly different between sampling events over the duration of the experiment (meanG SEM 20G2 mg lK1; nZ81). In comparison to the treatments with plants present, the DOC concentration was not significantly different from the mean final DOC concentration in the planted soil columns. Over the course of the experiment, DON concentrations dropped from a peak of 7 mg lK1 at 5 cm depth on day 1 to a mean concentration of 1.4 mg lK1 after 42 d and remained fairly stable at this value for the remainder of the experiment. At all but one sampling (day 14) the DON concentration followed the same pattern as DOC with which it was positively correlated (rZ0.772; P%0.001; Fig. 2). On day 14, DOC and DON were not significantly correlated. However, closer inspection of the data revealed that soil solution DOC and DON concentrations were significantly correlated at all depths other than at 35 and 45 cm where DOC concentration was highly variable. In contrast, DIN, when detectable, was negatively and linearly correlated with DOC (rZ0.787; P%0.01), although correlations tended to be poorer than with DON. Although a significant linear fit was possible, the relationship between DOC and DIN was best described by an exponential decay curve (rZ0.922; P!0.001), such that at low DOC concentrations DIN concentrations tended to be much higher than at high DOC concentrations (Fig. 2). No DIN was detected in the soil solution after day 28. The DIN concentration in the unplanted control treatment showed a decline in DIN over time, however, the decline was slower, did not show such an obvious reduction down the soil profile and did not decrease to the same concentration as the planted treatments. After 29 days when the mean NOK 3 concentration across all the plant treatments was 0.24G0.07 mg lK1 (meanGSEM; nZ69), the concentration in the plant-free control was over 50-fold higher at 12.6G 2 mg lK1 (meanGSEM; nZ16). After 42 d, the DIN concentration in the planted soil columns had remained below the limit of detection (0.1 mg N lK1) for 2 weeks, whereas the mean NOK 3 concentration in the unplanted controls was 1.3G0.2 mg lK1 (meanGSEM; nZ12). The proportion of total soluble N (TSN) accounted for by DON was very low at the start of the experiment (Fig. 1). However, starting from the top of the soil profile,
P.W. Hill et al. / Soil Biology & Biochemistry 38 (2006) 1290–1297
1293
acids in soil solution were low in all treatments and soil depths (!0.15 mg N mlK1) (data not presented). The concentration of humic substances in soil solution, as indicated by the measurement of phenolic substances, always correlated with DOC concentrations (rZ0.770; P%0.001; Fig. 2). This correlation occurred even on day 14, the one sampling time when DOC and DON were not wholly correlated. Soil solution pH was initially lower at the bottom of the soil profile than at the top (Fig. 3). Over the course of the experiment, the HC concentration for all treatments other than the ambient pCO2 CN treatment (see Section 3.2) dropped by 94% at the bottom of the profile. At the end of the experiment (day 91) soil solution HC concentration was unaffected by depth. 3.2. Effect of N and elevated pCO2 On day 1 when the only treatment applied was elevated pCO2, there was no significant effect on soil solution DOC concentration. On day 14 (Fig. 4), down to a depth of 25 cm DOC was slightly increased by N addition (P!0.01), but unaffected by elevated pCO2. Below this depth there was no significant difference in DOC concentration. On day 28, DOC remained higher in soil solution recovered from the N
Fig. 2. The relationship between soil solution dissolved organic C (DOC), organic N (DON), inorganic N (DIN) and phenolics. Data are for all sampling times except DON data, which excludes day 14 while DIN data is from day 1 to day 28. nZ556 for DON, nZ634 for DOC and nZ240 for DIN.
the proportion of TSN present as DON rapidly increased, such that after 28 d almost all of the soil solution N was present as DON, and after 42 d all the measurable soil solution N was present as DON. The final concentrations of total free amino
Fig. 3. Soil solution HC concentration at different depths down the soil profile over the course of the experiment for all treatments other than ambient pCO2 C N treatment. Values are meanGSEM; nZ12.
Fig. 4. Soil solution DOC concentration at different depths down the soil profile and in different treatments over the course of the experiment. The treatments included plants exposed to ambient (Amb.) and elevated (Elev.) CO2 and with (CN) and without (KN) inorganic nitrogen addition. The figure legend is the same for all panels. Values are meanGSEM; nZ4.
1294
P.W. Hill et al. / Soil Biology & Biochemistry 38 (2006) 1290–1297
treatments than in those without N (P!0.0001), however, DOC concentrations were slightly lower down to 35 cm depth under elevated pCO2 in comparison to those under ambient pCO2 (P!0.0001). At the lowest depth (45 cm) there was no significant effect of treatment. On day 42, the same effects of treatment as previously seen higher up in the profile became manifest at all profile depths (P!0.0001 for N; P!0.05 for elevated pCO2). This pattern remained the same until day 70, when a significant effect of elevated pCO2 was not seen. An effect of elevated pCO2 (P!0.0001) was again seen on day 84, but in this case the effect was different. It had no effect in the absence of N additions, but interacted with N to reduce the DOC concentration in the elevated pCO2 CN treatment relative to all the others. On day 91 only a much reduced effect of N addition on DOC could be seen (P!0.05), while elevated pCO2 had no significant effect at any depth. It can be seen that the effects of treatment on soil solution DOC concentration were greatest at the top of the soil profile early in the experiment (Fig. 4). Later in the experiment, treatment effects were stronger at the bottom of the profile, before diminishing at all depths at the end of the experiment. This approximated to the movement of the peak DOC, DON and phenolic concentrations down the soil profile in all treatments (Fig. 1). Soil solution DON concentrations were influenced by elevated pCO2 from day 1 to day 84 (P!0.05), with the exception of day 42. Although treatment effects showed some variability, the general trend was for elevated pCO2 to reduce the soil solution DON concentration relative to ambient pCO2 treatments, especially in the presence of added N. The addition of N to the soil columns significantly affected the soil solution DON concentration from day 28 to day 84 (P!0.05), with the exception of day 70. In contrast to elevated pCO2, N additions tended to increase the soil solution DON concentrations relative to the treatments without added N. On the final day of sampling (day 91) soil solution DON concentrations were unaffected by either N addition or elevated pCO2. Soil solution free amino acid concentrations were still slightly increased by N at the end of the experiment (P!0.03), but as with most other measured organic solutes, the difference was no longer present at the top of the soil profile and increased towards the bottom. The effect of treatment on the amount of phenolic substances in soil solution generally closely followed those of DOC concentration, such that the quality of the DOC as illustrated by the ratio of phenolics to DOC was never significantly influenced by either elevated pCO2 or N addition. However, at the final sampling (day 91) both N and elevated pCO2 still influenced soil solution concentrations. Elevated pCO2 still influenced the soil solution phenolic content (PZ 0.07 for elevated pCO2; P!0.0001 for N), such that the effect of N, which increased phenolic content at most depths, was reduced in comparison to ambient pCO2 (Fig. 5). However, the magnitude of treatment effects was insufficient to influence the ratio of DOC to phenolics. Over the course of the experiment there was a weak tendency for the soil solution to have a lower HC concentration
Fig. 5. Soil solution phenolic concentrations in different treatments and depths down the soil profile at the end of the experiment (day 91). The treatments included plants exposed to ambient (Amb.) and elevated (Elev.) CO2 and with (CN) and without (KN) inorganic nitrogen addition. Values are meanGSEM; nZ4.
(higher pH) in treatments receiving N than in those without added N. However, only in the ambient pCO2 CN treatment was the pH greatly different. Until day 42 there was no significant effect of N on soil solution pH (PO0.05). On day 42 the HC concentration in the ambient pCO2 CN treatment was 90% lower than in other treatments (P!0.0001), which were not significantly different from each other. At the end of the experiment the ambient pCO2 CN soil solution HC concentration was still 75% lower than other treatments (P!0.0001). The only effect of elevated pCO2 was to maintain the soil solution HC concentration in the elevated pCO2 CN treatment above that in the ambient pCO2 CN treatment, but at the same concentration as in all the other treatments. 3.3. Previously published plant biomass results The final shoot biomass values were 5.2G0.1, 8.8G0.2, 4.6G0.2 and 10.3G10.3 g tubeK1 for ambient pCO2 KN, ambient pCO2 CN, elevated pCO2 KN and elevated pCO2 CN, respectively. In the same treatment order, root biomass values were 5.2G0.1, 8.8G0.7, 4.7G0.3 and 8.6G 0.5 g tubeK1, respectively. All values are meanGSEM (nZ4; Hill et al., 2004). 4. Discussion 4.1. Dynamics of soil solution C and N across all treatments Our study clearly shows that the presence of germinating plants significantly affects the concentrations of soluble N and organic C in soil. The observation that a pulse of DOC, DON and phenolics moved down the profile during the period of sward establishment suggests that the growth of plant roots down the profile temporarily increased the concentrations of solutes, after which concentrations declined again to background levels. This is supported by the fact that DOC and DON concentrations in the plant-free control did not show the same
P.W. Hill et al. / Soil Biology & Biochemistry 38 (2006) 1290–1297
pattern. The rate of movement of the organic solute pulse down the profile was very much slower than could simply be explained by passage in the column irrigation water and is also consistent with a known rate of L. perenne root growth between 1 and 2 cm dK1 (data not presented). This concentrated pulse of organic solutes moving down the profile therefore cannot easily be explained without assuming that the temporal changes were due to the influence of plant roots. In the absence of plant roots there would be no source of C input to raise soil solution concentrations other than soil organic matter. Increased mineralisation of soil organic matter due to the addition of irrigation water would also be unlikely since the soil was already at field capacity prior to the start of measurements. The near constant ratio of DOC-to-DON and DOC-tophenolics over the course of the experiment suggests that the C being measured at the peaks of DOC concentration was of a similar quality, and thus origin, as that in the root-free soil. Inputs to the soil solution pool from root exudation might be greater close to root tips (Nguyen, 2003), but would likely be dominated by relatively labile C compounds with low phenolic content (e.g. sugars, amino acids and organic acids; Farrar et al., 2003; Jones et al., 2004), which are generally only found in very low concentrations in soil due to rapid microbial breakdown (Jones et al., 2004). Thus, generally, soil solution C would most likely have a higher content of humified material (higher phenolic to DOC ratio) than C exuded from plant roots. It therefore seems likely that the origin of the increased DOC concentrations in the soil solution during sward development was from the solubilisation of soil organic matter (SOM). We hypothesize that this increase in DOC, DON and phenolics in the soil solution was due, not to a direct input of root-derived C, but rather due to accelerated breakdown of SOM by rhizosphere priming (Kuzyakov, 2002; Hamer and Marschner, 2005). The stability of soil solution DOC-to-DON and DOC-tophenolics ratios irrespective of plant growth stage or treatment, further suggests that these three solutes all had the same origin in the soil solution. We speculate that neither elevated pCO2 nor N addition ultimately had any measurable effect on the quality of soluble soil organic matter, and increases in DON or phenolics merely tracked the effect of plants on DOC. This occurred despite the significant effect of elevated pCO2 on plant tissue C-to-N ratio and primary production (Hill et al., 2004). The decrease in soil solution DIN down the soil profile over time, which proved to be much more marked, and faster, than in the plant-free control shows the efficiency with which plant roots are able to extract DIN from the soil solution. It was striking that the plants were able to almost totally remove DIN from the soil despite large inorganic N additions to two of the treatments, while DIN in the plant-free treatment remained at ca. 1.4 mg lK1 after 42 d of leaching. Furthermore, the leaching intensity in the control was probably much greater due to the loss of water from the soil by transpiration in treatments with plants. The drop in DOC and DON concentrations after the pulse occurring during sward
1295
establishment was probably due to either or both of two processes: (1) uptake of soluble organic material by plants following root proliferation (Jones et al., 2004, 2005); (2) establishment of a larger or more active microbial community, which was not present in the soil prior to sward growth (Lu et al., 2004). The observation that the soil solution solute concentrations appeared to diminish in magnitude from the top of the profile downwards over time also suggests that the microbial biomass or activity increased to biodegrade the available substrates. This is supported by the fact that at the end of the experiment elevated pCO2 was able to increase the specific root-dependent respiration rate (respiration per gram root weight derived from recent plant C) without influencing soil solution DOC concentration (Hill et al., 2004). The increase in soil solution pH down the soil profile and over the course of the experiment can also be explained by the presence of plant roots. The rise in pH probably resulted from the consumption of HC during plant (or microbial) NOK 3 assimilation (Raven et al., 1992; Yin and Raven, 1997). Although not all plants received KNO3, those not receiving added N would also have assimilated considerable quantities of NOK 3 from nitrification in the soil as nitrification is known to be rapid (Jones et al., 2004). The differences in NOK 3 availability may explain the tendency for pH to be higher in the treatments receiving added N. 4.2. Effects of elevated pCO2 and N It is easy to hypothesize that increases in root biomass due to fertilisation by N or CO2 would lead to increased concentrations of organic solutes in soil. However, it is less easy to explain why elevated pCO2 might reduce the effect of the N treatment during the latter part of the experiment. We can suggest, but by no means prove, that the decrease in the effect of N in the presence of elevated pCO2 might be due to a more active microbial biomass established due to increased root biomass (van Ginkel et al., 2000; Suter et al., 2002) or increased rhizodeposition in the presence of elevated pCO2 (Paterson et al., 1996; Pendall et al., 2004). However, total root biomass was not increased by CO2 at the end of the experiment (Hill et al., 2004) and, despite reported priming enhancement under elevated pCO2 (Hoosbeek et al., 2004; Xie et al., 2005), the effect of elevated pCO2 on rhizodeposition remains uncertain (Hodge and Millard, 1998; Paterson et al., 1999; Nguyen, 2003). The concentrations in the ambient pCO2 CN treatment might ultimately have fallen to the same value as the elevated pCO2 CN treatment if elevated pCO2 only increased the rate of development of the rhizosphere microbial community. It is also possible that the higher organic solute concentrations, particularly phenolics, in the ambient CO2 CN treatment as compared with elevated CO2 CN were due to the combined effects of high CO2 and inorganic N additions on soil enzyme activity. Inorganic N has been found to reduce phenol oxidase activity and might thus lead to slower breakdown of phenolic compounds in the soil (Matocha et al., 2004). Consequently, reduced phenol oxidase activity may retard the breakdown of other organic solutes due to inhibition of other
1296
P.W. Hill et al. / Soil Biology & Biochemistry 38 (2006) 1290–1297
soil enzymes by phenolics (Freeman et al., 2001). In contrast, elevated CO2 might increase phenol oxidase activity if priming occurred (Hoosbeek et al., 2004; Xie et al., 2005), leading to a reduction in the effect of N, although this is far from clear at this time and warrants further attention. Another alternative, or possibly additional, explanation is that the only treatment to have altered soil water content was the ambient pCO2 CN treatment, which was significantly drier (ca. 17%) than other treatments (Hill et al., 2004). The elevated pCO2 CN treatment remained wetter due to the well-established increase in plant water use efficiency during growth at elevated pCO2 (Ko¨rner, 2000; Hui et al., 2001). Indeed at some points in the experiment solute concentrations and pH in the ambient pCO2 CN treatment were very different from all the other treatments (Fig. 4). This increase in the solute concentration may have been purely due to reduced dilution as, if water content is taken into account, the mean total DOC per tube was actually lowest in the ambient pCO2 CN treatment. Given that the magnitude of the difference between the treatments diminished towards the end of the experiment we suggest that ultimately the microbial community would develop to reduce organic solute concentrations in the ambient pCO2 CN treatment to the concentrations in other treatments unless the soil became very dry. This would explain why at the end of the experiment any effect of N on the DOC concentration had all but disappeared at the top of the soil profile where root proliferation was greatest. It would also explain why effects of N and elevated pCO2 on soil solution DOC concentrations have not been found in other longer-established plant–soil systems (Aandahl Raastad and Mulder, 1999; Hagedorn et al., 2002; Niklaus et al., 2003). DOC concentration has been reported to be reduced by high ionic strength and low pH in peat soils (Clark et al., 2005). Given that the fact that the HC concentration in the ambient pCO2 CN treatment was up to 90% lower than in the other treatments, this was obviously not the cause of the increased DOC concentration in the ambient pCO2 CN treatment as the effect was the reverse of what would be expected. The notable difference in pH between the ambient and elevated pCO2 CN treatments may have been influenced by possible acidification of the soil during plant growth at elevated pCO2 (Oh and Richter, 2004), but given the lack of a pH effect in the absence of N, was probably connected to the reduction in soil water content in the ambient pCO2 CN treatment. Thus, the most striking effects of N and/or elevated pCO2 appear not to have been due to direct effects of N or CO2 on plant or soil solution chemistry. Instead they probably resulted from N addition increasing plant biomass, and thus water use, combined with the greater water use efficiency of plants grown in elevated pCO2. 4.3. Conclusions Our experiments indicate that during grass sward establishment, root proliferation into the soil increased soil solution pH and temporarily increased the concentration of organic solutes in the soil solution. Once roots and rhizosphere were established solute concentrations (other than DIN) dropped to
stable values, close to those in the bulk soil at all depths. From the parameters measured here it is apparent that the gross quality of the DOC was not influenced by time, depth or any treatment. Further, we hypothesize that the transient increase in organic solutes is probably derived from rhizosphere priming of SOM mineralisation rather than from direct plant inputs. Subsequent decreases in solute concentrations and decreases in the effect of treatments are most likely due to the development of the rhizosphere microbial biomass, which subsequently removes the DOC from solution. The most significant effect of elevated pCO2 and N addition on soil solution solute concentrations appeared to result, not from direct effects of the treatment on soil solution chemistry, but from the positive effect of N and the negative effect of CO2 on water use. Acknowledgements We thank the Natural Environment Research Council for funding this research. References Aandahl Raastad, I., Mulder, J., 1999. Dissolved organic matter (DOM) in acid forest soils at Gardsjon (Sweden): natural variabilities and effects of increased input of nitrogen and of reversal of acidification. Water, Air and Soil Pollution 114, 199–219. Ainsworth, E.A., Davey, P.A., Hymus, G.J., Osborne, C.P., Rogers, A., Blum, H., No¨sberger, J., Long, S.P., 2003. Is stimulation of leaf photosynthesis by elevated carbon dioxide concentration maintained in the long term? A test with Lolium perenne grown for 10 years at two nitrogen fertilization levels under Free Air CO2 Enrichment (FACE). Plant, Cell & Environment 26, 705–714. Aslam, T., Choudhary, M.A., Saggar, S., 1999. Tillage impacts on soil microbial biomass C, N and P, earthworms and agronomy after two years of cropping following permanent pasture in New Zealand. Soil and Tillage Research 51, 103–111. Cheng, W., Yagi, K., Sakai, H., Xu, H., Kobayashi, K., 2005. Changes in concentration and d13C value of dissolved CH4, CO2 and organic carbon in rice paddies under ambient and elevated concentrations of atmospheric CO2. Organic Geochemistry 36, 813–823. Clark, J.M., Chapman, P.J., Adamson, J.K., Lane, S.N., 2005. Influence of drought-induced acidification on the mobility of dissolved organic carbon in peat soils. Global Change Biology 11, 791–809. Cotrufo, M.F., Gorissen, A., 1997. Elevated CO2 enhances below-ground allocation in three perennial grass species at different levels of N availability. New Phytologist 137, 421–431. Daepp, M., Suter, D., Almeida, P.F., Isopp, H., Hartwig, U.A., Frehner, M., Blum, H., No¨seberger, J., Lu¨scher, A., 2000. Yield response of Lolium perenne swards to free air CO2 enrichment increased over six years in a high N input system on fertile soil. Global Change Biology 6, 805–816. Farrar, J., Hawes, M., Jones, D., Lindow, S., 2003. How roots control the flux of carbon to the rhizosphere. Ecology 84, 827–833. Freeman, C., Ostle, N., Kang, H., 2001. An enzymatic latch on a global carbon store. Nature 409, 149. Freeman, C., Fenner, N., Ostle, N.J., Kang, H., Dowrick, D.J., Reynolds, B., Lock, M.A., Sleep, D., Hughes, S., Hudson, J., 2004. Export of dissolved organic carbon from peatlands under elevated carbon dioxide levels. Nature 430, 195–198. Gorissen, A., van Ginkel, J.H., Keurenjes, J.J.B., van Veen, J.A., 1995. Grass root decomposition is retarded when grass has been grown under elevated CO2. Soil Biology & Biochemistry 27, 117–120.
P.W. Hill et al. / Soil Biology & Biochemistry 38 (2006) 1290–1297 Hagedorn, F., Blaser, P., Siegwolf, R., 2002. Elevated atmospheric CO2 and increased N deposition effects on dissolved organic carbon-clues from d13C signature. Soil Biology & Biochemistry 34, 355–366. Hamer, U., Marschner, B., 2005. Priming effects in different soil types induced by fructose, alanine, oxalic acid and catechol additions. Soil Biology & Biochemistry 37, 445–454. Heal, O.W., Anderson, J.M., Swift, M.J., 1997. Plant litter quality and decomposition: an historical overview. In: Cadisch, G., Giller, K.E. (Eds.), Driven by Nature, Plant Litter Quality and Decomposition. CAB International, Wallingford, pp. 3–32. Hill, P.W., Marshall, C.M., Harmens, H., Jones, D.L., Farrar, J.F., 2004. Carbon sequestration: do N inputs and elevated atmospheric CO2 alter soil solution chemistry and respiratory C losses? Water, Air and Soil Pollution: Focus 4, 177–186. Hodge, A., Millard, P., 1998. Effect of elevated CO2 on carbon partitioning and exudate release from Plantago lanceolata seedlings. Physiologia Plantarum 103, 280–286. Hodge, A., Paterson, E., Grayston, S.J., Campbell, D., Ord, B.G., Killham, K., 1998. Characterisation and microbial utilisation of exudates material from the rhizosphere of Lolium perenne grown under CO2 enrichment. Soil Biology & Biochemistry 30, 1033–1043. Hoosbeek, M.R., Lukac, M., van Dam, D., Godbold, D.L., Velthorst, E.J., Biondi, F.A., Peressotti, A., Cotrufo, M.F., de Angelis, P., ScarasciaMugnozza, G., 2004. More new carbon in the mineral soil of a poplar plantation under Free Air Carbon Enrichment (POPFACE): cause of increased priming effect? Global Biogeochemical Cycles 18, GB1040. Hui, D.F., Luo, Y.Q., Cheng, W.X., Coleman, J.S., Johnson, D.W., Sims, D.A., 2001. Canopy radiation- and water-use efficiencies as affected by elevated [CO2]. Global Change Biology 7, 75–91. Jones, D.L., Owen, A.G., Farrar, J.F., 2002. Simple method to enable the high resolution determination of total free amino acids in soil solutions and soil extracts. Soil Biology & Biochemistry 34, 1893–1902. Jones, D.L., Hodge, A., Kuzyakov, Y., 2004. Plant and mycorrhizal regulation of rhizodeposition. New Phytologist 163, 459–480. Jones, D.L., Healey, J.R., Willett, V.B., Farrar, J.F., Hodge, A., 2005. Dissolved organic nitrogen uptake by plants—an important N uptake pathway? Soil Biology & Biochemistry 37, 413–423. Ko¨rner, C., 2000. Biosphere responses to CO2 enrichment. Ecological Applications 10, 1590–1619. Kuzyakov, Y., 2002. Review: factors affecting rhizosphere priming effects. Journal of Plant Nutrition and Soil Science 165, 382–396. Kuzyakov, Y., Biryukova, O.V., Kuznetzova, T.V., Mo¨lter, K., Kandeler, E., Stahr, K., 2002. Carbon partitioning in plant and soil, carbon dioxide fluxes and enzyme activities as affected by cutting ryegrass. Biology and Fertility of Soils 35, 348–358. Lu, Y., Murase, J., Watanabe, A., Sugimoto, A., Kimura, M., 2004. Linking microbial community dynamics to rhizosphere carbon flow in a wetland rice soil. FEMS Microbiology Ecology 48, 179–186. Matocha, C.J., Haszler, G.R., Grove, J.H., 2004. Nitrogen fertilization suppresses soil phenol oxidase enzyme activity in no-tillage systems. Soil Science 169, 708–714. Nguyen, C., 2003. Rhizodeposition of organic C by plants: mechanisms and controls. Agronomie 23, 375–396. Niklaus, P.A., Alphei, J., Ebersberger, D., Kampichler, C., Kandeler, E., Tscherko, D., 2003. Six years of in situ CO2 enrichment evoke changes in soil structure and soil biota of nutrient-poor grassland. Global Change Biology 9, 585–600.
1297
Nowak, R., Ellsworth, D.S., Smith, S.D., 2004. Functional responses of plants to elevated atmospheric CO2-do photosynthetic and productivity data from FACE experiments support early predictions? New Phytologist 162, 253–280. Nurnberg, G.K., Shaw, M., 1998. Productivity of clear and humic lakes: nutrients, phytoplankton, bacteria. Hydrobiologia 382, 97–112. Oh, N.H., Richter, D.D., 2004. Soil acidification induced by elevated atmospheric CO2. Global Change Biology 10, 1936–1946. Paterson, E., Sim, A., 1999. Rhizodeposition and C-partitioning of Lolium perenne in axenic culture affected by nitrogen supply and defoliation. Plant and Soil 216, 155–164. Paterson, E., Rattray, E.A.S., Killham, K., 1996. Effect of elevated atmospheric CO2 concentration on C-partitioning and rhizosphere C-flow for three plant species. Soil Biology & Biochemistry 28, 195–201. Paterson, E., Hodge, A., Thornton, B., Millard, P., Killham, K., 1999. Carbon partitioning and rhizosphere C-flow in Lolium perenne as affected by CO2 concentration, irradiance and below-ground conditions. Global Change Biology 5, 669–678. Pendall, E., Mosier, A.R., Morgan, J.A., 2004. Rhizodeposition stimulated by elevated CO2 in a semiarid grassland. New Phytologist 162, 447–458. Raven, J.A., Wollenweber, B., Handley, L.L., 1992. A comparison of ammonium and nitrate as nitrogen sources for photolithotrophs. New Phytologist 121, 19–32. Suter, D., Frehner, M., Fischer, B.U., No¨sberger, J., Lu¨scher, A., 2002. Elevated CO2 increases carbon allocation to the roots of Lolium perenne under free-air CO2 enrichment but not in a controlled environment. New Phytologist 154, 65–75. Swain, T., Hillis, W.E., 1959. The phenolic content of Prunus domestica. Journal of the Science of Food and Agriculture 10, 63–68. van Ginkel, J.H., Gorissen, A., van Veen, J.A., 1997. Carbon and nitrogen allocation in Lolium perenne in response to elevated atmospheric CO2 with emphasis on soil carbon dynamics. Plant and Soil 188, 299–308. van Ginkel, J.H., Gorissen, A., Polci, D., 2000. Elevated atmospheric carbon dioxide concentration: effects of increased carbon input in a Lolium perenne soil on microorganisms and decomposition. Soil Biology & Biochemistry 32, 449–456. van Groenigen, K.-J., Gorissen, A., Six, J., Harris, D., Kuikman, P.J., van Groenigen, J.W., van Kessel, C., 2005. Decomposition of 14C-labeled roots in a pasture soil exposed to 10 years of elevated CO2. Soil Biology & Biochemistry 37, 497–506. van Hees, P.A.W., Jones, D.L., Finlay, R., Godbold, D.L., Lundstro¨m, U.S., 2005. The carbon we do not see—the impact of low molecular weight compounds on carbon dynamics and respiration in forest soils: a review. Soil Biology & Biochemistry 37, 1–13. Vitousek, P.M., Aber, J.D., Howarth, R.W., Likens, G.E., Matson, P.A., Schindler, D.W., Schlesinger, W.H., Tilman, D.G., 1997. Human alteration of the global nitrogen cycle: sources and consequences. Ecological Applications 7, 737–750. Xie, Z., Cadisch, G., Edwards, G., Baggs, E.M., Blum, H., 2005. Carbon dynamics in a temperate grassland soil after 9 years exposure to elevated CO2 (Swiss FACE). Soil Biology & Biochemistry 37, 1387– 1395. Yin, Z.H., Raven, J.A., 1997. A comparison of the impacts of various nitrogen sources on acid-base balance in C3 Triticum aestivum L. and C4 Zea mays L. plants. Journal of Experimental Botany 48, 315–324.