points bear significant importance regarding the efficiency of sensor networks. One is the lifetime of sensor networks and the other is the rage of coverage for such .... heads reduces the size of the message transfered to the Base Station, thus saving energy. ..... turning the node into one of the two modes of Sleep or Awake.
Chemical and Process Engineering 2014, 36 (2), 714-731 Special Issue
THE APPLICATION OF K-MEANS CLUSTERING ALGORITHM IN OPTIMIZATION OF ENERGY CONSUMPTION IN WIRELESS SENSOR NETWORKS Amin Ebrahimi Gandomani*, Farshad Kiyoumarsi, Siavash Mahmoudy Department of Computer, Isfahan Science and Research branch, Islamic Azad University, Isfahan, Iran Department of Computer, Shahrekord Branch, Islamic Azad University, Iran Department of Computer, Isfahan Science and Research branch, Islamic Azad University, Isfahan, Iran Abstract. A wireless sensor network is composed of a large number of small units called sensor nodes. Sensor nodes are generally equipped with sensor, processing, and communicative capabilities. The major duty of sensor nodes is collection of data at regular intervals, conversion of such data into electronic signals, and transmission of the signals into a sink node or Base Station. The most important reason for the emergence and development of wireless sensor networks is constant monitoring of the applications related to the environments where permanent access and presence of human beings is difficult or impossible. Consequently, dead nodes (i.e. nodes that have lost their efficiency due to the ending of energy resources) are impossible to re-charge or replace. Thus, two points bear significant importance regarding the efficiency of sensor networks. One is the lifetime of sensor networks and the other is the rage of coverage for such networks. The solution put forward to cope with such challanges is reducing the rate of energy consumption in sensor nodes, while at the same time keeping energy consumption in network nodes steady. In this study, two approaches (i.e., the data aggragation approach and the duty cycling approach) have been adopted to achive this goal. Following the data aggregation approach, the k-means hiararchical clusterning method is used to organize sensor nodes in such a way as to substantially reduce the degree of sending individual data to the central station, thereby reducing energy consumption in sensor nodes. In addition to the above-mentioned clustering method, a new parameter has been defined as the criterion of the similarity of the area covered for each node. Accordingly, the number of sensor nodes which are estimated to cover a common area, will be clustered evenly and thus, only one node in evenly distibuted sets will remain active at a time. In the end,
*
Corresponding author
714
The application of k-means clustering algorithm in optimization of energy consumption in …
through NS2 simulation software, the degree of efficiency of the proposed approach will be investigated into the following accepted methods. Keywords: wireless sensor networks, clustering, optimization, K-means, NS2, LEACH, WEEC 1. INTRODUCTION A wireless sensor network is a particular type of Ad Hoc Network which encompasses a set of small nodes capable of sensing their surrounding environment with a certain goal of data processing, storage, and exchange with other nodes and also adaptable to changes (such as topology). All the nodes in this network are typically the same and they practically meet the general goal of the network, working in tandem. The main goal in the design of wireless sensor networks is increasing monitoring and controling climate change and weather conditions, physical and chemical changes in the environment within a certain limited scope(Akyildiz, Su et al. 2002, Stojcev 2007). 1.1. Reducing Energy Consumption in Sensor Networks With the emergence and evolution of the micro-electronic technology in 1970's, new sensors became the focus of attention. Cheaper, smaller-size, and lighter sensors have been produced, using the micro-electronic technology. New materials for the production of sensors were identified and discovered, after which new principles for the practical goal of data collection were introduced. The integration of sensors with electronic circuits transforming signals has created significant opportunities for the development of a wide range of applications available now. Today, reducing the size and weight of sensors and increasing their sensitivity level is the main goal of many research laboratories and various companies. However, reducing the size of sensors meant that smaller-size energy-producing batteries had to be produced(Misra, Dolui et al. 2005, Abbasi and Younis 2007). The most important reason for the emergence and development of wireless sensor networks was the creation of applications constantly monitoring environments where permanent human access and presence is difficult or impossible, such as monitoring erupting volcanoes, active surveillance of border areas, bridges, dams and roads, and monitoring battlefields or sensitive strategic military areas, etc. Therefore, recharging or replacement of dead nodes (i.e. nodes that have lost their functionality due to the ending of energy resources) is practically impossible, because, as mentioned, these nodes are typically located in environments under severe conditions that are rough and hard to access often randomly scattered in the environment affected by prevailing circumstances. Thus, two factors are considered important in the efficiency of sensor networks: one is their lifetime and the other is the range of coverage for such networks. Since monitoring applications is an essentially time-consuming task, sensor networks are expected to have lifetime which is long enough. However, if the entire network space is divided into virtual areas, several sensor nodes are typically located in each area. Therefore, in case some of the nodes in one area die, other nodes can maintain network coverage to a certain degree. Nevertheless, if all the nodes located in one area die, the area in question becomes practically impossible to monitor 715
Amin Ebrahimi Gandomani, Farshad Kiyoumarsi, Chem. Process Eng., 2014, 36 (2, Special), 714-731
and the so-called network coverage disappears in that area. Thus, if sensor nodes die in a random unpredictable manner, it would be less destructive than the accumulation of dead nodes in one area. Hence, the solution that comes to the mind for the achievement of the two goals stated above (i.e. increasing life-time and maintaining network coverage in sensor networks), is reducing the amount of energy consumption in nodes, while simultaneously keeping energy consumption steady all across the nodes available in the network(Enami, Moghadam et al. 2010). Regarding the reasons mentioned above, the main objective of sensor networks is wise, rational management of energy resources. 1.2. Clustering in Wireless Sensor Networks (WSNs) In most applications of WSNs, the network must be completely capable of managing a large environments automatically. Due to this critical expectation, in many of the important applications of WSNs, sensor nodes are distributed randomly by relatively uncontrollable objects in the target area (for example, bombardings carried out by a helicopter), and form an Ad Hoc Network. In addition to this, regarding the fact that the area needs to be covered, and taking the limited energy of sensor batteries, and the possiblitity of damage to the nodes while they are being scattered, an enormous number of nodes are expected to exist. Hence, naturally such networks are likely to include hundreds or even thousands of nodes. Nevertheless, the amount of energy each node can hold in such networks is limited and another limitation is that they can not be recharged. Thus, it is obvious that the quality of energy-based routing protocols and data collection in such large-scale networks needs to be so high that the network life-time can be reasonably maintained. Grouping nodes into clusters has been widely accepted by the research community with the aimed of achieving the goal of scalability in general and gaining access to higher rates of energy efficiency and life-time in WSN environments in particular. Hierarchical routing protocols and data collection refer to an organization of data based on sensor clustering in such a way that combination and aggregation of data is made possible, leading to a significant saving of energy. In the hierarchical structure of the network, each cluster has a leader called Cluster Head (CH), which typically performs specific actions (such as combining and aggregating data). Also there are a number of Simple Nodes (SN) in each cluster that are considered as the members of that cluster. The process of cluster formation is a two-level hierarchy, the higher level of which is composed of Cluster Head (CH) nodes and whose lower level includes sensors that form members of the cluster. Sensor nodes regularly send their data to their cluster heads. CH nodes collect data (thus, reducing the number of retransmitting packets) and send them to the Base Station (BS). Transmission of data to BS can be acheived directly or indirectly in the form of creation of an interface with other CHs. Due to the fact that CH nodes transmit data over longer distances at any time (compared to Simple Nodes), the rate of energy consumption is higher in them. A common solution aimed at creating balance in energy consumption among the nodes of a netwok is that the CHs in a cluster be regularly selected again (in which case, the function of a CH will alternately be replaced across all the nodes over time). Figure 1 represents a typical example of the concept of data communication in cluster networks (given single-phase intra-cluster and multi-phase intercluster communication of data). The Base Station (BS) is where data transmitted by sensor nodes are processed and also where data will be accessed to by the end user. The BS is frequently 716
The application of k-means clustering algorithm in optimization of energy consumption in …
established and designed at a fixed location often set in a long distance from sensor nodes. CH nodes, in fact, act as gates between the BS and the sensor nodes. As mentioned above, each CH performs simple functions common to all the nodes within a cluster (including aggregation of the data before transmitting them to the BS). In other words, each CH serves as a sink for the cluster nodes, and the BS in turn acts as a sink for CHs. Besides, the structure formed between and among sensor nodes, CHs, and the BS can be repeated any number of times required and create multiple layers in a hierarchical WSN (i.e., a multi-level clustering hierarchy)(Dehni, Krief et al. 2006, Goldsmith and Wicker 2006, Sasikumar and Khara 2012).
Fig. 1. data transmission in clustered networks 2. BACKGROUND OF THE STUDY Adopting the clustering approach, an overview of two well-known protocols defined aimed at the reduction of energy consumption in Wireless Sensor Networks, that is the Low Energy Adaptive Clustering Hierarchy protocol (LEACH) and the Weighted Energy Efficient Clustering protocol (WEEC), is presented in this section. 2.1. The LEACH protocol The Low Energy Adaptive Clustering Protocol (LEACH) is the first and most well-known clustering-based protocol used in wireless sensor networks where clusters are created in a distributed manner. The main purpose of LEACH is the creation of local Base Stations (or, cluster heads) in order to reduce energy consumption caused by the transmission of data to a Base Station located at a far and remote distance. LEACH randomly selects a few sensor nodes as cluster heads (CHs) and organizes local nodes in the form of local clusters. The association of nodes to a particular Cluster Head is carried out relative to the proximity (distance) of a certain node to its Cluster head. Non-clustering nodes (also called Simple Nodes) transmit their data to cluster heads. Thus, the only constraint for them is intra-cluster communication (data transmission within the cluster). Cluster Head nodes require higher levels of energy compared to Simple Nodes. Therefore, the selection of fixed Cluster Head nodes leads to early depletion of energy and thus early death of such nodes. Energy balance is established in cluster heads with alternate shifts in the function of cluster head across various nodes. Moreover, using data aggregation/combination at cluster heads reduces the size of the message transfered to the Base Station, thus saving energy. The function of LEACH is divided into several rounds. Each round begins with the establishment phase (cluster formation) in which the clusters are organized . The initial establishment phase is followed by the data transfer phase in which Simple Nodes send their data to Cluster Heads, and after 717
Amin Ebrahimi Gandomani, Farshad Kiyoumarsi, Chem. Process Eng., 2014, 36 (2, Special), 714-731
aggregation/combination of data, the cluster heads transfer the aggregated packet to the Base Station to reduce the amount of data transmitted to the Base Station . In LEACH, the scheduling of sensor data transmission is executed through Code Division Multiple Access (CDMA) and Time Division Multiple Access (TDMA). Cluster heads are selected by a probability function. Each node selects a random number between zero and one; if the selected number is less than T(n) , the node is selected as the current round cluster head: (1) P 1 T (n) 1 P r mod P 0
if n G
otherwise
In the current function, P represents the probability of becoming a cluster head, r represents the number of nodes in the current round, and G represents the set of rounds that have not been selected as cluster heads in the current 1/p round. According to the simulation model, it has been proven that only five percent of the total number of nodes need to turn into cluster heads. The strength of the LEACH protocol is the cycling mechanism of cluster heads and data aggregation which is capable of increasing the life-time of the network, but this protocol also suffers from a number of shortcomings. One such shortcoming is that this protocol assumes that all the notes within a network are adequately capable of transmitting data to the Base Station and are of adequate computational power to support MAC protocols. Therefore, they are not applicable to large-scale networks. Another shortcoming is that this protocol assumes that nodes always have data to send, and that nodes that are close to each other contain data which are dependent on one another. Moreover, this protocol assumes that all the nodes in each round of selection start with an equal amount of energy capacity, with the assumption that each cluster head consumes approximately the same amount of energy as other nodes. The main shortcoming of LEACH, however, is that it is not clear how the predetermined number of cluster heads (i.e., P) is supposed to be evenly distributed over the network. In fact, in this protocol there is no guarantee that the location or number of cluster heads in each round will remain the same. Thus, it is highly possible that the selected cluster heads be concentrated merely in one part of the network(Heinzelman, Chandrakasan et al. 2000, Yick, Mukherjee et al. 2008). 2.2. The WEEC protocol This protocol is established on the basis of LEACH protocol and it pursues two major goals: increasing the life-time of networks and flexibility of the position of a Base Station(Behboudi and Abhari 2011). The first goal can be achieved through consideration of the distance between each node and the Base Station, while the clusters are being formed. A particular amount of energy is wasted to transfer a certain amount of data in the form of a function defined by a certain threshold distance, increasing flexibility at the Base Station. This protocol cosiders two general situations, each of which is described below. The algorithm WEEC considers a square area (S = M × M) where N nodes are distributed. The LEACH protocol guarantees that all nodes are head clustered 718
The application of k-means clustering algorithm in optimization of energy consumption in …
at least once in each round. Furthermore, this protocol employs the indicator function (Ci (t)) to determine whether a particular node has been head clustered in the previous rounds. Th probability function for the selection of a particular cluster head is given below. (2)
pi (t ) = {
0
; 𝐾
𝑛−𝑘∗(𝑟 𝑚𝑜𝑑
𝑛 ) 𝑘
;
ci t
ci t
=0 =1
At the beginning of each round, all nodes select a random number from 0 to 1. If the selected random number is less than the given threshold T (t) in the above equation, the node will be cluster headed for the current round. The K value is obtained by equation 3 below. (3) 𝐾𝑜𝑝𝑡 =
𝜖𝑓𝑠 𝑀 √ √2𝜋 𝜖𝑚𝑝 𝑑 2 𝑡𝑜𝐵𝑆 √𝑁
Placing the closest and farthest node in this formula, a range is defined for an optimized number of cluster heads (kopt), i.e, 1 < kopt < 6. Performing an analysis on this formula, it becomes clear that there is an inverse relationship between the optimal number of cluster heads and d2toBS. This shows that the farther the Base Station is located from the network, the fewer number of clusters are formed. Higher concentration of clusters in one area can frequently be translated into smaller clusters and fewer nodes. Therefore , this article focuses on the number of cluster heads relative to the Base Station. Figure 2 represents the size of two clusters and their distance from the Base Station. The WEEC algorithm is based on a concept discussed below.
Fig. 2. size of cluster heads relative to distance from the Base Station The stablishment phase focuses on the selection of cluster heads and cluster formation. It is assumed that the nodes are distributed uniformly and equally as shown in figure 3. Then, a predefined probability (i.e., weight) is associated to each node in this area. sensor nodes
719
Amin Ebrahimi Gandomani, Farshad Kiyoumarsi, Chem. Process Eng., 2014, 36 (2, Special), 714-731
Fig. 3. a small image of an area with sensor nodes 3. A PROPOSED APPROACH In this section, a suggested approach based on multi-criteria decision-making is introduced and elaborated on. The overall goal of presenting this approach is enhancing the clustering mechanism, data aggregation and reducing network energy consumption in clustering protocols through effective strategies. For each of these listed objectives, a particular strategy is intended so that optimal outcomes are achieved with minimal computational processing and storage overload. In the previous sections, two examples of existing protocols well-known in the area of clustering sensor networks, namely LEACH and WEEC, were outlined and their particular features, advantages and shortcomings were mentioned. Case studies on these two protocols and other clustering protocols have provided for the underlying principles of the idea proposed here. In the proposed protocol, the strategies we suggest inclued: 1. Selection of an optimal number of cluster heads, 2. Selection of appropriate cluster heads, 3. Turning off extra nodes in each cluster, 4. Data aggregation and data compression through the entropy method, 5. and using a multi-phase cmpression structure aimed at reducing the amount of data transmited to a sink. In the studies conducted on network data aggregation techniques, taking advantage of a singlephase or multi-phase clustering algorithm which selects head cluster nodes randomly, while at the same time calculating the amount of remaining energy, is considered a more effective option. Therefore, after explaining the process of data compression through conditional entropy, the different phases of the proposed algorithm are described and compared to other algorithms available, a simulation model is presented, and finally a conclution will be drwan. The simulation assumptions adopted in the establishment of the procedure of the proposed sensor network are defined below:
A sensor network is composed of a large number of sensor nodes Sensor nodes are static and are not capable of mobility All nodes, except the sink node, have limited energy The sink node has a high level of radio range, relatively covering the entire network environment Sensor nodes are completely randomly distributed in the network environment
3.1. Clustering mechanism using K-means Despite its simplicity, this mechanism is considered as the cornerstone for many other clustering methods (e.g., fuzzy clustering), thus making it an exclusive and flat method(Pattem, Krishnamachari et al. 2008). This algorithm is expressed in different forms. However, they all follow a repetitive routine, which attempts to estimate the following for a fixed number of clusters: Obtaining points as cluster centers, which are in fact the very mean for the points belonging to each cluster Associating each sample data to a cluster which is located at the closest distance from the center of that cluster
720
The application of k-means clustering algorithm in optimization of energy consumption in …
Following a simple version of this method, the number of points required are first randomly selected. Then, data are associated to a particular cluster, relative to its adjacency (or, similarity), thus resulting in the formation of new clusters. If this procedure is repeated, new centers can be obtained through calculation of the mean for the data in each repetition and thus data can be associated to new clusters. This procedure continues until no change can be obtained in data. The following function is known as target function. (4) (𝑗)
𝐽 = ∑𝑘𝑗=1 ∑𝑥𝑖=1‖𝑥𝑖
2
− 𝑐𝑗 ‖
In this function, ║║is considered as the standard distances between points and Cj represents the center of cluster j. The following algorithm is considered as the basic algorithm for this method: 1. At first, K points are selecteed as the centers of the clusters. 2. Each sample data is associated to the cluster whose center is closest to the data. 3. After all data have been assigned to one of the clusters, a new point is calculated for each cluster as its center (mean of the points belonging to each cluster). 4. Steps 2 and 3 are repeated until no change is seen in the cluster centers. Note: According to the radio model used in the proposed algorithm, since the clustering criterion is based on the nearest distance between the node and the cluster center, it is not necessary to repeat steps 2 and 3 several times. This type of clustering may be repeated several times in applications other than wireless sensor networks; however due to the very limited energy of sensor nodes and because the clustering mechanism a highly energy-consuming process, we use the strength of the signals received from nodes that are similar in terms of distance to place those nodes in one cluster(Alpaydin 2004, Olson and Delen 2008). 3.2. The stages in the mechanism of the proposed algorithm In the proposed approach, first K number of cluster heads are selected as random points in the network. The required number of cluster heads (K) are selected through equation no. 26 and relative to the number of the remaining nodes in the network. Then, each cluster head node transmits a signal to its surrounding environment through broadcast. Nodes within the network respond to the strongest signal based on the strength of the signals they receive from the cluster head nodes. The degere of similariry and the common features shared between normal nodes and the cluster head nodes is determined through the distance between them. According to the standard radio model IEEE, there is an inverse relationship between the intensity of a signal sent from a source and distance between the source point and the target point. Therefore, the farther a node is located from cluster heads, the weaker the signal it receives from that cluster head is. Thus, nodes in each cluster certainly become a member of a head cluster node frome which they have the closest distance, obviating the need for multiple repetitions to achieve cluster heads. Moreover, the number of nodes in the selected cluster heads can also affect energy consumption in the netwok. In the next stage, the process of data compression and data aggregation will be discussed. (5) 721
Amin Ebrahimi Gandomani, Farshad Kiyoumarsi, Chem. Process Eng., 2014, 36 (2, Special), 714-731 N
E# CH pi (t ) * 1 k i 1
3.3. Data compression using conditional entropy Data compression is amed at omitting the extended part of sensor data and reducing correlation among data and providing useful information for the Base Station without extentions. The data source for each sensor node is represented by a discrete random variable. Entropy of a discrete random variable X is represented with the symbol H (x) and is equal to the minimum number of bits needed to encode X without loss of information(Sasikumar and Khara 2012). Joint entropy of the two random variables X and Y is equal to the minimum number of bits required to jointly encode X and Y. If X contains information about Y, then the joint entropy will be equal to H (X | Y). Thus, according to the equation: H (X | Y) ≤ H (X), where if there is correlation among the data, a significant reduction in the size of the ecoded data is to be obtained. In the proposed algorithm, in order to encod cluster node data, conditional entropy is deployed, which will be explained in the next section. 3.4. The phases of the proposed algorithm In this section, the stages of the suggested algorithm will be explained in two phases, i.e. clustering and data transmission. The clustering phase is similar to the LEACH algorithm in that the optimal number of head cluster nodes selected are calculated and then the clusters are formed. The formula for calculating the optimal number of cluster heads is given in equation 6: (6)
𝐾𝑜𝑝𝑡 =
𝜖𝑓𝑠 𝑀 √ 2 √2𝜋 𝜖𝑚𝑝 𝑑 𝑡𝑜𝐵𝑆 √𝑁
In the data transmission phase, nodes in each cluster send their data to the to the head cluster node after encoding them, and then the data are sent to the central node. 3.4.1. The clustering phase In order to select the cluster head nodes, the remaining energy of the nodes is first considered and then head cluster nodes switch alternately following a random process until a balance is created in energy consumption among network nodes(Heinzelman, Chandrakasan et al. 2000, Cover and Thomas 2006). Each node selects a random number between 0 and 1 represented with T, where T (i) is defined as follows:
(7) 𝑃 𝑇(𝑖) = { 1 − 𝑃(𝑟𝑚𝑜𝑑 ( 1 ) 𝑃 0,
×
𝐸𝑅𝑒𝑠𝑖𝑑𝑢𝑎𝑙 , 𝐸𝑚𝑎𝑥
𝑖𝑓 𝑖 ∈ 𝐺 𝑂𝑡ℎ𝑒𝑟𝑤𝑖𝑠𝑒 722
The application of k-means clustering algorithm in optimization of energy consumption in …
In this equation, P represents the percentage of nodes selected as cluster heads, r represents the current round, and G represents the nodes which have not been selected as cluster heads in in the previous
1 𝑃
rounds. When a node is selected as cluster head, a message transferred across all the
nodes covered by that node, and then each node selects its cluster head, relative to the strength of the signal it receives. 3.4.2. The data transmission phase After the clusters are formed, data transmission will occur in each round following the four stages below:
In each cluster, the cluster head node transfers its data to other nodes. Cluster nodes perform the compression process on their own data, taking into account the correlation between their data and the cluster head data. Cluster nodes trnsfer their data to cluster head node with which they have no data correlation. Finally, cluster head nodes transfer the data to the next cluster head node, after they have been aggregated. This stage is single-step for the nodes that are located at a small distance (a threshold of 30 meters) from the sink.
3.4.3. The network sytem model Here, the system model is considered to be similar to what was assumed in (Heinzelman, Chandrakasan et al. 2000).
Nodes are fixed with limited energy requirements. Each node senses data on a scheduled basis and always has some data to transfer within a specified range. The volume of data sensed by the nodes is the same for all the nodes. Data compression is carried out to reduce the size of data. All nodes have an equal chance to be selected as a cluster head node.
3.4.4. The energy model The energy model adopted here is similar to the energy model in (Heinzelman, Chandrakasan et al. 2000). In this model, the energy consumed for the transmission of k bits is equal to: (8) 𝐸𝑇𝑥 (𝑘, 𝑑) = 𝐸𝑒𝑙𝑒𝑐 × 𝑘 + 𝜀𝑎𝑚𝑝 × 𝑘 × 𝑑 2 And the energy transmitted to receive k bits is equal to: (9) 𝐸𝑅𝑥 (𝑘) = 𝐸𝑒𝑙𝑒𝑐 × 𝑘 723
Amin Ebrahimi Gandomani, Farshad Kiyoumarsi, Chem. Process Eng., 2014, 36 (2, Special), 714-731
Here, d represents the distance between two nodes that are considered as constant variables. Eelec and fixed εamp are constants that have priorly been defined and are equal to, respectively: (10) (11) 𝐸𝑒𝑙𝑒𝑐 = 50𝑛𝐽/𝑏𝑖𝑡 𝜀𝑎𝑚𝑝 =
100𝑝𝐽 𝑏𝑖𝑡
/𝑚2
3.4.5. Comparing energy consumption in the LEACH protocol, the WEEC protocol, and the proposed algorithm In this section, it will be shown how the proposed algorithm constitutes an avancement over the clustering algorithms based on LEACH in the reduction of energy consumption. To this end, energy consumption in each round of data transmission within each cluster will be compared for the three modes of clustering.
(a)The algorithms based on LEACH and WEEC
(b) The proposed algorithm
Fig. 4. Data transmission within clusters (the white circles represent the nodes within a cluster and the black circle represent nodes located at cluster head Considering a nodenodes) with n number of clusters, given that the average distance between the nodes and the cluster heads is represented with d and average distance between the cluster heads and the central node is represented with, and d < D, and given that the rate of data for each node is represented with R and average rate of data compression is equal to r (Fig. 1), the amount of energy consumption within each cluster for both algorithms can be calculated through the equations below: (11) 𝐸𝑇𝑜𝑡𝑎𝑙−𝐿𝐸𝐴𝐶𝐻 = 𝑛𝐸𝑇𝑥 (𝑅, 𝑑) + 𝑛𝑅𝑇𝑥 (𝑅) + 𝐸𝑇𝑥 (𝑅 + 𝑛𝑟, 𝐷) (12) 724
The application of k-means clustering algorithm in optimization of energy consumption in …
𝐸𝑇𝑜𝑡𝑎𝑙−𝐾𝑀𝐶𝑃 = 𝐸𝑇𝑥 (𝑅, 𝑑) + 𝑛𝑅𝑇𝑥 (𝑅) + 𝑛𝐸𝑇𝑥 (𝑟, 𝑑) + 𝑛𝑅𝑅𝑥 (𝑟) + 𝐸𝑇𝑥 (𝑛𝑟, 𝐷) Based on the above equations, in order to reduce energy consumption in the KMCP algorithm compared to the LEACH algorithm, it can be concluded that the correlation between the data, i.e. the ratio of the data rate r to that of R must be in a way that the following equation is satisfied. (13) 𝜀𝑎𝑚𝑝
𝑟
)𝑅−𝑟 ≤ 1 + 𝐸
𝑒𝑙𝑒𝑐
𝑑2
3.4.6. The intelligent sleep/wake-up mechanism One of the strategies for saving energy in network nodes is using the sleep/wake-up mechanism, turning the node into one of the two modes of Sleep or Awake. The requirement to be met in order for each node to turn into either mode is that the cluster head node estimates the distance, depending on the quality of the signal it receives from the cluster head. If the distance between cluster head and the node is shorter than the threshhold coverage defined, the node will turn into the active (wake-up) mode, otherwise the node will turn into the sleep mode. The length of the sleep mode for the node is relative to the length of time each internal round lasts. 4. SIMULATION OF THE KMCP PROTOCOL In this section, simulation results to compare the proposed algorithm and the LEACH basic protocol, and its updated version WEEC, are discussed. NS2 was used as the simulator software in this study. If we assume that there are 100 nodes in an area of 100 sq.m., the optimal number of cluster head nodes is equal to 5% of the total number of nodes, and the central node is located at coordinates (0, 0 ). In order to obtain the data correlation, the model presented in (Enami, Moghadam et al. 2010) has been used. In fact, the correlation between the nodes is a function of distance. Thus, given that the network consists of N nodes is (X1, X2, ... XN), the production rate for each node is equal to H (Xi) = H1 {i = 1, 2, .... N}. Therefore, according to the model presented in (Enami, Moghadam et al. 2010), we have: (14) 𝐻(𝑋𝑗 |𝑋𝑖 ) = (1 −
1 𝑑 𝑐 +1
) 𝐻1 {𝑖, 𝑗 ∈ 1,2, … . 𝑁
Here, c is a constant which determines data correlation and d represents the distance between the Xi and Xj nodes. In this study, a number of simulations have been performed to estimate the number of data transmission rounds occuring before the first node dies. Following direct data transmission, each node directly sends its data to the central node. As it can be seen, the proposed algorithm KMCP, having a hiararchical structure, using an encoding system, and also employing a sleep/wake-up system, has made significant advances in terms of increasing the network life-time over the LEACH and WEEC protocols. In figure 2, the horizental axis displays the data correlation parameter, also represented in the above equation, so that the larger the value c, the more data correlation is obtained. The vertical axis represents the number of data transmission rounds until the first node dies. 725
Amin Ebrahimi Gandomani, Farshad Kiyoumarsi, Chem. Process Eng., 2014, 36 (2, Special), 714-731
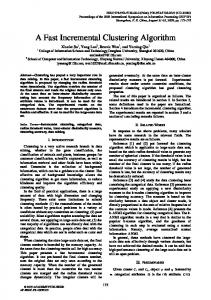
4.1. Table of simulation conditions The simulation conditions for the proposed network is contained in the following table. Table 1. Simulation conditions homogeneous scenario parameters proposed transfer protocol proposed routing protocol drop tail queue type 100 × 100 m network size all-directional antenna type 10,000 seconds simulation time 1 number of sinks bottom left number of sinks 1000 joules sink primary energy 200 meters sink transmission range number of network 100 nodes random position of nodes primary energy of 100 Joules normal nodes transmission range of 100 meters normal nodes 200 queue length of battery mode mode of energy environmental temperature data type generated 4.2. Network energy consumption test One of the basic debatable parameters in the area of network efficiency is the level of energy consumption in network nodes and the degree of energy consumption slope. In the diagram below it can be observed that under the same cicumatances, the level of energy consumption in the proposed protocol with 100 nodes leads to positive outacomes, compared to the LEACH protocal and the WEEC protocal. Distributing network load and balancing the clustering mechanism leads to the improvement of data packet transmission, thus resulting in incresing the overall efficiency of the netwok. In the proposed clustering protocol, efforts are aimed at acheiving balanced distribution of data load on the network nodes and increasing the number of nodes through selecting the best cluster heads regarding the two parameters of energy and distance, adopting a multi-level clustering method, and using data aggregation, compression, and summarization in order to display the capabilities of this protocol in a better way.
726
The application of k-means clustering algorithm in optimization of energy consumption in …
1000 900 800 700 600 500 400 300 200 100 0
LEACH WEEC
10000
9000
8500
8000
7500
7000
6500
6000
5500
5000
4500
4000
3500
3000
2500
2000
1500
1000
500
KMCP
0
Total energy used (Joules)
Energy Consumption Chart
Simulation time(second)
Fig. 6. Comparison of energy consumption with 100 nodes at the simulation time lasting 8000 Seconds
8500 100 8000 7500
0 500
80
1000
60
1500
40
7000
20
2000
WEEC
0
6500
2500 6000 3000 5500 5000
3500 4500
4000
Fig. 7. Death of the first and the last node in the network
727
LEACH
KMCP
Amin Ebrahimi Gandomani, Farshad Kiyoumarsi, Chem. Process Eng., 2014, 36 (2, Special), 714-731
100 90 80 70 60 50 40 30 20 10 0
LEACH WEEC
10000
9500
9000
8500
8000
7500
7000
6500
6000
5500
5000
4500
4000
3500
3000
2500
2000
1500
1000
500
KMCP
0
The number of live nodes in the network
Network nodes charts death
Simulation time(second) Fig. 8. Comparison of death of nodes with 100 nodes at the simulation time lasting 8000 Seconds As was shown in figures 6 and 7, due the effectiveness of the intelligent sleep/awake mechanism in eqivalent nodes, the death of network nodes has been considerably delayed compared to other similar approaches. 4.3. Testing the number of network routing packets The parameter has been suggested to evaluate the proposed protocol alongside its counterparts in terms of the rates of network routing packets to determine the number of packets sent and received in order to determine the degree of success of this protocol in transferring the generated packets to their destination in healthy conditions. In general, the closer the time intervals between the sent and received packets to one another, the more optimal the protocol procedure can be said to be. Based on the data obtained, the percentage of accurate data sent for the LEACH algorithm is equal to 25%, for the WEEC algorithm equal to 28%, and for the KMCP algorithm is equal to 31% (the proposed method), which represents the superiority of the suggested method over the two other methods.
728
The application of k-means clustering algorithm in optimization of energy consumption in …
The number of network packets Number of of packets
400000 350000 300000 250000 200000 150000 100000 50000 0
LEACH
WEEC
KMCP
Send
172458
230129
340543
Receive
43279
65230
108014
Forward
0
0
17451
Fig. 9. Comparison of the number of routing packets with 100 nodes at the simulation time lasting 8000 seconds 4.4. Testing the number of reserved nodes in the network Regarding the threshhold coverage range for each sensor in the proposed method, extra nodes and the nodes that have highly overlap other nodes will go into the sleep mode. To evaluate the performance of the proposed method, three thresholds of 10 , 20 and 30 percent of the coverage range for each cluster head sensor have been considered as the necessary criteria. In figure 10 it can be observed that the higher the level of threshhold is set, the higher the number of sensor nodes that will turn into the sleep mode will be. Nevertheless, merely a higher number of sleep modes can not serve as a good criterion for an efficient netweork. In other words, the network coverage also needs to be guaranteed and maintained simultaneously as monitoring the sleep/wake-up mechnism for the network. Following the idea proposed, with regard to the results from simulation, the appropriate threshhold level has been estimated at 20 % of the coverage range for each sensor. Number of Reserved Node
T=10% T=20%
Number of Reserved Node
50
T=30%
45 40 35 30 25 20 15 10 5 0
Simulation Time 729
Amin Ebrahimi Gandomani, Farshad Kiyoumarsi, Chem. Process Eng., 2014, 36 (2, Special), 714-731
Fig. 10. Comparison of the number of nodes that have turned into the sleep mode or have been reserves, which is directly related to the coverage threshold 5. CONCLUSION One of the major challenges confronting wireless sensor networks is the amount and quality of energy consumption in such networks. In this paper, in order to increase network lifetime, a multicriteria algorithm based on K-Means clustering algorithm is presented . The overall goal of this method is to improve the clustering mechanism, data aggregation and reduction of network energy consumption in clustering protocols. In order to accomplish each of the goals mentioned here, a strategy is adopted to acheive positive outcomes with the lowest computational and processing overload. Thus, following the proposed protocol, the strategies employed in the first phase include: selecting the optimal number of cluster heads, selecting appropriate cluster heads, turning off the extra nodes (i.e. using the intelligent sleep/wake-up mechanism ) in each cluster, and aggregation of data through data entropy. In the second phase of this protocol, a multi-step compression is performed aimed at reducing the size of data transmitted to the sink node. Simulation results obtained from NS2 software show that the proposed algorithm displays a greater performance in all parameters compared to other similar methods offered, i.e. the LEACH and WEEC algorithms.
REFERENCES: Abbasi, A. A. and M. Younis (2007). "A survey on clustering algorithms for wireless sensor networks." Comput. Commun. 30(14-15): 2826-2841. Akyildiz, I. F., W. Su, Y. Sankarasubramaniam and E. Cayirci (2002). "Wireless sensor networks: a survey." Computer Networks 38(4): 393-422. Alpaydin, E. (2004). Introduction to Machine Learning (Adaptive Computation and Machine Learning), The MIT Press. Behboudi, N. and A. Abhari (2011). A Weighted Energy Efficient Clustering (WEEC) for Wireless Sensor Networks. Mobile Ad-hoc and Sensor Networks (MSN), 2011 Seventh International Conference on. Cover, T. M. and J. A. Thomas (2006). Elements of Information Theory (Wiley Series in Telecommunications and Signal Processing), Wiley-Interscience. Dehni, L., F. Krief and Y. Bennani (2006). Power Control and Clustering in Wireless Sensor Networks. Challenges in Ad Hoc Networking. K. Al Agha, I. Guérin Lassous and G. Pujolle, Springer US. 197: 31-40. Enami, N., R. A. Moghadam and K. D. Ahmadi (2010). A new neural network based energy efficient clustering protocol for Wireless Sensor Networks. Computer Sciences and Convergence Information Technology (ICCIT), 2010 5th International Conference on. Goldsmith, A. J. and S. B. Wicker (2006). "Design challenges for energy-constrained ad hoc wireless networks." Wireless Communications, IEEE 9(4): 8-27. 730
The application of k-means clustering algorithm in optimization of energy consumption in …
Heinzelman, W. R., A. Chandrakasan and H. Balakrishnan (2000). Energy-efficient communication protocol for wireless microsensor networks. System Sciences, 2000. Proceedings of the 33rd Annual Hawaii International Conference on. Misra, I. S., S. Dolui and A. Das (2005). Enhanced energy-efficient adaptive clustering protocol for distributed sensor networks. Networks, 2005. Jointly held with the 2005 IEEE 7th Malaysia International Conference on Communication., 2005 13th IEEE International Conference on. Olson, D. L. and D. Delen (2008). Advanced Data Mining Techniques, Springer Publishing Company, Incorporated. Pattem, S., B. Krishnamachari and R. Govindan (2008). "The impact of spatial correlation on routing with compression in wireless sensor networks." ACM Trans. Sen. Netw. 4(4): 1-33. Sasikumar, P. and S. Khara (2012). K-Means Clustering in Wireless Sensor Networks. Proceedings of the 2012 Fourth International Conference on Computational Intelligence and Communication Networks, IEEE Computer Society: 140-144. Stojcev, M. K. (2007). "Mohamed Ilyas, Imad Mahgoud, Handbook of Sensor Networks: Compact Wireless and Wired Sensing Systems, Hardcover, pp 864, CRC Press, 2005, ISBN 0-84931968-4." Microelectronics Reliability 47(6): 996-997. Yick, J., B. Mukherjee and D. Ghosal (2008). "Wireless sensor network survey." Computer Networks 52(12): 2292-2330.
731