Ahmed Nabil BELBACHIR and Peter Michael GOEBEL .... Vjâ1 on an image approximation; index k runs to all 2 l direc- tions. .... Morgan Kaufmann, 2000.
THE CONTOURLET TRANSFORM FOR IMAGE COMPRESSION Ahmed Nabil BELBACHIR and Peter Michael GOEBEL Pattern Recognition and Image Processing Group Vienna University of Technology, A-1040 Vienna, Austria email: .[nabil,goe]@prip.tuwien.ac.at ABSTRACT The JPEG 2000 norm uses the bi-orthogonal wavelet transform for image decomposition. Wavelets are well adapted to point singularities (discontinuities), however they have a problem with orientation selectivity, and therefore, they do not represent two-dimensional singularities (e.g. smooth curves) effectively. This paper introduces and presents an evaluation of the contourlet transform for image compression, which has good approximation properties for smooth 2D functions. The contourlet finds a direct discrete-space construction and is therefore computationally efficient. The information gain resulting from this approach is demonstrated on several images with a minimal resolution of 1 Mega pixels. A comparative study is performed between the contourlet and the wavelet analysis in terms of result quality and information compaction using a new metric. The potential of the contourlet transform for image compression and further coefficient coding and improvement of its implementation are discussed. 1. INTRODUCTION During the past two decades, image compression has developed from a mostly academic Rate-Distortion field [18], into a highly commercial business. Various lossless and lossy image coding techniques have been developed [16]. Since the compression ratio obtainable from lossy compression can significantly exceed that obtainable from lossless compression, the primary trade-off concerns the need for reproducibility versus the storage and transmission requirements. Lossy compression mainly consists of decorrelation and quantization stages that reduce the image size by permanently eliminating certain information. The decorrelation stage of the image compression algorithm is usually done by a transformation from one space to another space to facilitate compaction of information. One approach is the use of multiresolution transforms, that are free from blocking effect artifacts such as in case of the Discrete Cosine Transform (DCT), which is used in the JPEG (baseline) industry standard [16]. By the use of the WaVelet Transform (WVT), the corresponding coefficients of the different decomposition levels are correlated and show a characteristic trend. This residual correlation is indicative for a further compression potential. Some standard methods (e.g. JPEG2000) get
profits from this potential, especially when considering sets of transform coefficients as feature specific compounds. Wavelet-based methods have expanded in the field of still image and video compression [16]; they offer the advantage of a better trade-off between complexity, compression and quality over the traditional DCT-based methods. However, for image compression, WVT has a problem with the orientation selectivity because it provides local frequency representation of image regions over a range of spatial scales, and therefore, it does not represent two-dimensional singularities effectively. In a map of the large wavelet coefficients, one sees the edges of the images repeated at scale after scale. This effect means that many wavelet coefficients are required to reconstruct the edges in an image properly, reducing the number of coefficients will introduce artifacts on the edges of the reconstructed image [7]. The RidGelet Transform (RGT) [5] was developed over several years in an attempt to break an inherent limit plaguing wavelet denoising of images. This limit arises from the frequently depicted fact that the two-dimensional (2-D) WVT of images exhibits large wavelet coefficients to represent the image edges. A basic model for calculating ridgelet coefficients is to view ridgelet analysis as a form of wavelet analysis in the Radon domain. It has been shown in [8] that ridgelet representation solve the problem of sparse approximation of smooth objects with straight edges. In [7], an attempt has been made to use RGT for image compression. However, in image processing, edges are typically curved rather than straight and ridgelets alone cannot yield efficient representation. But, if one uses a sufficient fine scale to capture curved edges, such an edge gets almost straight, therefore ridgelets are deployed in a localized manner. As a consequence the CurVelet Transform (CVT) [4] has been introduced. CVT is based on multiscale ridgelets combined with a spatial bandpass filtering operation. CVT was initially developed in the continuous-domain via multiscale filtering followed by a block RGT on each bandpass image. Later, the authors proposed the second-generation CVT [6] that was defined directly via frequency partitioning without using RGT. Both curvelet constructions require a rotation operation for the frequency decomposition, which ensures the construction in the continuous-domain. For discrete images,
sampled on a rectangular grid, the discrete implementation of the curvelet transform is very challenging. Therefore a new image representation method was introduced: the ConTourlet Transform (CTT) [9]. The authors start with a description of the transform in the discretedomain and then prove its convergence to an expansion in the continuous-domain. Thus a discrete-domain multiresolution and multidirectional expansion is constructed. This in the same way as wavelets are derived from filter banks, but using non-separable filter banks. Due to the fast-iterated filter bank algorithm the construction results in a flexible multiresolution, local and directional image expansion using contour segments. However, CTT has the adverse property of showing other types of artifacts due to the discrete approach. This paper investigates an assessment of the CTT for image compression, by a combination between CTT and WVT. Due to the evolving development of acquisition technology image size grows up to the order of several million pixels (at least 1 mega-pixel). In order to achieve improved image compression performance a sparse representation is highly required, which considers anisotropy in the image. CTT can be applied efficiently to capture smooth contours at larger resolutions (≥ 256x256 pixels-resolution), while WVT can be used for lower resolution images for further information compaction. The image quality is evaluated using this combined approach for decorrelation compared to that with wavelets. The potential of CTT for information compaction for high resolution is demonstrated. In Section 2 of this paper, CTT is summarized. Section 3 contains a comparative study between WVT and the CTT-based applied technique on 3 selected high resolution images by means of a quantitative evaluation. Finally, the obtained results are discussed and future directions for image compression are proposed. 2. THE CONTOURLET TRANSFORM Efficient representations of signals require that coefficients of functions, which represent the regions of interest, are sparse. Wavelets can pick up discontinuities of one dimensional piecewise smooth functions very efficiently and represent them as point discontinuities. 2D WVT obtained by a tensor product of one-dimensional wavelets are good to isolate discontinuities at edge points, but cannot recognize smoothness along contours. Numerous methods were developed to overcome this by adaptive [14], Radon-based [4], or filter bank-based techniques [11]. Do and Vetterli [11] proposed the Pyramidal Directional Filter-Bank (PDFB), which overcomes the block-based approach of CVT by a directional filter bank, applied on the whole scale, also known as CTT. It has been developed to offer the directionality and anisotropy to image representation that are not provided by separable WVT. CTT is a multiscale and directional decomposition of a signal using a combination of a modified Laplacian Pyramid (LP) [3, 10] and a Directional Filter Bank
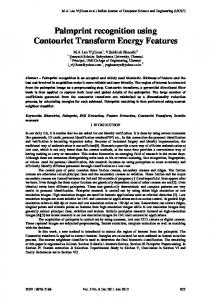
Fig. 1. Generation of subspaces by the LP (left), DFB (middle) and PDFB (right); j subspace index; k direction; l all directions
(DFB) [12]. PDFB allows for different number of directions at each scale/resolution to nearly achieve critical sampling. As DFB is designed to capture high frequency components (representing directionality), the LP part of the PDFB permits subband decomposition to avoid ”leaking” of low frequencies into several directional subbands, thus directional information can be captured efficiently. Fig. 1 illustrates the subspace splitting by respectively LP, DFB and PDFB. Vj is a subspace, defined on a uniform grid with intervals 2j x 2j . The difference image in the LP carries the details necessary to increase the resolution from V j to Vj−1 on an image approximation; index k runs to all 2 l directions. As stated above, CTT offers the ability to choose the number of directions independently. We did early experiments with over 100 images, and it was proved, that the smoothness of the contours within an image is coupled with the spatial resolution of a desired scale. We found, that beyond a spatial resolution of 2 8 pixels the application of the CTT carries no advantage compared with WVT in terms of information compaction. Thus, WVT has been used, in this work, instead the CTT for low resolution decomposition levels (scales). Therefore, the adopted image decomposition for compression purpose is then: 1. Four decomposition levels for image size ≤ 1024 x 1024 pixels, where two scales are CTT, (with l=16 directions) and the remaining two are WVT (l=3). (See Fig. 2). 2. Five decomposition levels for image size ≤ 2048 x 2048 pixels, thus, there are three CTT levels (with l=16 directions) and two WVT levels (l=3); 3. six decomposition levels for image size ≤ 4096 x 4096 pixels, thus, there are four CTT levels (with l=16 directions) and two WVT levels (l=3). In this work, images with size described from item 1. and 2. have been chosen for this investigation and the test results are reported in the next section. 3. EXPERIMENTAL RESULTS Compression results using WVT and CTT on 3 selected images (”Man”, ”Berry” and ”Art”) are reported in this Section. The evaluation between these approaches is performed using the criterion PSNR and Potential Information Loss (PIL) [1].
Scale2
5
10
Counts
WVT WVT CTT CTT
0
10 −1000
−800
−600
−400
−200
0
200
400
600
800
1000
Scale1
4
10
3
Counts
10
2
10
1
10
0
10 −1500
−1000
−500
0 Normalized Value
500
1000
1500
Fig. 3. The histograms of the coefficients ”Man” image.
Scale 2
4
10
WVT CTT 3
Fig. 2. CTT with four decomposition levels, WVT is used for the two coarse levels.
Counts
10
2
10
1
10
0
10 −1000
−600
−400
−200
0
200
400
600
800
Scale 1
10
WVT CTT
Counts
PIL is a new metric, similar to the Kullback-Leibler distance [1], served for the evaluation of quality of the reconstructed image. It uses the probability density function of the image for evaluation. The histograms in Fig. 3 to Fig. 5 of the reconstructed and those of the original images are used for the calculation of PIL by means of the difference between both histograms (i.e. by computing the sum of the relative differences between all graylevel counts). The original images are decomposed using CTT (see item 1. and 2. in Section 2) and WVT. Then, simple hard thresholding is performed over delcared insignificant coefficients (with amplitude < a threshold). The images are reconstructed from the remaining significant coefficients and the reconstruction errors are derived. An arithmetic coder [20] is used then to encode the remaining coefficients and the factor between the coefficient sizes from the original and the encoded images are used to derive the compression ratios. Experimental results are presented in Table 1. The number of maintained significant coefficients using CTT is up to 20% smaller; the image quality gets better up to 1dB (according to PSNR) than for WVT. Thus, the resulting compression ratio is slightly increased using CTT for an acceptable visual image quality. Fig. 6 depicts the original selected high resolution images ”Man”, ”Berry” and ”Art”. Fig. 7, 8 and 9 present the resulting reconstructed images. All (a) labeled sub-figures are the WVT results. The WVT artifacts (image quality) can be seen in zoomed regions at the (b) labeled sub-figures. The (c) labeled sub-figures concern to the CTT results. The CTT image quality can be verified in zoomed regions (d). Additionally to the improved information compaction by CTT, visual quality preservation (better representation of edges) can be seen from the zoomed images (d) compared to WVT results (b). A reason for that can be noticed from Fig. 4, such that CTT
−800
5
0
10 −800
−600
−400
−200 0 Normalized Value
200
400
600
Fig. 4. The histograms of the coefficients ”Berry” image.
provides a sparser representation of the images at fine scales and therefore, compacts them in fewer coefficients. At coarse scales, usually for ≤ 256 x 256 pixel-images, WVT can outperform CTT as object geometry is simplified and therefore, contours are not smooth anymore. 4. CONCLUSION AND PERSPECTIVES This paper investigates the potential of the ConTourlet Transform (CTT) for compression of high resolution images (≥ 1 million pixels). The experimental results show a promising perspective as CTT provides a more compact representation of the information compared to that of the WaVelet Transform (WVT) used in the compression standard JPEG2000. This is figured out by the histograms of the coefficients at Fig. 3 to Fig. 5, which mostly shows the CTT inside the WVT curves. Furthermore, CTT shows less information loss and artifacts on the reconstructed images after a simple hard thresholding of the transformed coefficients. Indeed, WVT exhibits a large number of coefficients for representing smooth contours, which are usually present in high resolution images. However, WVT compacts better the
Images
”Man” by WVT ”Man” by CTT ”Berry” by WVT ”Berry” by CTT ”Art” by WVT ”Art” by CTT
Image Size
Nb, of Maintained Coefficients
PSNR dB
PIL
Compression Ratio
1k x 1k 1k x 1k 1k x 1k 1k x 1k 2k x 2k 2k x 2k
48522 43242 5869 4668 16855 15248
24.5 25.5 25.9 26.4 23.0 24.1
0.62 0.42 0.24 0.20 0.3 0.3
2.8 3.2 28.1 29.3 31.4 33.1
Table 1. Number of maintained coefficients, PSNR, PIL and CR for the test images. Scale 3
3
10
WVT CTT
2
Counts
10
1
10
0
10 −3000
−2000
−1000
0
1000
2000
3000
4000
Scale 2
4
10
Counts
WVT CTT 2
10
0
10 −2000
−1500
−1000
−500
0
500
1000
1500
Scale 1
5
10
Counts
WVT CTT
0
10 −1500
−1000
−500 0 Normalized Value
500
1000
Fig. 5. The histograms of the coefficients ”Art” image.
information for the coarse resolution (up to 2 8 pixel-image) as the geometry, usually, gets simplified. Therefore, a combination CTT-WVT (CTT for finest resolution and WVT for coarse resolution) seems to be good candidate for a new compression codec. Also a metric should be developed to find the objective best scale for the turnover from CTT to WVT processing. Investigations are still needed to recognize the adequate entropy coder for the resulting coefficients. Indeed, the hierarchical structure exploited by the JPEG 2000 codec is not explicitly valid for our combination of methods. In a future work the combination of the coefficients from both transforms into zero trees (representing the interscale dependencies) will be studied. 5. REFERENCES [1] A.N. Belbachir and H. Bischof. On-Board Data Compression: Noise and Complexity Related Aspects. Technical Report Number 75, PRIP, TU Vienna, 2003. [2] A.N. Belbachir, H. Bischof and F. Kerschbaum. A Data Compression Concept for Space Applications. DSP-SPE’00, IEEE Digital Signal Proc. Workshop in Hunt, TX, USA, Oct. 2000. [3] P. J. Burt, E. H. Adelson. The Laplacian pyramid as a compact image coder. IEEE Trans. Commun., Vol.31(4):532-540, April 1983. [4] E.J. Candes and D.L. Donoho. Curvelets - A Surprisingliy Effective Non-Adaptive Representation for Objects with Edges. in
Curve and Surface Fitting, A. Cohen, C. Rabut, and L.L. Schumaker, Eds. Saint Malo: Vanderbilt University, 1999. [5] E. J. Candes and D. L. Donoho. Ridgelets: a Key to HigherDimensional Intermittency? Phil. Trans. R. Soc. Lond. A., pp. 2495-2509, 1999. [6] E. J. Candes and D. L. Donoho. New Tight Frames of Curvelets and Optimal Representations of Objects with Smooth Singularities. Department of Statistics, Stanford University, Tech. Rep., 2002. [7] M.N. Do and M. Vetterli. Orthonormal Finite Ridgelet Transform for Image Compression. ICIP’2000, Vancouver,Canada, September 2000. [8] M.N. Do and M. Vetterli. The Finite Ridgelet Transform For Image Representation. IEEE Trans. on Image Processing, Jan. 2003. [9] M.N. Do and M. Vetterli. The Contourlet Transform: An Efficient Directional Multiresolution Image Representation. IEEE Trans. on Image Processing, Oct. 2003. [10] M. Do and M. Vetterli. Framing Pyramids. IEEE Trans. on Signal Processing, VOL. 51, NO. 9, September 2003. [11] M. Do. Directional Multiresolution Image Representations. Ph.D. Thesis, Department of Communication Systems, Swiss Federal Institute of Technology Lausanne, November 2001. [12] M. Do and M. Vetterli. Contourlets. in: J. Stoeckler, G. V. Welland (Eds.), Beyond Wavelets, pp.1-27., Academic Press, 2002. [13] D.L. Donoho and M. Duncan. Digital Curvelet Transform: Strategy, Implementation, and Experiments. in Proc. Aerosense 2000, Wavelet Applications VII, SPIE, 4056, 2000. [14] E.L. Pennec and S. Mallat. Image Compression with Geometric Wavelets. IEEE International Conference on Image Processing, 2000. [15] D.Y.D. Po and M. Do. Directional Multiscale Modeling of Images using the Contourlet Transform. IEEE Trans. on Image Processing, Draft version of June 2004. [16] K. Sayood. Introduction to Data Compression. Second Edition, Morgan Kaufmann, 2000. [17] J.L. Starck, D.L. Donoho and E.J. Candes. Astronomical Image Representation by the Curvelet Transform. Astronomy and Astrophysics 398, 785-800, 2003. [18] E. Tuncel and K. Rose. Computation and Analysis of the NLayer Scalable Rate-Distortion Function. IEEE Trans. on Information Theory, Vol.49, No.5, May 2003. [19] Z. Wang and C. Bovik. A Universal Image Quality Index. IEEE Signal Processing Letters Vol. 9, no.3, pp.81-84, March 2002. [20] A. Moffat, R. Neal, I. Witten. Arithmetic coding revisited. ACM Trans. on Information Systems, vol. 16, no. 3, pp. 256294, 1998. [21] http://www.prip.tuwien.ac.at/˜ goe/Psip2005.zip
Original "Man" Image
Reconstructed Image by WVT with PSNR= 24.5035and PIL= 0.62712
a a
Zoomed Reconstructed WVT Image
Original "Berry" Image
b
b
Reconstructed Image by CTT with PSNR= 25.547and PIL= 0.42946
Original "Art" Image
c
c
Zoomed Reconstructed CTT Image
d
Fig. 6. The original images. Fig. 7. Reconstructed ”Man” images (at right).
Reconstructed Image by WVT with PSNR= 25.8993and PIL= 0.23946 Reconstructed Image by WVT with PSNR= 23.0171and PIL= 0.29986
a
a
Zoomed Reconstructed WVT Image
Zoomed Reconstructed WVT Image
b
b
Reconstructed Image by CTT with PSNR= 24.1547and PIL= 0.29696
Reconstructed Image by CTT with PSNR= 26.3752and PIL= 0.20639
c c
Zoomed Reconstructed CTT Image
d d
Fig. 8. Reconstructed ”Berry” images.
Fig. 9. Reconstructed ”Art” images.