J. Mater. Environ. Sci. 7 (3) (2016) 828-834 ISSN : 2028-2508 CODEN: JMESCN
Garras et al.
The Development of a Mathematical Approach Towards Predicting Turbidity in the Smir lake Reservoir (Tetouan, Morocco) S. Garras1, 2, S. Bacroume1, M. Rahouti2, S. E. Barcha3, A. Bellaouchou3, and M. Fekhaoui1 1
2
Group of Pollution, Ecotoxicological and Health Risk, Scientific Institute, Rabat, Morocco. Laboratory of Botany, Mycology and Environment, Department of Biology, Faculty of Sciences, Mohammed V University, Rabat, Morocco. 3 Laboratory of Materials and Nanotechnology and the Environment, Department of chemistry, Faculty of Sciences, Mohammed V University, Rabat, Morocco.
Received 21 April 2015, Revised 28 Dec 2015, Accepted 13 Jan 2016 * Corresponding Author. E-mail:
[email protected]; Tel: (+212623847179)
Abstract Eutrophication is a global issue resulting from urban, industrial as well as agricultural development. In order to better target the parameters responsible for the heightening of dam’s eutrophication in general and the Smir lake reservoir in particular, we have diagnosed and analyzed the evolution of possible correlations between turbidity and several physicochemical parameters during the period 2001 -2008 by employing SPSS 20 software. This approach has allowed us to specify a relationship between the behavior of turbid water and its implications on water quality and treatment, in addition to the understanding of other parameters such as temperature and total phosphorus. Keywords: Eutrophication, Turbidity, Modelling, Smir lake reservoir, North West, Morocco.
1. Introduction Of all the water resources in Morocco, consisting of 29 billion m3, only 20 billion m3 are currently mobilized under acceptable technical and economic conditions. These 20 billion m3 are divided into 16 billion m3 of surface water and 4 billion m3 of underground water [1]. Since the 1960s, Morocco has given priority to the water sector by building hundreds of dams and nearly 13 water transfer systems which, according to the Ministry of Equipment (2002), mobilize nearly 11.8 billion m3 of surface water resources, nearly 10.4 billion m3 for irrigation, and 1.4 billion m3 for drinking water [1]. But since that time, quality of water transfer systems has suffered deterioration due to urban and industrial discharges [2] which led to promoting the development of aquatic plants. [3] In view of this alarming situation, numerous works have been completed by local as well as international researchers that focus on eutrophication problematic from several angles. What matters to us most is the mathematical modelling aspect [4-8], which shows strong ties between phosphorus, chlorophyll (a) and water transparency, which were observed and reported in fresh water systems. Other researchers have adopted the same approach in establishing their model of prediction of chlorophyll (a), including a host of other environmental variables (Dissolved Oxygen (DO), temperature (T), silicon tetraoxide (SiO4), Total Nitrogen(TN), pH…) [9]. Among the most recent studies conducted in this repect, one could cite the one concerning the evolution of chlorophyll (a) and turbidity in the Mansour Eddahbi reservoir on the basis of other independent variables [10], and the study which processes evolution (modeling) of the behavior of dependant variable phosphorus in function of other independent variables in the same Smir reservoir [11]. Within the
828
J. Mater. Environ. Sci. 7 (3) (2016) 828-834 ISSN : 2028-2508 CODEN: JMESCN
Garras et al.
framework of this study, a mathematical approach has been developed as to specify a model of evolution concerning turbidity in function of other physico-chemical parameters capable of speeding up the eutrophication of the Smir lake reservoir.
2. Materials and methods 2.1. Study Site
The dam site on the Oued Smir is located 22 km from the city of Tetouan covering a surface of 4.7Km2. The dam filling was carried out in 1991. It is used exclusively to supply drinking water to the city of Tetouan and a significant number to tourism accommodation (M'diq Martil Restinga, Capo Negro and Fnideq). The average annual contribution of this site is 31 million m3. The dam consists of a main dyke in the Oued Smir valley with a dyke road on the left bank. The total volume of filling is 710,000 m3. Also, the main dyke is composed of a zoned backfill with a waterproof nucleus that is maximally 45 meters in height. This backfill is rests on a rocky substratum [1]. Unfortunately, this humid zone suffers from a deterioration of aquatic environment due to the acceleration of urban planning and the increasing development of tourism and road projects in the region.
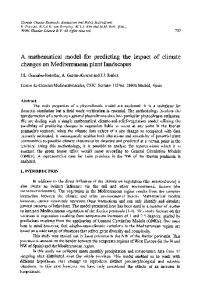
Figure 1: Location of the Smir lake (Agency of the Hydraulic Pond of Loukkos) 2.2. Statistical Analysis
The data were analyzed from a database with the values of several physical and chemical parameters measured at the reservoir lake Smir. Monthly samples were taken at the surface, at a measuring station in the tower of the dam outlet. The different analytical methods used are: a mercury thermometer for the temperature graduated in tenth, pH meter type HACH for pH, conductivity meter for the Type HACH conductivity, turbidity HACH Type for turbidity, method chemical Winkler for the determination of dissolved oxygen, determination method by fluorometric for
829
J. Mater. Environ. Sci. 7 (3) (2016) 828-834 ISSN : 2028-2508 CODEN: JMESCN
Garras et al.
the chlorophyll (a) and the colorimetric methods using a spectrophotometer for the kjeldahl nitrogen and total phosphorus. The data sample consists of 2778 observations, made between 09/01/2001 and 19/08/2008 using SPSS20 software. Missing values were estimated by different correlations for each parameter; then, regression models were established between different physico-chemical parameters of the dam. The analysis method is based on the choice of the minimum set of variables that can explain the variation of the predicted parameter. The parameters tested include: water temperature (T) in centigrade scale, pH, conductivity (Cond) in S/cm, turbidity (Turb) in NTU, dissolved oxygen (DO) in mg/l; Kjeldahl nitrogen (KN) in mg/l, total phosphorus (TP) in mg/l and chlorophyll (a) (Chl a) in mg/m3. A follow-up research was conducted and an analysis on a database (BBD) obtained under the framework agreement between the National Electricity Office and Drinking Water - Water Branch (Branch Onee-Water) and BD consulting. The selected physicochemical parameters are: the water temperature (T) in °C, pH, conductivity (Cond) in S/cm, turbidity (Turb) in NTU, dissolved oxygen (DO) in mg/l; Kjeldahl nitrogen (KN) in mg/l, total phosphorus (TP) in mg/l and chlorophyll (a) (Chl a) in mg/m3. With T: water temperature measured in Celsius (°C) degree. pH: potential for hydrogen, an index that allows for the measurement of hydrogen ion in a solution. It is an indicator of acidity. Conductivity: a measurement of the concentration in water of inorganic salt, and the aptitude of the latter to serve as an electrical conductor. In natural waters, it is low but rises with pollution; Conductivity allows the overall appreciation of the ensemble of products in water solutions. Here it is expressed in micro-siemens per centimeter. Turbidity: a manifestation of a water whose transparency is limited by the presence of solid matters in suspension. The appropriate measurement unit is Nephelometric Turbidity Unit (NTU). Dissolved Oxygen (DO): the quantity of oxygen (O2) available in water, and vital for aquatic life, as well as for the oxidation of organic matter; The result of analysis is expressed in mg/l. (milligram per liter). The Kjeldhal nitrogen: it is the sum of organic nitrogen+ammoniac contained in water. The result of analysis is expressed in mg/l. (milligram per liter). Total phosphorous (TP): a vital element for the development of all living organisms, TP = P organic + P mineral expressed in mg/l. (milligram per liter). Chlorophyll (a): a pigment present in all plant cells, a parameter which is indicative of algae density, expressed in mg/m3 (milligram per cubic meter). This database consists of 2778 observations; the missing values were estimated on the basis of different correlations for each parameter using the software SPSS 20. All the data relative to the physico-chemical values of the reservoir have been transformed into logarithms (basis 10) in order to remedy to the heterogeneity of variances. A simple linear model is formalised according to the linear regression which follows: Y = aXi + b + ε where : - Y is the variable to be explained (dependent), - X is the variable to be explained (independent), - a and b are the regression parameters, - ε is a residue due to the effect of the variables that have not been taken into consideration in the model. This general equation may be simplified by eliminating the non-significant terms with a view to obtaining a more reduced equation. With i = 1,2….2778 observations
830
J. Mater. Environ. Sci. 7 (3) (2016) 828-834 ISSN : 2028-2508 CODEN: JMESCN
Garras et al.
3. Results and discussion 3.1. Procedure for lead determination method Bivariate Pearson correlations (Table 1) established between log10 concentration of turbidity with different physicochemical parameters (total phosphorous, Kjeldahl nitrogen, temperature, pH, conductivity and dissolved oxygen), show the existence of significant relationships between the considered parameters. Table 1: Bivariate correlations of the log10 of turbidity with different physicochemical parameters log10 TP log10 T log10DO log10 pH log10 KN log10 cond Pearson log10 Correlation 0.866** -0.766** 0.656** 0.384** -0.277** -0.237** Turb Sig. 0.000 0.000 0.000 0.000 0.000 (bilateral) ** The correlation is significant at 0.01 degree (bilateral), N: Number of observations.
log10 chl (a) 0.211** 0.000
According to the above table, we observe that turbidity presents a strong correlation with total phosphorous (0.866) followed by the temperature which is negatively correlated (-0.766), and finally dissolved oxygen (0.656). These significant correlations have allowed us to establish linear regression between these variables through discarding insignificant terms. A poor correlation between turbidity and chlorophyll (a) (0.211) and between turbidity and pH was highlighted. It might be explained by the fact that the dam had a low biomass during the 2001-2008 study period. This could result from several factors such as the grazing of phytoplankton by zooplankton: the poisoning of restraint by the introduction of 200 000 chinese silver carp Hypophtalmichtys molitrix, a type of fish mostly used in the biological control against algal proliferation [12]: 25 000 common carp Cyprinus carpio: this type of fish does not consume algae, but stirs the depth receptacle and increases water turbidity, reducing thus photosynthesis and therefore the multiplication of algae. 25 000 herbivores carp Ctenopharyngodon idella carpio: a type of fish that consumes macrophytes which multiply in the reservoir Similarly, the partial draining in the fall of deeper water layers showing deficit in dissolved oxygen allowed an improvement in water quality [12]. As the values of pH in fresh waters rise due to photosynthesis of phytoplankton [13], the low rate of chlorophyll (a) in the site explains the low correlation between turbidity and pH (0.384). We could examine the relation between turbidity and other variables by a hypothesis test that allows for gauging the nullity of the right slope of regression. To this end, we take recourse to the analysis of the variance on the basis of SPSS software. Test ANOVA.(Table 2) Table 2: Analysis of the variance on the basis of SPSS software. Test ANOVA Model Sum of Squares ddl Mean of Squares D Regression 67.766 3 22.589 5090.865 1 Residue 12.313 2775 0.004 Total 80.079 2778
Sig. 0.000
Where the « mean of squares » corresponds to the values of the sum of squares divided by their respective freedom degree, the significance level (sig) is much lower than 5%. Consequently, the line slope is different from 0, and the variable explains significantly the model. When we develop a statistical model, we aim to explain as far as possible the variability of parameters, that is, variance of the model. Thus, the more we explain this variance, the better the quality of representation of parameters by the model will be.
831
J. Mater. Environ. Sci. 7 (3) (2016) 828-834 ISSN : 2028-2508 CODEN: JMESCN
Garras et al.
In order to assess the quality of variability or the proportion of variability of total phosphorus, we resort to the coefficient of R-Two determination (or R2) (Table 3). Table 3: Coefficient of R2 Determination Model
R
R-Two
Standard Error of estimate
1
0.920
0.846
0. 066611684958577
Thus, 84.6% of the turbidity variance (dependent variable) has been expressed by the independent variables: PT, temperature, and dissolved oxygen, which are seasonal variables. This strong relationship is not random, and the model is significant (p