navigation, many of them include road lane detection, obstacles recognition and avoidance in the vehicle's path [1,2,3], traffic lights and marks on roads.
Proceedings of the 5th WSEAS Int. Conf. on Signal Processing, Computational Geometry & Artificial Vision, Malta, September 15-17, 2005 (pp149-154)
Traffic sign shape classification based on correlation techniques A. VÁZQUEZ-REINA, S. LAFUENTE-ARROYO, P. SIEGMANN, S. MALDONADO-BASCÓN, F. J. ACEVEDO-RODRÍGUEZ Departamento de Teoría de la Señal y Comunicaciones Universidad de Alcalá Escuela Politécnica Superior. Campus Universitario.28871, Alcalá de Henares, Madrid SPAIN
Abstract: - In this paper we present a correlation-based matching method for traffic sign shape classification. Our purpose is to offer a robust and reliable framework which can be used in numerous applications like driver assistance systems. The shape classification is scale, translation and rotation invariant. The process involves obtaining essential features (e.g. edges, ridges, corners) from each area, and comparing it to the stored templates of known patterns. The algorithm is very flexible, easy to reconfigure for many different shapes and the results we obtained show the success rate. Key-Words: - Advance driver-assistance systems (ADASs), intelligent vehicles, road sign detection and classification.
1 Introduction The information provided by either traffic signs or route-guidance signs is extremely important for safe and successful driving. An ADAS with the automatic ability to extract and identify these signs would help human drivers to avoid traffic hazards. Such systems would indicate the presence of a sign in advance so that human incorrect decisions could be avoided, and could assist drivers on signs they didn’t notice. There are many examples of ADAS which aid piloting and navigation, many of them include road lane detection, obstacles recognition and avoidance in the vehicle’s path [1,2,3], traffic lights and marks on roads detection [4] etc. Traffic sign classification techniques can be seen as pattern recognition systems which aim to classify data based on either a priori knowledge or on statistical information extracted from observations. In most of these systems, the patterns to be classified are usually groups of measurements defining points in an appropriate multidimensional space. The classification or description scheme is usually based on the availability of a set of patterns that have already been classified or described. This set of patterns is termed the training set and the resulting learning strategy is characterized as supervised. Learning can also be unsupervised, in the sense that the system is not given an a-priori labeling of patterns, instead it establishes the classes itself based on the statistical regularities of the patterns.
Pattern recognition is typically an intermediate step in a longer process. These steps generally are acquisition of the data (image, sound, text, etc.) to be classified, preprocessing to remove noise or normalize the data in some way (image processing, stemming text, etc.), computing features, classification and finally post-processing based upon the recognized class and the confidence level. The classification or description scheme usually uses one of the following approaches: statistical (or decision theoretic), syntactic (or structural), or neural. Statistical pattern recognition is based on statistical characterizations of patterns, assuming that the patterns are generated by a probabilistic system. Structural pattern recognition is based on the structural interrelationships of features, and neural pattern recognition employs the neural computing paradigm that has emerged with neural networks. A typical approach for detecting and recognizing road sign shapes consists of 2 stages. First, color segmentation or color thresholding is applied to distinguish possible signs in the image, then template matching is applied for actual shape detection [5]. Wei et al [6] proposed a method based on color filter, boundary smoothing by close and open morphological operations, and a shape analysis which evaluates the similarity between a region and a given shape, it includes major and minor axis as well as comparing area. Jim Torresen. Jorgen W. Bakke and Lukas Sekanina [7] proposed an automatic
Proceedings of the 5th WSEAS Int. Conf. on Signal Processing, Computational Geometry & Artificial Vision, Malta, September 15-17, 2005 (pp149-154)
recognition of speed limit signs based on template matching too. Many other studies about detecting and recognizing road signs by morphological methods [8], fuzzy reasoning [9] and neural networks [10,11,12,13,14] have been presented. In our case, the pattern recognition system consists of a sensor that gathers the images with traffic signs to be classified or described, a feature extraction mechanism that computes numeric information from these observations, and a supervised structural classification scheme correlation-based that does the actual job of classifying traffic signs shape relying on the extracted features The images we used for the analysis of the performance have been captured in outdoor environments. They include a large variety of signs which have been collected with different orientation, skew and sometimes under occlusion and shadow. It must be said that most of them have been chosen because they present typical situations that every traffic shape recognition system have to deal with, such as scene environment, rotation, and traffic sign size. Most of them are overcame here with high success.
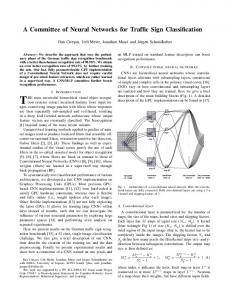
useful features from the image. In the distance transform phase, our goal is to obtain a new image from the original one which makes the structure easy to characterize. And finally, in the pattern classification stage, we look into the database and match the features with templates trough a correlation (Fig.1).
2.1 Feature extraction Feature extraction includes segmentation by red, blue, yellow and white and connected components labeling, as it is needed a partition of the image into multiple regions to locate the main objects in the scene, which are the traffic signs to be classified. After that, the objects are scaled in order to adjust the size of the templates with the box that inscribes the potential traffic sign from the acquired image. And finally, we apply outer border detection because this border will be the principal feature we will use for the shape classification (Fig. 2).
2 Shape classification The shape classification process can be divided into three phases: Feature extraction, distance transform and correlation-based classification.
(a)
Input image
(b)
Feature extraction
Fig. 2 – Feature extraction. (a) Original image, (b) Potential traffic sign extraction after segmentation and connected components labeling, (c) Outer border.
Distance transform
Traffic sign shape classification
(c)
Database
Found Not found Fig. 1 – Shape classification scheme.
In the feature extraction stage, we apply a segmentation process based on HIS space color and focus on the potential patterns to try to extract some
2.1.1 Segmentation Different color spaces haven been used to segment traffic signs. In this work, red, blue and yellow are obtained from Hue and Saturation thresolding, while white is obtained from the image’s achromatic decomposition according to [15] defined by:
f ( R, G , B ) =
(R−G + G − B + B− R) 3D
(1)
Where R,G,B represents the brightness of the respective color and D is the degree of extraction of an achromatic color. Due to this segmentation, traffic
Proceedings of the 5th WSEAS Int. Conf. on Signal Processing, Computational Geometry & Artificial Vision, Malta, September 15-17, 2005 (pp149-154)
sign’s contour can now be easily distinguished as shown in Fig. 3
(a)
(a)
(c)
2.2 Distance transform computation Distance transform is a fast, reliable method to determine the resemblance of one point set to another. It does so by examining the proximity of the two point sets. There are several different sorts of distance transform depending upon which distance metric is being used to determine the distance between pixels. In our case the pixel value in the output image is the approximated Euclidean distance from this pixel to the nearest nonzero pixel of the input binary image, so the distance between pixels is calculated as:
(b)
(d)
Fig. 2 – (a) Original image, (b) Red segmentation (c) Blue segmentation, (d) Yellow segmentation, (e) White segmentation.
d=
(∆x )2 + (∆y )2
(2)
Where x and y are the coordinates that locate any specific pixel location on the image, and “∆" (delta) refers to the change in a variable. Thus, ∆x is the change in x. In Fig. 4 we can see an example of how it works (we have actually represented distancetransformed’s negative, but in fact it doesn’t matter which is used):
2.1.2 Connected components labeling Connected components labeling scans the segmented image and groups its pixels into components based on pixel connectivity. Once all groups have been determined, each pixel is labeled with an index according to the component it was assigned to. Pixels forming traffic sign shape are usually strongly connected, so we can easily extract them. 2.1.2 Boundary detection. The border of the shape is the main feature we need to classify it. It’s easy to obtain, we just need to get the first non-zero pixel we find when we scan the image from one side to the opposite one (Fig 3).
(a)
(b)
Fig. 4 – Distance transform. (a) Outer border (b) Distance transformed.
There is a dual to the distance transform described above which produces the distance transform for the foreground region rather than the background region. It can be considered as a process of inverting the original image and then applying the standard transform as above.
2.3 Pattern classification (a)
(b)
Fig. 3 – Boundary detection. (a) Outer border scan, (b) Border image.
The pattern classification is correlation-based. The correlation is a numeric measure of the strength of linear relationship between two random variables. The Pearson product-moment correlation coefficient is used to estimate the correlation of each template and input candidate object and is defined as follows:
Proceedings of the 5th WSEAS Int. Conf. on Signal Processing, Computational Geometry & Artificial Vision, Malta, September 15-17, 2005 (pp149-154)
∑ (x n
rxy = i =1
i
)(
− x yi − y
) (3)
(n − 1)s x s y
Considering an one dimensional organization of the images, xi and yi, represent the i-th pixel value of the two different images, n is the number of pixels in both images, x and y are the means of x and y, sx and sy are the sample standard deviations of x and y. We calculate the correlation of two distancetransformed raw images, one from our templates, and the other one, the image with the sign’s shape we are trying to classify. In our experimental testings we have used five different templates which can be seen in Fig.5 .
(1)
(2)
The traffic sign orientation adds complexity to the work because we need more templates in order to take into account possible different traffic sign poses. It has to be considered that images taken at different angles yield different distance-transformed images. Looking at images taken at different angles allow us to discriminate the shapes more accurately. The number of templates needed depends on the shape’s symmetry and the total number of shapes we want to be able to classify.
3 Results This technique was applied to sign images actually captured with a camera installed in an automobile. Images quality was 2048 x 1360 and 24 bits per pixel. Some results are shown in Figs. 7-9.
(3) (a)
(4)
(5)
Fig. 5 – Templates.
There is a threshold of how close a match to any sample must be achieved before the algorithm reports it as a detected shape. The higher this threshold, the more false negatives and the fewer false positives. It’s important to note that distance transformed templates are not always uncorrelated, so it makes it harder to discard those which does not actually match with the shape we’re trying to classify. Fig. 5 is an example of how the decision maker works.
Lowly correlated
(a)
rxy
(c)
(d)
(a)
Highly correlated
(a) 1
(b)
↓↓
rxy 2↑↑
(b)
(c)
(d)
Fig. 7 – (a) Original image (b) Extracted object after Segmentation and connected components labeling (c) Outer border (d) Distance transformed.
(b)
(c)
Fig. 6 – (a) Extracted object outer border distance transformed (b) Template 1 (c) Template 2.
Proceedings of the 5th WSEAS Int. Conf. on Signal Processing, Computational Geometry & Artificial Vision, Malta, September 15-17, 2005 (pp149-154)
(a)
(b)
(c)
(d)
Fig. 9 Results under different conditions. Original images and the Pearson product-moment correlation
coefficient for the five templates.
(a)
(b)
(c)
(d)
Fig. 8 – (a) Original image (b) Extracted object after Segmentation and connected components labeling (c) Outer border (d) Distance transformed
By inspecting the results reported in Figs. 8 and 9 we can conclude that the distance transform mask obtained for each segmented object differs clearly from the other four templates even under partial occlusions. In conclusion, the shape’s detection rate is high even under these conditions. This characteristic is specially relevant since the presence of an object partially occluding a sign would produce the same effect than a bad segmentation. Except in the cases of highways, where due to the sign size and location, occlusions are more difficult, it is an typical situation in roads and almost always within cities.
(a)
(b)
(c)
Fig. 10 – Example of false alarm. (a) Extracted object after Segmentation and connected components labeling (b) Outer border (c) Distance transformed.
Proceedings of the 5th WSEAS Int. Conf. on Signal Processing, Computational Geometry & Artificial Vision, Malta, September 15-17, 2005 (pp149-154)
There are many objects in the images with similar colors and shapes than traffic signs. These candidate objects to traffic signs are false alarms in our shapeclassification system but we suppose they will be discarded in future works when their inner areas are analyzed. In Fig. 10 an example of false alarm is illustrated, where the system classifies the noise object as a circular sign.
4 Conclusion This paper describes a traffic sign shape classification scale, rotation and translation invariant. The ADAS presented here is capable of classifying traffic signs shapes almost independently of their appearance in the image. So, it is invariant to rotation because templates with different orientations were taken into account before computing the correlation coefficient, invariant to occlusions because, as it has been illustrated above, the distance transform is strongly invariant to it and finally, invariant to scale because once objects are isolated, they are normalized to the same size of the templates used in correlation step. We use this traffic sign’s shape classification to detect it on the scene. The computation load is low, and the algorithm is flexible and easy to scale up to many shapes. This method can be easily speeding up in a hardware implementation. Experimental results indicate that our system is able to deal with strange shapes without accuracy penalization.
Acknowledgments This work was supported by the project of the Ministerio de Educación y Ciencia de España number TEC2004/03511/TCM. References: [1] A. Broggi, M. Bertozzi, A. Fascioli, and G. Conte, Automatic Vehicle Guidance: The experience of the ARGO Vehicle. Singapore: World Scientific, 1999 [2] U. Franke, D. Gavrila, S. Gorzig, F. Lindner, F. Paetzol, and C. Wohler, Autonomous driving approaches downtown,” IEEE Intell. Syst., vol. 13, pp. 40-48, Nov. / Dec. 1998 [3] U. Handmann, T. Kalinke, C. Tzomakas, and M. Werner, An image processing system for driver assistance, Image Vision Comput., vol. 18, pp. 367-376, 2000. [4] U. Franke, D. Gavrila, A. Gern, S. Gorzig, R. Janssen, F. Paetzol, and C. Wohler, From door to door, principles and applications of computer
vision for driver assistance systems, Intelligent Vehicles Technologies, L. Vlacic, F. Harashima, and M. parent, Eds. Oxford, U.K.: Butterworth Heinemann, 2001, pp. 131-188. [5] M. Lalonde and Y. Li. Road sign recognition, survey of the state of the art. In CRIM/IIT (Centre de recherché informatique de Montreal), 1995. [6] G. Wei et al. Traffic sign detection and recognition for safe driving. In Dagli et al., editors, Smart Enginering System design: Neural Networks, Fuzzy logic, Evolutionary Programming, Data Mining, and Complex Systems, Proc. Of ANNIE’99. ASME Press, November 1999. [7] Jim Torresen. Jorgen W. Bakke and Lukas Sekanina. Efficient Recognition of Speed Limit Signs. IEEE Intelligent Transportation Systems Conference. 2004. [8] G.Y Jiang, T.Y. Choi, Y.Zheng, Morphological traffic sign recognitions, Proc. Int. Conf. on Signal Processing, Laussanne, Switzerland, vol. 1, 1996, pp. 531-534. [9] W. Li, X. Jiang, Y. Wang, Road recognition for vision navigation of an autonomous vehicle by fuzzy reasoning, Fuzzy Sets Syst. 93, 1998 pp. 275-280. [10] D. Ghica, S.W. Lu, X. Yuan, Recognition of traffic signs by artificial neural network, Proc. IEEE Int. Conf. on Neural Network, Perth, Australia, vol. 3, 1995, pp. 1444-1449. [11] J.A. Janet, M.W. White, T.A. Chase, R.C. Luo, J.C. Sutto, Pattern analysis for autonomous vehicles with the region and feature based neural network: global self-localization and traffic sign recognition, Proc. IEEE Int. Conf. on Robotics and Automation, Minneapolis, Minnesota, vol.4, 1996, pp.. 3596-3604. [12] N. Kehtarnavaz, A. Ahmad, Traffic sign recognition in noisy outdoor scenes, Proceedings of the Intelligent Vehicles Symposium, Detroit, 1995, pp. 460-465. [13] S.W. Lu, Recognition of traffic signs using a multilayer neural network, Proc. Canadian Conf. on Electrical and Computer Engineering, Halifax, Nova Scotia, vol.2, 1994, pp. 833-834. [14] C.Y. Fang, C.S. Fuh, P.S. Yen, S. Cherng, S.W. Chen, An automatic road sign recognition system based on a computational model of human recognition processing. Computer Vision and Image Understanding 96 (2004) 237-268 [15] H. Liu, D. Liu and J. Xin. Real-time recognition of road traffic sign in motion image based on genetic algorithm. Proceedings of the 1st. Int. Conference on Machine Learning and Cybernetics, pp 83-86, 2002.