Oct 15, 1990 - Mulligan, M.E., Hawley, D.K., Entriken, R., and McClure, W.R. (1984). Nucl. Acids Res. 12, 789-800. 4. Galas, D.J., Eggert, M., and Waterman, ...
%.:) 1991 Oxford University Press
Nucleic Acids Research, Vol. 19, No. 2 313
Training back-propagation neural networks to define and detect DNA-binding sites Michael C.O'Neill Department of Biological Sciences, University of Maryland, Baltimore County, Baltimore, MD 21228, USA Received October 15, 1990; Accepted November 25, 1990
ABSTRACT A three layered back-propagation neural network was trained to recognize E. coli promoters of the 17 base spacing class. To this end, the network was presented with 39 promoter sequences and derivatives of those sequences as positive inputs; 60% A + T random sequences and sequences containing 2 promoter-down point mutations were used as negative inputs. The entire promoter sequence of 58 bases, approximately - 50 to +8, was entered as input. The network was asked to associate an output of 1.0 with promoter sequence input and 0.0 with non-promoter input. Generally, after 100,000 input cycles, the network was virtually perfect in classifying the training set. A trained network was about 80% effective in recognizing 'new' promoters which were not in the training set, with a false positive rate below 0.1%. Network searches on pBR322 and on the lambda genome were also performed. Overall the results were somewhat better than the best rule-based procedures. The trained network can be analyzed both for its choice of base and relative weighting, positive and negative, at each position of the sequence. This method, which requires only appropriate inpuVoutput training pairs, can be used to define and search for any DNA regulatory sequence for which there are sufficient exemplars. INTRODUCTION There have been numerous attempts to develop ad hoc procedures for the analysis of DNA binding-site sequences (1-6). In addition, there have been at least two attempts to develop analytical methods for this purpose from a theoretical basis: one aimed at determining the information content, position by position, of an aligned group of related binding-site sequences (7,8) and a second (9), employing a statistical-mechanics analogy, to rank individual sequences within a related group with respect to how well they fit the ideal group image. All of these methods have shortcomings. Indeed, all share the significant fault that they do not use all of the information available in the sequences being analyzed. Take, for example, the two theoretically based procedures (which, it should be noted, show substantial promise); these procedures share a major assumption and a known fault. The assumption common to both methods is that statistical methods, developed and proven in the context of very large scale
ensembles, can be usefully applied to very small scale samples. The common fault is that they posit positional independence, that is, the choice of a given base at one position is treated as independent of the choice at any other position. However, there is extensive genetic evidence to the contrary in the form of context-dependent and/or compensatory mutations. The authors acknowledged that this choice was dictated by mathematical rather than biological considerations. Possible cross-correlations in the sequence information have generally either been ignored, as in these cases, or weakly addressed by grouping subsets of positions showing, say, pairwise correlation or perhaps a high degree of conservation as a secondary criterion in a particular procedure. What is clearly needed is a method which can accept the entire sequence of the site and avidly use all of the information-not only position by position but also all cross correlations of every position with every other position-to determine the generalized image of the input set. Mathematically, this is not a trivial problem. However, with the advent of the back-propagation neural network (10, 1), there now exists an extremely powerful non-linear, sub-symbolic approach which can attack this complex task by high-speed iteration. This type of neural network can consist of three layers of 'neurons'. The first is an input layer which would, in this case, receive an example of a site sequence encoded in binary form. Every neuron in this layer is connected to every neuron of the second layer by differentially weighted lines. The second or 'hidden' layer neuron is used to sum all the inputs received from the first, in this case either 0 or 1 times the weight assigned to the interconnecting line, and to convert that sum by a non-linear transfer function to an output which is again transmitted on a weighted line to the third, or output, layer. The third layer neuron in turn sums its inputs and converts the sum by a transfer function to an output value, in this case a value between 0 and 1. Training the network consists of providing it with true and false input examples and the corresponding desired output. In the case of sequence analysis, a true site sequence could be paired with a desired output of 1.0 and a false sequence with an output of 0.0. The network receives these input-output pairs and, using a gradient-descent algorithm (cf. 1), continually adjusts the weights on the lines connecting the neurons in such a way as to minimize the difference between the desired output and the actual output as each pair is presented. The network continues this cycle until the difference between expected and actual output, for every member of the training set, becomes smaller than a
314 Nucleic Acids Research, Vol. 19, No. 2 value predetermined by the user, assuming there is no internal contradiction in the input set. This network is therefore an iteration machine which is free to make pragmatic use of fully cross-correlated input data in its effort to make a correct output classification. In this work, a back-propagation network is designed and trained to search for E. coli promoters belonging to the 17-base spacing group; however, the approach is generally applicable to sequence problems in which there are multiple examples of a particular type of site.
in the range of 5% and above. Of the architectures explored, network employing 232 input neurons, one hidden layer of 15 interneurons, and a single output neuron was found to be most effective. The network requires an input in binary form. Both dense (2 symbols to code 4 bases) and coarse (4 symbols to code 4 bases) coding were tested. Coarse coding of the input gave superior results. The code adopted was: 0001 =A, 0010 =C, 0100 =G, 1000=T. No allowance was made for degeneracies, nor were there any degeneracies in the input set. A 58 base input sequence is thus represented by 232 binary characters, one for each input neuron. A sequence beginning with ACGT.... would correspond to the values 0001 0010 0100 1000 being presented to the first 16 neurons of the 232 neuron input layer. A 'desired' output value is also supplied with each input sequence, 1.0 for a promoter and 0.0 for a non-promoter, as the second half of each input training pair. The network starts training with a random assortment of small weights (+ /- 0.1) on all lines between neurons. When the first binary sequence is presented to the input layer, an output is generated based on those weights and sigmoidal transfer functions, with range 0 to 1, in the second and third layers. The final output is compared with the desired output which was supplied in the input pair. The difference between the actual and desired outputs is used to reset all the weight values in the network in a direction that will reduce the discrepancy. A new input sequence is then presented to the input layer, and the procedure is repeated. The weights are readjusted after every sequence presentation. The entire training set is presented to the input layer, perhaps many times over, in the course of obtaining the desired degree of precision in the output. a
METHODS Networks The neural networks employed in this study were all designed, trained, and tested using Neuralware II ProfessionalTM software. The approach developed should, nonetheless, be applicable within any software environment which allows the generation of a backpropagation model of sufficient size. More than 25 distinct network configurations were tested in the course of this work, including networks with two internal layers. Since the number of neurons in the hidden layer is the primary determinate of the network's complexity and its ability to generalize, a large number of choices were examined, ranging from networks with as few as 3 hidden layer neurons to as many as 60. Model studies were also performed with reduced input sets with much smaller samples of both positive and negative input data; these consistently produced unacceptably high levels of false positive classifications
Table 1. Promoter classification of the input training set by 4 trained neural networks. Network 1
Network 2
Network 3
Network 4
#in 5148
#out 5149
#in 5148
#out
Promoters
5149
#in 5148
#out 5149
#in 5148
#out 5150
Non-promoters
10296
10295
10296
10295
10296
10295
10296
10294
Errors false positive false negative
1 0
1 0
1 0
2 0
The networks were trained as described in the Methods; in all cases, the learning coefficient was 0.9 and the momentum was 0.6. Networks 1 and 2 received random sequence set A. Networks 3 and 4 received random sequence set B. Network 1 was trained with 165,000 facts, 2 with 100,000 facts, 3 with 136,000 facts, and 4 with 130,000 facts. A sequence was scored as a promoter if it produced an output value of 0.9 or higher. The average promoter in the training set produced a score of 0.9997 in network 1, 0.9992 in network 2, 0.9982 in network 3, and 0.9986 in network 4. The # in refers to the actual number of promoters or non-promoters in the input; the # out refers to the number of sequences classified by the network as either promoters or non-promoters. The false positive found by network 1 was the same found by 2; the false positive found by network 3 was one of those found by network 4. Table 2. Classification of previously unseen promoters by 4 trained neural networks.
Naive Promoters Errors
Promoters Missed
Network 1 #in #out
Network 2
#in
#out
#in
#out
#in
#out
36
36
31
36
29
36
26
29
8 (22%)
6 (17%)
6,12,14,17
20,24,25,27
Network 3
Network 4
8 (22%)
11 (31%)
6,9,12,17,
6,12,14,17,
6,12,14,17,
24,27
20,24,26,30
19,20,21,22,23,24,27
The promoters used as input here are listed in the Methods. The number associated with a given promoter here refers to the order within that list. Promoters were classified as found if they produced an output value of 0.9 or greater. A poll of the 4 networks finds 78 % of the input promoters recognized by 2 or more networks in common.
Nucleic Acids Research, Vol. 19, No. 2 315
Input Set The input set consisted of 5148 58-base sequences drawn from 39 promoters of the 17-base spacing group, 4000 random sequences which were 60% in A+T, and about 100 examples of the P22 ant promoter representing all pairwise permutations of double promoter-down mutations from the list of strong promoter-down mutations reported by Youderian et al. (12); the two smaller groups were duplicated until the size of each equalled the size of the promoter group, resulting in an input of over 15,000 sequences. The random sequences were prescreened, using previously described promoter-search programs (6,13), to eliminate promoter sequences incidentally created in this group. Input sequences from this set were supplied to the network in random order with the promoter group assigned a 'true' output value of 1.0 and the other two groups a 'false' value of 0.0. The 39 promoters used were: malT, trpP2, fol, uvrBP3, lexA, rplJ, lacI, trp, bioB, spot 42, MIRNA, tufB, supBE, araC, thr, uvrBPl, oriL, glnS, str, spc, rpoA, T7A1, X Pr, X Prm, P22ant, T7C, 434Pr, 434Prm, P22mnt, TnlOPin, TnlOPout, Tn5neo, gnd, T7B, T5N25, T5 26, T5 28, T5H207 (14), and T5DE20 (15). This group of 'true' sequences was expanded by permuting all possible single base changes in positions other than those known to harbor promoter point mutations; the rule used was that all positions except for those in the -35 region, -4/+2 bases, and the -10 region, -51+2 bases could be altered singly. In this expansion, there would be 132 derivatives of each promoter sequence; in the first position of these 132 sequences, 129 would have the wild-type base and 3 would have the other three bases. In 3 other sequences, the second position would be mutated and so on. This was done on the assumption that single point mutations which have not shown up in studies to-date are unlikely to have a significant negative effect on the sequence. The effect of this expansion in direct tests was to broaden the promoter definition without significant effect on the frequency of false positives. This description may be too generous, with the inclusion of some non-promoter sequences in the promoter group. A second set of 36 promoters (14,16) was assembled as a test of trained networks in recognizing promoter targets which were not included in the training set. This set consisted of the following promoters: T7A3, T7D,X pL, X pO, X pR', P22Prm, phiXA, fdX, pBRbla, pBRP1, pBRprimer, pBRtet, colElPI, rsfprimer, rlOOrnal, rlOOrnaII, Tn5IR, bioP98, X c17, X cin, X L57, cya, divE, AtPE, plSprimer, pColvirPl, pyrEPI, rnp, rpmH2p, rpmH3p, rpsTP2, rpmB, T7B, ompC, fdII, carAB-Pl. Programs The following set of programs were written, in Pascal unless otherwise noted, in support of this work: a.) A program to convert a DNA sequence of length, L, bases into L-58+1 binary inputs of length 232, each with an output designation, in a form suitable for input into Neuralware H. b.) A program to convert L lines of 58 base sequences into L lines of binary inputs of length 232, each with an output
e.) A program to introduce systematic single base changes, one per sequence, into a set of input sequences over a range of sequence positions set by the user. f.) A program to introduce pairwise base changes into a set of input sequences, permuting all possible pairs over a set of positions determined by the user. g.) A program, in Basic, to generate random DNA sequence of any desired length subject to an overall constraint on base ratios set by the user. This software, including the source code, is available to investigators on request. With minor modifications to the code, it should be possible to use these programs with any of the various commercial neural networks programs.
RESULTS There are two major difficulties one encounters in applying a back-propagation neural network in any classification problem. The first is that there exists no set of rules defining the optimum training procedure either with respect to learning the input set Table 3. Promoter search by trained networks on pBR322 and lambda. Network 1
pBR322(cw) 477,1584,1970,4130
Network 2
1584,1970,3650,4130
pBR322(ccw)
85,1241,3138,3343, 3557,4239
85,1241,1842,3138, 3198,3343,3557,3832, 3868,4087
Network 3 Network 4 Network Poll
1584,1970,2024,3650, 4130,4153
3138,3557,4087,4239
1584,1970,2446,3343, 4130,4153
3138,3557,4239
1584,1970,4130,4153
85,1241,3138,3343,
lambda(rw)
3557,4087,4239 lambda(lw)
(> =2)
85,1241,1377,1737, 85,1814,2745,2866,
Network 1
4576,8587,14518, 25227,37974,44538, 46999,48033
614,9452,16250, 21182,22703,25951, 25975,27256,28100, 35631,37989,38725, 42820,46026,46468
Network 2
8587,13080,23077, 25365,37974,44538, 46999
614,9452,23266, 28100,35631,36905, 37989,38725,42820, 42977
35631,37989,44155,
37974,41206,46999, 47213
46468
Network 4
13034,16926,28714, 37974,41206,44538, 46999
4415,8367,9452, 23163,24038,27815, 34269,35631,37989, 42820,44155,46468
designation.
Network Poll
c.) A program of the type in b.) above but capable of accepting input from three distinct input files to produce a single binary file suitable for input to Neuralware. (It should be noted that WordPerfect 5.0Tm was found to be unsuitable for editing these often extremely large ( > 8 megabytes) files, with data corruption showing up after the first 40 pages routinely.) d.) A program to read and summarize the output file generated by Neuralware, subject to criteria set by the users.
8587,37974,41206, 44538,46999
614,9452,28100, 35631,37989,38725 42820,44155,46468
In the search of pBR322, a cutoff value of 0.9 was used for promoter hits. In the search of lambda, 0.9982 was the cutoff; this corresponds to the lowest score for the average promoter in the training set among the 4 networks. (For a cutoff of 0.9, the number of hits increased to 48(r) and 52(1) for network 1, 59(r) and 69(1) for network 2, 99(r) and 94(1) for network 3, and 39(r) and 50(1) for network 4, with the poll producing 47(r) and 67(1).) Positions underlined represent the locations of known promoters.
Network 3
316 Nucleic Acids Research, Vol. 19, No. 2 to learn from the input set the general definition of a promoter sequence. The measure of this ability is the network's success in classifying previously unseen inputs. Table 2 shows the performance of the 4 networks on 36 'new' promoter sequences. These sequences were chosen after prescreening with a program based on a derived information content function (13). These networks average a 77 % recognition rate. Of those promoters missed, 4 were missed by all four networks and three more were missed by three of the four; these 7 (pBRtet, P22Prm, rsf primer, Tn5IR, X cin, X PE, pyrEPI) constituted 76% of the misses on the average. A more stringent and realistic test of any search procedure is its performance on a biological target. Table 3 shows the result of searching pBR322 (17,18) and the lambda genome (19) with these trained networks. It can be seen that the individual networks are highly effective and that the network poll produces a highly specific result. The search on pBR322 produced 4 hits in the clockwise direction and 7 in the counter-clockwise direction, including bla, primer, and P1; the tet and P4 promoters are missed. A comparison of these coordinates with the transcription map of pBR322 (20) suggests that the hits registered at 3343,3557,4087 (ccw), and 1970 (cw) may, as well, be functional promoters. The search on lambda with a cutoff of 0.9 produced 47 hits in the rightward direction and 67 hits in the leftward direction. A more stringent cutoff of 0.9982, corresponding to the average score of a promoter in the training set, produced 5 hits in the rightward direction, including Pr and Pr', and 9 hits in the leftward direction, including PL, Prm, and Po. Again, a comparison with the transcription map of lambda (21) shows that additional hits, 8587 and 46999 rightward and 614, 9452, 28100, 44155, and 46468 leftward, may be functional promoters. Note that, with respect to these targets, only the Pr and Prm promoters of lambda were present in the training set. The weight structure of the trained network can be analyzed
or with respect to generalizing on the basis of the learned set. The second problem is that, while the network may be able to learn the input set to an arbitrary degree of precision, there is no guarantee that the solution thus obtained is an optimal one; the solution can be any one of many adequate to the set task. This means that both the type of training and the length of training are empirically determined. The first problem was addressed by frequently interrupting the training procedure to test the network's abilities on both the input set and various naive (previously unseen) sets. This was done at irregular intervals. These intervals typically were after the first 100 input sequences, the first 300, the first 1000, the first 3000, the first 10,000, the first 30,000, the first 100,000, and on up to 550,000 inputs (40+ passes through the entire input set). The second problem was assessed by training several networks independently from scratch and then polling them for common answers. (This could be accomplished in a single network in the absence of practical limitations due to size.) Table 1 shows the effectiveness of four different networks, of identical architecture, in learning an input set of approximately 15,000 facts. These input sets were identical except for the random sequence; two networks were trained with one random sequence set and two with another. It can be seen that none of the networks had any significant difficulty in learning the input set with essentially perfect accuracy. The sole exception for the first pair of networks was a single random sequence which was classified as a promoter by both of them. The second pair of networks also mis-identified a single random sequence in common, to which the fourth network added one more error of the same type. In each case a random sequence passed the prescreen for promoters but was, nonetheless, a promoter by the neural net criteria; this was to be expected since the prescreen is judged to be about 60% effective in finding new promoters. The object here, of course, is not to learn the input set but Table 4. Promoter sequence preferences of trained networks.
Network 1 ACTACAAACCGTTCTTGACATACGTATCATGATGTTATATAATTGGGACCCCACAAAC T
G
T
C
AG
C G
GT
G
Network 2 ACAGCAAACAACGGTTGACAAAGATGTCACGTTGTTATATAATTGCGGCCCATCAACT G
G
A G G A
T AG GG
A
GGG
Network 3 ATAAGCGTTACGGGTTGACAAAGGTAGCGGGGTGGTATATAATCCCCGCACAACTGGC G CT C AT T GG T A T CAA T G G Network 4 AATACGATTACGTGTTGACATAGGTAGCGGTGTGTACTATAATACCACCCCAACGGAT C A C TA GGG G T AG A A
Poll ACTACAATyAckkGTTGACAAAGGTATCrGGGTGTkATATAATTsCGGCCCAACAGny 43334443432344444444343344344343444434444443443444434434 4 Input Consensus
TCTAAAAAAATTTGTTGACAAATTAACCAATTTTTTGTATAATAACAACACAACTTTT *
*
**
*** *
*** *
*
*
** *
**
The weight matrices of the four trained networks were examined for their selection of bases in defining a promoter. Interneurons carrying positive weights to the output were examined to see which bases resulted in positive inputs, and interneurons carrying negative weights to the output were examined for those bases which resulted in negative inputs. Wherever one or, in some cases, two bases were favored, these are listed for each of the trained networks. The second choice at a given position is listed beneath the first. The number listed below the poll indicates the number of networks supporting a particular choice. Departures of the network consensus from the consensus of the 39 input promoters are indicated with an (*).
Nucleic Acids Research, Vol. 19, No. 2 317 to determine the definition that the network has arrived at in making its classification. All outputs from the hidden layer neurons fall between 0 and 1, but they are multiplied by either positive or negative weights associated with the lines connecting them to the output neuron. Suppose that 'A' is the most desirable choice for the base at position 1 of our sequence. The first four neurons code the first base; in the case of an 'A', the first three neurons have a value of zero and the fourth neuron has a value of one. Since this is the desired input, the network should have learned during training to place positive weights between neuron 4 and those hidden layer neurons which carry positive weights to the output neuron and negative weights between neuron 4 and those hidden layer neurons carrying negative weights to the output neuron. If 'T' is highly undesirable at position 1 of our sequence, neuron 1 which has a value of 1 in the case of a 'T' in the first sequence position should acquire weights of opposite sign to those assigned to neuron 4 during training. Table 4 lists, for each of the four networks, the choice(s) at each promoter position for which there was consistent weighting in both layers, either both positive or both negative. It can be seen that three or more of the networks agreed on the choice of base in 37 positions, not counting the -35 and -10 regions; 19 of these choices differ from the consensus of the 39 input promoters, suggesting that
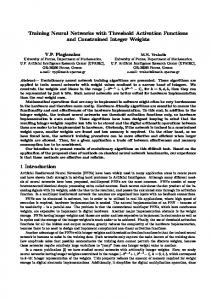
the networks may have made use of cross-correlation information. The testing interruptions during training indicated that the overall optimum sequence is generally set during the first 2000 training facts; in contrast, the weighting associated with those bases continues to change, with improvement in the network's ability to generalize until 100,000 to 200,000 facts have been examined. Training beyond this level produces even more accurate recognition of the input set but apparently becomes too specific, resulting in a reduced ability to generalize. Figure 1 is a histogram of the most positive and most negative choices and their relative weights, drawn from the 3 interneurons which carry positive weights to the output (promoter-confirming) in the first network. Superimposed on this histogram is the information content of the 39 promoter set used for training. While there are specific differences between the two measures, the qualitative agreement is good.
DISCUSSION An earlier attempt (22) to use a neural network for sequence recognition employed the Perceptron model of Rosenblatt (23). This early form of network is relatively limited (24) and, in the case at hand, necessarily assumes positional independence. More recently, other forms of neural networks have been trained to
76
54-
3 2
I
3.wi
0 COATGTNCTNCNCTSMWKTCQ3CACAN ACNNCANNNNNNNCTTGACATACNNA ''
o
-1111I IIIIII
Figure 1. Relative weighting of promoter base choices by a neural network. The relative weights, both positive and negative, assigned by network # 1 are shown above and below the respective base choice. Only those positions which showed a common choice for all three positively weighted intemeurons are assigned a specific base. The dashed curve in the upper histogram represents the information content, position by position, of the input set of 39 promoters.
318 Nucleic Acids Research, Vol. 19, No. 2 recognize E. coli promoters (25,26), however these attempts have been beset by limited capacity and/or an unacceptable level of false positives (several percent) in their output. By comparison, back-propagation networks can learn the training set perfectly, can generalize to a high level, and maintain a false positive level in the 0.1 % range. The limitation on their success as a search vehicle lies not in their inherent power but in the fact that the training task is slightly at odds with what is actually being sought, the ability to generalize. Paradoxically, this distinction springs directly from the networks' considerable power; they can achieve the task at hand without having to arrive at the core of the problem. In the course of this study, one network was trained on an input of 32,000 distinct sequences; after 8,000,000 cycles, it learned to classify every single sequence correctly, but it still was not particularly good on naive inputs. Thus the training set should be designed to be as difficult as possible while remaining faithful to the true and false input categories. In the case at hand, information on promoter mutations was used to expand the input set by over a 100 fold. This improved the performance on pBR322, capturing 3 rather than 2 of the 5 known 17 base class promoters, and on naive targets, capturing 77% rather than 70 % of previously unseen promoters. The best rule-based methods which make use of the fact that there is promoter sequence information specific to each spacing class (6,13) each succeeded in correctly identifying 70% of the promoters used in this test set. These networks improved that result by about 10%. There is reason to suspect that they may be doing even better, although this is difficult to prove in the absence of fully-mapped biological targets. Those networks presented here are specific for the 17-base spacing class. This class appears to have the least amount of sequence conservation (27,28) and, therefore, presents a difficult test. Insertion or deletion of a base in the spacer region of a promoter sequence abolishes its recognition. One could, presumably, train a network on an input set containing all spacing classes without distinction. This would, however, substantially complicate the training task. The network would have to learn that the majority base choices are correlated with the relative position of the - 10 sequence and resolve these choices into three or more sets. By specifically training networks for each spacing class and then employing all such networks in the search, one greatly simplifies the training problem with no loss in overall efficacy. The training of networks for the 16 and 18-base spacing classes should be straightforward; though each of these classes has fewer known members than the 17-base class, both have higher information content (13). A comparison of the input consensus sequence with the network output sequence (Table 4) shows the input consensus to be the simpler of the two. The input consensus sequence has multiple symmetry elements which do not appear in the network output sequence. ( The input consensus sequence shows a direct repeat of the sequence, AACnnATTnnTTGnnTAA, with two mismatches, beginning at position 5 and repeating at position 26. This sequence has a simple underlying purine-pyrimidine pattern: RRY -RYY - YYR - YRR. The spacing is such that these elements fall on a single face of the helix, exposed in the grooves, with the same groove pattern in each repeat (cf. 27). A face of the helix 360 away from that showing the direct repeat shows an inverted repeat, AAAnnnnnnnGTTnnnnnnnAAA, with two mismatches, beginning at position 4 and rotating about position 30. The spacing is such that these elements again fall on a single face of the helix, allowing all rotationally symmetric bases to be exposed in six successive major grooves.) It is tempting to speculate that the input consensus gives a glimpse into the
construction and sequence of the (high level, constitutive?) primitive promoter, whereas the output consensus evidences the changes required to accommodate a rich overlay of promoter regulation. The weight-structure analysis of Figure 1 also makes quantitative statements about the relative weight of a given base at a particular position, indicating that the G of the - 35 region is, by a slight margin, the most heavily weighted choice; however, it should be remembered that this is not necessarily an ideal promoter image. It is noteworthy that the second to last base of the -35 region and the 3rd and 5th bases of the -10 region are not more heavily weighted, by either measure, than a number of other bases outside of the contact regions. Finally, the point should be made explicitly that the backpropagation neural network, in addition to being a powerful analytical tool, is much easier to develop and to use than rulebased search procedures. It requires neither mathematical nor programming skills. Nor does it require the patience implicit in determining appropriate cutoff values for a multi-layered search procedure. The trained network files can be sent to other investigators who, with a small software investment (as little as $200) can immediately employ them to search on new targets or modify them to search for new types of targets.
REFERENCES 1. Harr, R., Haggstrom, M., and Gustafsson, P. (1983). Nucl. Acids Res. 11, 2943 -2957. 2. Staden, R. (1984). Nucl. Acids Res. 12, 505-519. 3. Mulligan, M.E., Hawley, D.K., Entriken, R., and McClure, W.R. (1984). Nucl. Acids Res. 12, 789-800. 4. Galas, D.J., Eggert, M., and Waterman, M.S. (1985). J. Mol. Biol. 186, 117-128. 5. Studnicka, G.M. (1987). Gene 58, 45-57. 6. O'Neill, M.C. and Chiafari, F. (1989). J. Biol. Chem. 264, 5531-5534. 7. Gatlin, L.L. 'Information Theory and the Living System', Columbia University Press, New York, N.Y., 1972. 8. Schneider, T.D., Stormo, G.D., Gold, L., and Ehrenfeucht, A. (1986). J. Mol. Biol. 188, 415-431. 9. Berg, O.G. and von Hippel, P.H. (1987). J. Mol. Biol. 193, 723-750. 10. Werbos, P. (1974). PhD. thesis, Harvard University. 11. Rumelhart, D.E., Hinton, G.E., and Williams, R.J. in 'Parallel Distributed Processing: Explorations in the Microstructures of Cognition.' pp. 318-362, Cambridge, Mass.: MIT Press, 1986. 12. Youderian, P., Bouvier, S., and Susskind, M.M. (1982). Cell 10, 843-853. 13. O'Neill, M.C. (1989). J. Mol. Biol. 207, 301 -310. 14. Hawley, D.K. and McClure, W.R. (1983). Nucleic Acids Res. 8, 2237 -2255. 15. Gentz, R. and Bujard, H. (1985) J. Bacteriol. 164, 70-77. 16. Harley, C.B. and Reynolds, R.P. (1987). Nucl. Acids Res. 15, 2343-2361. 17. Sutcliff, J.G. (1978) Cold Spring Harbor Symp. Quant. Biol. 43, 77-90. 18. Peden, K.W.C. (1983) Gene(Amst.) 22, 277-280. 19. Daniels, D.L., Schroeder, J.L., Szybalski, W., Sanger, F. and Blattner, F.R. In 'Lambda II' (Hendrix, R.W., Roberts, J.W., Stahl, F.W., and Weisberg, R.A. eds.), pp. 469-517 Cold Spring Harbor Laboratory Press. Cold Spring Harbor, NY., 1983. 20. Stuber, D. and Bujard, H. (1981) Proc. Natl. Acad. Sci. (USA) 78, 167-171. 21. Botchan, P. (1976) J. Mol. Biol. 105, 161-176. 22. Stormo, G.D., Schneider, T.D., Gold, L., and Ehrenfeucht, A. (1982). Nucl. Acids Res. 10, 2997-3010. 23. Rosenblatt, F. 'Principles of Neurodynamics.' Spartan Books, New York, NY. 1962. 24. Minsky, M.L. and Papert, S. 'Perceptrons.' Cambridge, Mass.: MIT Press, 1969. 25. Ezhov, A.A., Kalambet, Y.A., and Cherny, D.I. (1989). Studia Biophys. 129, 183 - 192. 26. Lukashin, A.V., Anshelevich, V.V., Amirikyan, B.R., Gragerov, A.I., and Frank-Kamenetskii, M.D. (1989). J. Biomolec. Structure and Dynamics 6, 1 123 - 1 133. 27. O'Neill, M.C. (1989). J. Biol. Chem. 264, 5522-5530. 28. Beutel, B.A. and Record Jr., M.T. (1990). Nucleic Acids Res. 18, 3597-3603.