Sep 30, 2010 - Online social networks (OSNs) like Facebook, and Myspace .... ported [12] to attain the best performance
Transitive Node Similarity for Link Prediction in Social Networks with Positive and Negative Links Panagiotis Symeonidis
Eleftherios Tiakas
Yannis Manolopoulos
Department of Informatics Aristotle University Thessaloniki, 54124, Greece
Department of Informatics Aristotle University Thessaloniki, 54124, Greece
Department of Informatics Aristotle University Thessaloniki, 54124, Greece
[email protected]
[email protected]
[email protected]
ABSTRACT Online social networks (OSNs) like Facebook, and Myspace recommend new friends to registered users based on local features of the graph (i.e. based on the number of common friends that two users share). However, OSNs do not exploit the whole structure of the network. Instead, they consider only pathways of maximum length 2 between a user and his candidate friends. On the other hand, there are global approaches, which detect the overall path structure in a network, being computationally prohibitive for huge-size social networks. In this paper, we define a basic node similarity measure that captures effectively local graph features. We also exploit global graph features introducing transitive node similarity. Moreover, we derive variants of our method that apply in signed networks. We perform extensive experimental comparison of the proposed method against existing recommendation algorithms using synthetic and real data sets (Facebook, Hi5 and Epinions). Our experimental results show that our FriendTNS algorithm outperforms other approaches in terms of accuracy and it is also time efficient. We show that a significant accuracy improvement can be gained by using information about both positive and negative edges.
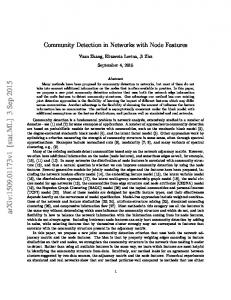
be mined to make predictions about who is a friend of whom. OSNs gather information on users’ social contacts, construct a large interconnected social network, and recommend other people to users based on their common friends. In this paper, we focus on recommendations based on links that connect the nodes of an OSN, known as the Link Prediction problem, where there are two main approaches that handle it. The first approach is based on local features of a network, focusing mainly on the nodes structure; the second approach is based on global features, detecting the overall path structure in a network. Facebook.com and Hi5.com, as shown in Figure 1, have adopted a local method for recommending new friends to a target user v8 : “People you may know : (i) users v2 , v3 , v5 , v6 because you have one common friend (user v1 ) (ii) user v4 because you have one common friend (user v9 ) . . . ”. The list of recommended friends is ranked based on the number of common friends each candidate friend has with the target user. However, in the aforementioned example, the list of recommended friends cannot be ranked, because the number of common friends is the same for all recommended friends. Thus, user v8 gets as friend recommendation user v2 or v3 or v4 or v5 or v6 with equal probability.
Categories and Subject Descriptors G.2.2 [Graph Theory]: Graph algorithms
General Terms Algorithms, Experimentation
1.
INTRODUCTION
Online social networks (OSNs) such as Facebook.com1 , Myspace2 , Hi5.com3 , etc. contain gigabytes of data that can 1
http://www.facebook.com http://www.myspace.com 3 http://www.hi5.com 2
Permission to make digital or hard copies of all or part of this work for personal or classroom use is granted without fee provided that copies are not made or distributed for profit or commercial advantage and that copies bear this notice and the full citation on the first page. To copy otherwise, to republish, to post on servers or to redistribute to lists, requires prior specific permission and/or a fee. RecSys2010, September 26–30, 2010, Barcelona, Spain. Copyright 2010 ACM 978-1-60558-906-0/10/09 ...$10.00.
Figure 1: Example of Social Network. Although Facebook.com and Hi5.com provide friend recommendations, they do not exploit effectively the similarities between the social graph nodes. Instead, they consider only pathways of maximum length 2 between a target user and his candidate friends. For example, according to existing OSNs, in Figure 1, user v8 would get as friend recommendation with equal probability user v2 or v3 or v4 or v5 or v6 . However, if we take into account the “strong” connection between v8 and v9 (due to the fact that v9 does not share many edges with others) then v4 should have a higher probability to be recommended as a friend to v8 . In contrast, other candidate friends (e.g. v2 , v3 , v5 , v6 ) should have a
lower probability to be recommended as friends to v8 because of the “loose” connection between v8 and v1 (due to the fact that v1 shares many edges with other nodes). Compared to existing approaches, our method takes into account the local and the global features of a graph. In particular, we define a basic local similarity measure that captures effectively the proximity between neighbor graph nodes. We also exploit global graph features by introducing transitive node similarity. Thus, two persons that are connected with a path have a high probability to know each other, proportionally to: (i) the length of the path they are connected with, and (ii) the degree of similarity between the neighbor nodes that form that pathway. Compared to the bulk of research on social networks that has focused almost exclusively on positive interpretations of links between people, we also study the interplay between positive and negative relationships. We connect our analysis to theories of signed networks, such as the Structural Balanced theory [8], and the Status theory [10, 11]. More details about these theories can be found later in Section 4.3. The rest of this paper is organized as follows. Section 2 summarizes the related work, whereas Section 3 briefly reviews preliminaries in graphs employed in our approach. Section 4 defines a node similarity measure in OSNs. A motivating example, the proposed algorithm and an algorithm variation for signed networks are described in Section 4.2. Experimental results are given in Section 5. Finally, Section 6 concludes this paper.
2.
RELATED WORK
The research area of link prediction in social networks, tries to infer which new interactions among members of a social network are likely to occur in the near future. There are two main approaches [12] that handle the link prediction problem. The first approach is based on local features of a network, focusing mainly on the nodes structure; the second approach is based on global features, detecting the overall path structure in a network. There is a variety of local similarity measures [12] (i.e. Adamic/Adar index, Jaccard Coefficient, Common Neighbors index, etc.) for analyzing the “proximity” of nodes in a network. Among these indices, Adamic/Adar [1] index is reported [12] to attain the best performance in predicting new links in a social network. Adamic/Adar index, which is similar to Jaccard Coefficient (a commonly used similarity metric in information retrieval), measures how strongly “related” two web pages are. Common Neighbors index, also known as Friend of a Friend algorithm (FOAF) [2], is adopted by many popular OSNs, such as facebook.com and hi5.com for the friend recommendation task. FOAF is based on the common sense that two nodes vx and vy are more likely to form a link in the future, if they have many common neighbors. Finally, other local similarity measures are based on preferential attachment [12]. These similarity measures are based on the sum or product of nodes degree. The basic premise of preferential attachment is that the probability that a new edge involves a node is proportional to the current number of its neighbors. There is a variety of global approaches [12] (i.e Shortest Path algorithm, RWR algorithm, SimRank algorithm etc.). Liben and Kleinberg [12] claimed that the identification of the shortest path between any pair of nodes in a graph can be used for link prediction (friend recommendation). The
computation of the shortest path between two nodes, can be made using any well-known shortest path algorithm [4, 6]. RWR algorithm [15] (Random Walk with Restart algorithm) is based on a Markov-chain model of random walk through a graph. RWR considers a random walker that starts from node vx who chooses randomly among the available edges every time, except that, before he makes a choice, with probability c he goes back to node vx (restart). Thus, the relevance score of node vx with respect to node vy is defined as the steady-state probability rvx ,vy that the random walker will finally stay at node vy . SimRank [9] also computes a global similarity measure based on the structural context of a network that says “two objects are similar if they are related to similar objects”. Recently, Clauset et al. [3] proposed an algorithm based on the hierarchical network structure. The novelty of our approach compared to existing approaches is as follows: In contrast to global algorithms, such as the Random Walk with Restart (RWR) algorithm [15], the Shortest Path [4, 6] algorithm etc., our method also takes into account local graph features (i.e. the weighted similarity between nodes that may share many edges with others). We selected RWR (reported to present good accuracy results in [12]) and Shortest Path algorithms as representatives of the global algorithms and compared them with our method. As will be shown experimentally later, our method outperforms RWR and Shortest Path. The reason is, they traverse globally the social network, missing to capture adequately the local graph characteristics. In contrast to local similarity measures, such as FOAF [2] algorithm (also known as the Common Neighbors index [13]), the Adamic/Adar [1] index etc., we take into account also global graph features (i.e. paths connecting any pair of nodes in an OSN). We have compared our method against FOAF algorithm and Adamic/Adar index, as representatives of the local-based measures. As will be shown experimentally later, our method outperforms FOAF and AdamicAdar index. The reason is, we do not take into account only pathways of length 2 to compute similarity between a pair of nodes in an OSN. Instead, we use an extensive similarity measure that takes into account transitive node similarity. Apart from the aforementioned link prediction algorithms, which are based solely on the graph structure, there are alternative methods [14, 7] that also exploit other data sources such as users messages, users ratings, co-authored papers, common tagging etc. However, we focus only on recommendations based on the link structure of an OSN, and thus, we will exclude them from our experimental comparison.
3.
PRELIMINARIES IN GRAPHS
In this section, we present the most important notations and the corresponding definitions used throughout the rest of the paper. Let G be a graph with a set of nodes V and a set of edges E. Every edge is defined by a specific pair of graph nodes (vi , vj ), where vi , vj ∈ V. We assume that the graph G is undirected and un-weighted, thus the graph edges do not have any weights, plus the order of nodes in an edge is not important. Therefore, (vi , vj ) and (vj , vi ) denote the same edge on G. We also assume that the graph G has no multiple edges, thus if two nodes vi , vj are connected with an edge of E, then there is no other edge in E also connecting them.
Finally, we assume that there are no loop edges on G (i.e. a node can not be connected to itself). The graph expressing friendships among users of an OSN, which can be seen in Figure 1, will be used as our running example throughout the rest of the paper. For our calculations, we will use wellknown representations, such as the adjacency matrix An×n , and the incidence matrix Rm×n .
4.
BASIC NODE SIMILARITY MEASURE
In this section, we define a basic node similarity measure to determine the proximity between any pair of neighbor nodes in a graph G. Therefore, if vi and vj are two neighbor connected nodes of G, we define a specific function sim(vi , vj ) that expresses their corresponding similarity in the range [0,1] and has all the required properties (i.e. positivity, reflexivity, symmetry etc.) of a well-defined measure. The more similar the nodes are, the more the value of sim(vi , vj ) will be close to 1. On the contrary, the more dissimilar the nodes are, the more the value of sim(vi , vj ) will be close to 0. To capture proximity between node vectors, we apply the Jaccard Coefficient, which is able to measure the degree of overlap between node vectors, in contrast to other measures (i.e. dot product, Euclidean distance etc.), which cannot measure it. In particular, we use an extension of the Jaccard Coefficient that contains the cosine similarity metric as we have binary vectors. This extension is also called the Tanimoto coefficient [16], and for two binary vectors ri , rj is defined as: ri · rj sim(vi , vj ) = ||ri ||2 + ||rj ||2 − ri · rj By substitution of vector operations between ri , rj in the previous equation with the corresponding values of the incidence matrix R, we derive the following equivalent equation: sim(vi , vj ) = m X
=
m X h=1
R[eh , vi ]2 +
h=1 m X
where deg(vi ) and deg(vj ) are the degrees of nodes vi and vj , respectively. Proof. The fact that (vi , vj ) ∈ / E and (vj , vi ) ∈ / E means that nodes v , v do not share any edges. Thus the term i j Pm h=1 R[eh , vi ] · R[eh , vj ] in Equation 1 is equal to 0 and sim(vi , vj ) = 0. If nodes vi , vj share one edge, then they can not share any Pm other edge as explained in Section 3. Thus, the term 1 is equal to 1. Moreh , vj ] in Equation h=1 R[eh , vi ] · R[e Pm 2 Pm 2 over, the terms h=1 R[eh , vi ] , h=1 R[eh , vj ] are equal to the degrees of nodes vi , vj , respectively. In that case we have: 1 sim(vi , vj ) = , deg(vi ) + deg(vj ) − 1 and the theorem has been proved. Henceforth, Theorem 1 will be used in defining our basic similarity measure, which is based on the inverse sum of node degrees. However, someone could suggest the usage of any other local-based similarity measure [12] as described in Section 2. For this reason, our basic measure will be later experimentally compared with other measures, which are also based on the nodes degree and the preferential attachment process [12]: the sum of nodes degree and the product of nodes degree. Now, let us calculate some similarity values on the graph of Figure 1 using Equation 1. The similarity between nodes 1 v1 and v2 is: sim(v1 , v2 )= 5+2−1 = 61 =0.16. The similarity 1 between nodes v2 and v4 is: sim(v2 , v4 )= 2+3−1 = 14 =0.25. Thus, the similarity score between nodes v1 , v2 is less than that of v2 , v4 because the degree of node v1 is greater than that of v4 , whereas v1 shares only one of its total 5 edges. Collecting all similarity values between the nodes of a graph G, we construct the basic node similarity matrix S of G, which is an n × n matrix having n rows and n columns labeled by the graph nodes. The basic node similarity matrix values are defined as follows:
R[eh , vi ] · R[eh , vj ] R[eh , vj ]2 −
h=1
m X
S[vi , vj ] = sim(vi , vj )
R[eh , vi ] · R[eh , vj ]
h=1
(1) Pm
Note that the term h=1 R[eh , vi ] · R[eh , vj ] in the final derived equation, expresses the number of edges that Pm 2 the h=1 R[eh , vi ] , Pm nodes vi , v2j share, whereas the terms h=1 R[eh , vj ] are equal to the degrees of nodes vi , vj respectively. The basic node similarity measure satisfies the positivity property, returning values into the interval [0,1]. Note that the maximum value of similarity (equal to 1) can be reached, when the two nodes are connected with only one edge and have no connections with other nodes. Moreover, Equation 1 can be simplified by using Theorem 1. Theorem 1. If the basic node similarity measure of Equation 1 is applied in a graph G satisfying all mentioned assumptions of Section 3, then it is equivalent with the following Equation: ( 0, if (vi , vj ) ∈ / E∧(vj , vi ) ∈ /E sim(vi , vj ) = 1 , otherwise deg(vi )+deg(vj )−1
In our running example, the basic node similarity matrix is depicted in Figure 2, where all values are rounded to the third decimal digit. As shown, user v9 is more similar with user v8 than user v4 . This is reasonable, because user v4 is connected with 2 other nodes (v2 and v3 ), while user v8 is connected with only 1 other node (v1 ). V1
S
ª1 «0.167 « «0.167 « «0 «0.167 « «0.167 «0 « «0.167 «0 ¬
V2
V3
V4
V5
V6
V7
V8
0.167 1 0 0.25 0 0 0
0.167 0 1 0.25 0 0 0
0 0.25 0.25 1 0 0 0
0.167 0 0 0 1 0 0.333
0.167 0 0 0 0 1 0.333
0 0 0 0 0.333 0.333 1
0 0
0 0
0 0.25
0 0
0 0
0 0
º » » » » » » » » » » 1 0.333 » » 0.333 1 ¼ 0.167 0 0 0 0 0 0
V9
0 0 0 0.25 0 0 0
Figure 2: Basic Node Similarity Matrix.
V1 V2 V3 V4 V5 V6 V7 V8 V9
4.1
Transitive Node Similarity Measure
Based on Theorem 1, the similarity values between all non-neighbor nodes in a graph G are zero. For instance, in our running example, the similarity value between nodes v1 and v4 is zero, because they do not share any edge. However, users v1 and v4 have both user v2 as a common friend, and thus they could be related in some way. By using a transitive similarity we can efficiently solve this problem. In our method, we define a transitive node similarity, between two nodes vi and vj , denoted as extended similarity. Extended similarity is calculated by the product of the basic similarities between the nodes of the shortest path from vi to vj . This shortest path expresses the minimum number of edges required to connect the two nodes, as all edges of graph G are not weighted. Therefore, we define the following extended node similarity measure for any two nodes of G: 0, if there is no path between vi , vj sim(vi , vj ), if vi , vj are neighbors esim(vi , vj ) = Y k sim(vph , vph+1 ), otherwise h=1
(2) where vp1 =vi , vpk+1 =vj and the nodes vph (for h=2,. . .,k) are all the intermediate nodes that the shortest path from vi to vj passes through. Note that, in case that vi , vj are neighbor nodes, the shortest path between them is the single edge connecting them, and this explains why esim(vi , vj ) = sim(vi , vj ). In our running example, according to the previous definition, the extended similarity between nodes v1 and v4 using Equation 2 equals: 1 1 1 · = = 0.042 6 4 24 as the shortest path between v1 , v4 is: v1 → v2 → v4 (the alternative path v1 → v3 → v4 has the same length and the same similarity score since nodes v3 and v2 have equal degrees). Note that the extended similarity score between nodes v1 , v4 is less than the basic similarity score of v1 , v2 (0.167) and v2 , v4 (0.25). Collecting all the extended similarity values between the nodes of a graph G, we construct the extended node similarity matrix ES of G. It is a matrix which has the same dimensionality and structure with the basic node similarity matrix S. Its values are defined as follows: sim(v1 , v4 ) = sim(v1 , v2 ) · sim(v2 , v4 ) =
ES[vi , vj ] = esim(vi , vj ) In our running example, the extended node similarity matrix is depicted in Figure 3, where all values are rounded to the third decimal digit. It is important to note that using the extended node similarity in a connected graph, such as the graph G of our running example, all values of ES will be positive numbers (non-zero values). This is due to the fact that there is always a shortest path between any pair of node of a connected graph.
4.2
The FriendTNS Algorithm
In this section, we present the proposed algorithm, denoted as FriendTNS (Friend Transitive Node Similarity), we analyze its steps, provide implementation details and discuss its time and space complexity.
V1
ES
ª1 «0.167 « «0.167 « «0.042 «0.167 « «0.167 «0.056 « «0.167 «0.056 ¬
V2
V3
V4
V5
V6
V7
V8
V9
0.167 0.167 0.042 0.167 0.167 0.056 0.167 0.056 ºV1 1 0.028 0.25 0.028 0.028 0.009 0.028 0.062 »»V2 0.028 1 0.25 0.028 0.028 0.009 0.028 0.062 »V3 » 0.25 0.25 1 0.007 0.007 0.002 0.083 0.25 »V4 0.028 0.028 0.007 1 0.028 0.333 0.028 0.009 »V5 » 0.028 0.028 0.007 0.028 1 0.333 0.028 0.009 »V6 0.009 0.009 0.002 0.333 0.333 1 0.009 0.003 »V7 » 0.028 0.028 0.083 0.028 0.028 0.009 1 0.333 »V8 »V9 0.062 0.062 0.25 0.009 0.009 0.003 0.333 1 ¼
Figure 3: Extended Node Similarity Matrix.
The basic task of the FriendTNS algorithm is simple: to compute the similarities from a specific node (user) v0 to all other nodes (users) in a graph, using our basic and extended node similarity measures. The algorithm input is the graph G, the node v0 , which represents the target user that will take friend recommendations and the number r of friends that will be recommended to him. The output is the recommendations array recom[r]. Firstly, FriendTNS initializes the arrays and computes all node degrees from the graph data. Then, it computes all similarities for the target user v0 in an array s[n]. It uses the formula of Theorem 1, if the examined node vi is a neighbor of v0 . Otherwise, it uses Equation 2. Friends can be recommended to v0 according to their weights in s[n]. Therefore, we sort the similarity list s[n], we keep an index ind[n] for the corresponding node ID’s, and we recommend the top-r nodes (users), which are not already friends of v0 . In our running example, user v8 would receive user v4 as friend recommendation, because his similarity score (0.083) is greater than the similarity score of users v2 , v3 , v5 , v6 (0.028). Note that the similarity values of the neighbor nodes of v8 (and v8 itself) are ignored as these are already friends of the target user v8 . The resulting recommendation is reasonable, due to the fact that user v9 (which is responsible for recommending user v4 to target user v8 ) does not share many edges with others. In contrast, user v1 (which is responsible for recommending users v2 , v3 , v5 , v6 to target user v8 ) shares many edges with others. Thus, our FriendTNS algorithm is able to capture the associations among the graph nodes. FriendTNS keeps the graph nodes and edges in memory using an adjacency list representation, which requires an O(n+m) space, where n is the total number of nodes and m is the total number of edges. All other arrays (s, ind, recom) require O(n) space. Therefore, our FriendTNS total space complexity is O(n + m) + 4O(n) = O(n + m). For FriendTNS’s similarity calculations, we use the oneto-all nodes shortest path algorithm of Fredman-Tarjan [6], which has a complexity of O(m + n log n), and when occurs an update into the shortest path tree of the graph, we immediately update the transitive similarity values on-the-fly. Therefore, the computational complexity of FriendTNS is O(m + n log n).
4.3
Extending FriendTNS for Signed Networks
In this Section, we derive variants of FriendTNS that apply to directed networks and networks with weighted edges,
including the case of edges with negative weights (signed networks). In signed networks edges have positive (+1) as well as negative (-1) weights. Such signed graphs arise for instance in social networks (i.e. Epinions.com, Shashdot Zoo, etc.) where negative edges denote enmity instead of friendship. In such signed graphs, FriendTNS’s basic similarity measure of Theorem 1, which is the inverse of the sum of nodes’ degree, can be adjusted accordingly based on the Status theory [10, 11]. Based on Status theory [10, 11], the positive nodes’ in+ − degree degin (x) and the negative nodes’ in-degree degout (x) of a node x increase its status. In contrast, the positive + nodes’ out-degree degout (x), and the negative nodes out− degree degin (x) decrease its status. In the following, our basic similarity measure is transformed, so that it can take into account the aforementioned properties of Status The+ 1 , where σ(x) = degin (x) + ory: sim(vi , vj ) = σ(vi )+σ(v j )−1
− + − degout (x) − degout (x) − degin (x). As already stated, in networks with negative edge weights the concept of transitivity has to take into account negative values. Thus, for our extended similarity measure of Theorem 2, if some edges have negative weight, the total weight of a shortest path can be calculated as the product of the edges’s weights, based on the assumption of multiplicative transitivity of the structural balance theory [8, 11], as formulated in the graph-theoretic language by Hage and Harary (1983). Structural balance theory considers the possible ways in which triangles on three individuals can be signed. Triangles with three positive signs exemplify the principle that “the friend of my friend is my friend”, whereas those with one positive and two negative edges capture the notions “the enemy of my friend is my enemy”, “the friend of my enemy is my enemy”, and the “enemy of my enemy is my friend”.
5.
EXPERIMENTAL EVALUATION
In this section, we compare experimentally our approach with existing friend recommendation algorithms. Henceforth, our proposed approach is denoted as FriendTNS. We use in the comparison the Random Walk with Restart [15] algorithm, the Shortest Path[4] algorithm, the Adamic and Adar [1] algorithm and the Friend of a Friend [5] algorithm, denoted as RWR, Shortest Path, Adamic/Adar and FOAF, respectively. Our experiments were performed on a 3 GHz Pentium IV, with 2 GB of memory. All algorithms were implemented in C. To evaluate the examined algorithms, we have generated synthetic data sets and chosen three real data sets from the Facebook, Hi5, and Epinions web sites.
5.1
Real Data Sets
We used the Epinions4 data set, which is a who-trustswhom social network. In particular, users of Epinions.com express their Web of Trust, i.e. reviewers whose reviews and ratings they have found to be valuable. It contains 49K users and 487K edges among pair of users. Moreover, we crawled the Facebook website on the 30th of October, 2009. Our data crawling method was the following: For each user u, we traverse all his friends and then traverse the friends of each of u’s friends etc. We created a data set with 3694 users, denoted as Facebook 3.7K. Moreover, from the Hi5 4
http://www.trustlet.org/wiki/Downloaded Epinions dataset
web site, we crawled 63329 users and all of their friends, denoted as Hi5 63K 5 , available from the Hi5 site on the 15th of April, 2009. Finally, we also use in our comparison the extended Epinions 132K data set, which consist of positive and negative edges. A positive edge implies friendship/trust whereas a negative edge implies enmity/distrust.
5.2
Generation of Synthetic Data Sets
In contrast to purely random (i.e., Erdos-Renyi) graphs, where the connections among nodes are completely independent random events, our synthetic model ensures dependency among the connections of nodes, by characterizing each node with a ten-dimensional vector with each element a randomly selected real number in the interval [−1, 1]. This vector represents the node’s intrinsic features such as the profile of a person. Two nodes are considered to be similar and thus of high probability to connect to each other if they share many close attributes. Given a network size N and the degree k of each node, we start with an empty network with N nodes. At each time step, a node with the smallest degree is randomly selected (there is more than one node having the smallest degree). Among all other nodes whose degrees are smaller than k, this selected node will connect to the most similar node with probability 1 − p, while a randomly chosen one with probability p. This process will be terminated when all nodes are of degree k. The parameter p ∈ [0, 1] represents the strength of randomness in generating links, which can be understood as noise or irrationality that exists in almost every real system. Based on the above procedure, we have created 2 synthetic data sets based on different network sizes N (1000, 100000), with k nodes degree equal to 10 for the first synthetic data set and with k equal to 100 for the second synthetic data set, whereas p is equal to 0.2 for both data sets. We calculated several topological properties of the synthetic and real data sets which are presented in Figure 4. TOPOLOGICAL PROPERTIES: N = total number of nodes E = total number of edges ASD = average shortest path distance between node pairs ADEG = average node degree LCC = average local clustering coefficient GD = graph diameter (maximum shortest path distance) Data-Set Facebook 3.7K Hi5 63K Epinions 49K Synthetic (N=1000, k=10) Synthetic (N=100000, k=100) Epinions 132K
Type N E ASD ADEG LCC GD Undirected 3694 13692 3.73 7.41 0.32 10 Undirected 63329 88261 7.18 2.78 0.02 19 Directed 49288 487183 4.01 19.76 0.26 14 Undirected 1000 5000 2.81 10 0.01 4 Undirected 100000 5000000 3.56 100 0.001 16 Signed 131828 841372 1.78 6.38 0.24 14
Figure 4: Topological properties of the real and synthetic data sets. As shown in Figure 4, Epinions 49K and Facebook 3.7K present (i) a large clustering coefficient (LCC), and (ii) a small average shortest path length (ASD). These topological features can be mainly discovered in small-worlds networks. Small-world networks have sub-networks that are characterized by the presence of connections between almost any two nodes within them (i.e. high LLC). Moreover, most pairs of nodes are connected by at least one short path (i.e. small ASD). 5 Our Facebook and Hi5 data sets are available in our web site: http://delab.csd.auth.gr/∼symeon
100
Inverse Sum of Nodes Degree Sum of Nodes Degree
80
Adamic/Adar 0,8
Product of Nodes Degree 0,8
40
Pure Chance
AUC
60
0,7
0,4
0,4
0,4
0,6
Fraction of Edges observed
0,8
1
Pure Chance
0,5
0,5
0
FOAF
0,7 0,6
0,6
20
0,2
Shortest Path
0,9
AUC
Precision
RWR 0,9
Sum of Nodes Degree
Product of Nodes Degree
0
FriendTNS
1 Inverse Sum of Nodes Degree
1
0
0,2
0,4
0,6
0,8
p (strength of model randomness/noise)
(a)
(b)
1
0
0,2
0,4
0,6
0,8
1
Fraction of Edges observed
(c)
Figure 5: (a) Precision vs. different basic similarity measures for the synthetic 1K data set. (b) AUC vs. p strength of graph model randomness for the synthetic 1K data set. (c) Comparison of FriendTNS, RWR, Shortest Path, Adamic/Adar, FOAF and the pure chance algorithm for the Epinions 49K data set. In contrast, as also shown in Figure 4, Hi5 63K has a very small LLC (0.02) and a quite big ASD (7.18). In other words, Hi5 data set can not be considered as a small-world network, since (i) most of its nodes can not be reached from every other by a small number of hops or steps and (ii) does not have sub-networks that are a few edges shy of being cliques.
If all similarity values are generated from an independent and identical distribution, the accuracy should be about 0.5. Therefore, the degree to which the accuracy exceeds 0.5 indicates how much better the algorithm performs than pure chance.
5.3
In this Section, we study the sensitivity of FriendTNS in terms of accuracy performance. In particular, we test how the performance of FriendTNS is affected, when (i) it is combined with different basic similarity metrics, (ii) it runs on synthetic data sets with different controllable sparsity, and (iii) it runs with different graph model randomness. As the basic similarities of our proposed algorithms are calculated using the inverse sum of node degrees (Theorem 1), it is very interesting to compare the precision of our basic similarity measure with the corresponding precision of two other similarity measures, which are based on preferential attachment process [12]: the sum of node degrees and the product of node degrees. The basic premise of preferential attachment is that the probability that a new edge involves node vi is proportional to current number of neighbors of vi . Thus, we used the three aforementioned measures to calculate the extended similarities of FriendTNS algorithm for the synthetic 1K data set and then, we computed the precision attained by each measure vs. the fraction of observed links used in the training set (p parameter is fixed to 0.2). Figure 5(a) depicts the results. We observe that the inverse sum of nodes degree measure outperforms both other measures. The same result holds for the 100K synthetic data set, but we do not present it due to lack of space. In the following, we adopt the inverse sum of nodes degree measure as the default basic similarity measure of FriendTNS. Notice also that, as we increase the fraction of observed edges, the precision of all algorithms is increased too. This is reasonable, since every prediction algorithm is expected to give higher accuracy for a denser network. In our synthetic model, the parameter p ∈ [0, 1] represents the strength of randomness in generating links. Next, we test FriendTNS’s sensitivity with different graph model randomness. As shown in Figure 5(b), when the strength of randomness is weak, the inverse sum of nodes degree performs better than the other metrics. However, as the strength of randomeness becomes high all metrics cannot perform better than pure chance.
Experimental Protocol and Evaluation
Our evaluation considers the division of friends of each target user into two sets: (i) the training set E T is treated as known information and, (ii) the probe set E P is used for testing and no information in the probe set is allowed to be used for prediction. It is obvious that, E = E T ∪ E P and E T ∩ E P = ® . Therefore, for a target user we generate the recommendations based only on the friends in E T . Each experiment has been repeated 30 times (each time a different training set is selected at random) and the presented measurements, based on two-tailed t-test, are statistically significant at the 0.05 level. All algorithms predict the friends of the target users’ in the probe set. We use the classic precision/recall metric as performance measure for friend recommendations. For a test user receiving a list of k recommended friends (top-k list), precision and recall are defined as follows: Precision is the ratio of the number of relevant users in the top-k list (i.e., those in the top-k list that belong in the probe set E P of friends of the target user) to k. Recall is the ratio of the number of relevant users in the top-k list to the total number of relevant users (all friends in the probe set E P of the target user). Moreover, we use the AUC statistic to quantify the accuracy of prediction algorithms and test how much better they are than pure chance, similarly to the experimental protocol followed by Clauset et al. [3]. AUC is equivalent to the area under the receiver-operating characteristic (ROC) curve. It is the probability that a randomly chosen missing link (a link in E P ) is given a higher similarity value than a randomly chosen non-existent link (a link in U − E T , where U denotes the universal set). In the implementation, among n times of independent comparisons, if there are n0 times the missing link having higher similarity value and n00 times the missing link and nonexistent link having the same similarity value, we define AUC, as follows: AU C = (n0 + 0.5 × n00 )/n.
5.4
FriendTNS Sensitivity Analysis
90
80
Shortest Path
80
70
Adamic/Adar FOAF
50 40 30
80
RWR
70
FOAF
70
Shortest Path
60
Adamic/Adar
60
FOAF
50 40 30
10
10
0
0 10
15
20
25
30
35
40
45
50
FriendTNS
90
Shortest Path
20
5
100
RWR
20
0
FriendTNS
% Precision
60
% Precision
RWR
90
% Precision
100
FriendTNS
100
50
Adamic/Adar
40 30 20 10 0
0
5
10
15
% Recall
(a)
20
25
30
% Recall
(b)
35
40
45
50
0
5
10
15
20
25
30
35
40
45
50
% Recall
(c)
Figure 6: Comparison of FriendTNS, RWR, Shortest Path, Adamic/Adar and the FOAF algorithm for (a) Facebook 3.7K, (b) Epinions 49K and (c) Hi5 63K data sets.
5.5
Precision Comparison with other Methods
In this section we compare FriendTNS with other methods in terms of accuracy. The performance of all tested algorithms should be at least better than the case, where the friend recommendations would be performed by pure chance. Thus, to more meaningfully represent the friend recommendation algorithms’ accuracy performance, we also use as baseline algorithm a pure chance predictor which simply randomly selects pairs of nodes in graph G to be friends. We use the AUC statistic, which looks at an algorithm’s overall ability to rank all the missing connections over nonexisting ones. For the Epinions 49K data set, as shown in Figure 5(c), we plot a curve for AUC vs. the fraction of observed links used in the training set. As shown, FriendTNS does far better than pure chance, indicating that FriendTNS is a strong predictor of missing structure. The main reason is that FriendTNS captures effectively the local and global graph features. Notice that we have also verified the same results for the other real networks (Hi5 and Facebook), but we do not present them due to lack of space. Next, we proceed with the comparison of FriendTNS with RWR, Shortest Path, Adamic-Adar, and FOAF algorithms, in terms of precision and recall. This reveals the robustness of each algorithm in attaining high recall with minimal losses in terms of precision. We examine the top-k ranked list, which is recommended to a target user, starting from the top friend. In this situation, the recall and precision vary as we proceed with the examination of the top-k list. For the Facebook 3.7K data set, in Figure 6(a) we plot a precision vs. recall curve for all algorithms. As expected, all algorithms’ precision falls as k increases. In contrast, as k increases, recall for all algorithms increases as well. FriendTNS attains the best results with impressive high precision. The reason is that FriendTNS exploits global and local features of the social graph by combining the basic with the extended similarity measure. In contrast, RWR traverses only globally the social network, missing to capture adequately the local characteristics of the graph. Moreover, Shortest Path does not take into account the reduced similarity between connected nodes that do not share many edges with others. Furthermore, Adamic/Adar and FOAF algorithms exploit only local features of the social network. The precision of FriendTNS is impressive in this specific data set. The main reason is the topological characteristics of Facebook 3.7K data set. It presents (i) a large cluster-
ing coefficient (LCC) equal to 0.32, and (ii) a small average shortest path length (ASD) equal to 3.73. Thus, Facebook 3.7K can be considered as a small-world network . For the Epinions 49K data set, as shown in Figure 6(b), we also plot precision vs. recall curve for all algorithms. FriendTNS again attains the best results. The precision of FriendTNS is again quite high. Based on its topological features, Epinions 49K can be also considered as a smallworld network, since it presents high LLC and small ASD. For the Hi5 63K data set, as shown in Figure 6(c), we plot precision vs. recall curve for all algorithms. However, the overall performance of FriendTNS, RWR and Shortest Path algorithms is significantly decreased compared with the results in both previous data sets. The main reason is the high sparsity (i.e. very small ADEG equal to 2.78) of the Hi5 data set. Moreover, it has very small LLC and quite big ASD (7.18). In other words, Hi5 data set can not be considered as a small-world network.
5.6
Time Comparison with other methods
In this section, we compare FriendTNS against the RWR, Shortest Path, Adamic/Adar, and FOAF algorithms in terms of time complexity. We have created 2 synthetic data sets based on different network sizes N (1000, 100000), where N is the total number of nodes in the network. For the first synthetic data set the k nodes degree is equal to 10, whereas k is equal to 100 for the second one. All recorded times are refer to the total required time for calculating similarities for a target node with all other nodes in a graph. Each algorithm’s performance is obtained by averaging over 30 independent realizations. Figure 7 depicts the results. As shown, RWR present the worst results because it calculates the inverse of an n × n matrix. As expected, FOAF and Adamic/Adar algorithms, outperform the other algorithms due to their simpler complexity since they are localbased similarity measures. However, as already shown in Section 5.5, both methods perform the worst results in terms of accuracy.
5.7
FriendTNS Efficacy in Signed Networks
In this section, we present the accuracy performance of FriendTNS when we take into account positive and negative links of a signed network, i.e. extended Epinions 132K data set. We have two different variants of FriendTNS: The first variation considers only positive links and is denoted as F riendT N S + . The second variation considers both pos-
Data-Set FriendTNS Shortest Path Adamic/Adar RWR FOAF Synthetic-(N=1000, k=10) 0.012sec 0.011sec 0.003sec 0.017sec 0.002sec Synthetic-(N=100000, k=100) 1.102sec 1.05sec 0.394sec 1.621sec 0.280sec
Figure 7: Time complexity of the synthetic data sets. A smaller value is better. + itive and negative links and is denoted as F riendT N S− . Figure 8 presents the precision and recall diagram for both + versions of FriendTNS. As shown, F riendT N S− outper+ + forms F riendT N S . The reason is that F riendT N S− exploits positive and negative links. This means that if we use information about negative edges for predicting the presence of positive edges we get an accuracy improvement of FriendTNS predictions. These results clearly demonstrate that there is, in some settings, a significant improvement to be gained by using information about negative edges, even to predict the presence or absence of positive edges.
Figure 8: Accuracy performance of FriendTNS in terms of precision/recall.
6.
CONCLUSIONS
In this paper, we proposed the FriendTNS algorithm to provide more accurate friend recommendations. We defined a transitive node similarity measure in OSNs by taking into account local and global features of a social graph. We also derived variants of our method that apply to signed networks. We performed an extensive experimental comparison using the three real social networks (Facebook, Epinions and Hi5 data sets). We have shown that our FriendTNS algorithm provides more accurate friend recommendations compared to existing approaches. In future, we want to improve friend recommendations based on other features that OSNs offer, such as photos and video tagging, and common applications. The combination of such features can provide valuable information and therefore yield to more accurate friend recommendations.
7.
REFERENCES
[1] L. Adamic and E. Adar. How to search a social network. Social Networks, 27(3):187–203, 2005. [2] J. Chen, W. Geyer, C. Dugan, M. Muller, and I. Guy. Make new friends, but keep the old: recommending people on social networking sites. In Proceedings 27th International Conference on Human Factors in Computing Systems (CHI), pages 201–210, 2009.
[3] A. Clauset, C. Moore, and M. E. J. Newman. Hierarchical structure and the prediction of missing links in networks. Nature, 453, 2008. [4] T. Cormen, C. Leiserson, R. Rivest, and S. Stein. Introduction to Algorithms. MIT Press, 3rd edition, 2001. [5] Facebook. Official blog. http://blog.facebook.com/blog.php?post=15610312130. [6] M. Fredman and R. Tarjan. Fibonacci heaps and their uses in improved network optimization algorithms. Journal of the ACM, 34:596–615, 1987. [7] J. Golbeck. Personalizing applications through integration of inferred trust values in semantic web-based social networks. In Semantic Network Analysis Workshop at the 4th International Semantic Web Conference, 2005. [8] P. Hage and F. Harary. Structural models in anthropology. 56, 1983. [9] G. Jeh and J. Widom. Simrank: a measure of structural-context similarity. In KDD ’02: Proceedings of the eighth ACM SIGKDD international conference on Knowledge discovery and data mining, pages 538–543, 2002. [10] J. Leskovec, D. Huttenlocher, and J. Kleinberg. Predicting positive and negative links in online social networks. In WWW ’10: Proceedings of the 19th international conference on World wide web, pages 641–650, 2010. [11] J. Leskovec, D. Huttenlocher, and J. Kleinberg. Signed networks in social media. In CHI ’10: Proceedings of the 28th international conference on Human factors in computing systems, pages 1361–1370, 2010. [12] D. Liben-Nowell and J. Kleinberg. The link prediction problem for social networks. Proceedings of the 12th International Conference on Information and Knowledge Management (CIKM), 2003. [13] L. Liben-Nowell, J. Novak, R. Kumar, P. Raghavan, and A. Tomkins. Geographic routing in social networks. Proceedings National Academy of Sciences (PNAS), 102(33):11623–11628, 2005. [14] P. Massa and P. Avesani. Trust-aware collaborative filtering for recommender systems. In In Proc. of Federated Int. Conference On The Move to Meaningful Internet: CoopIS, DOA, ODBASE, pages 492–508, 2004. [15] J. Pan, H. Yang, C. Faloutsos, and P. Duygulu. Automatic multimedia cross-modal correlation discovery. In Proceedings 10th ACM SIGKDD International Conference on Knowledge Discovery and Data Mining (KDD), pages 653–658, Seattle, WA, 2004. [16] T. Tanimoto. IBM Internal Technical Report, 1957.