Two-Stage Clustering with k-Means Algorithm Raied Salman*, Vojislav Kecman, Qi Li, Robert Strack, and Erick Test Virginia Commonwealth University, Computer Science Department, 601 West Main Street Richmond, VA 23284-3068
[email protected]
Abstract. -means has recently been recognized as one of the best algorithms for clustering unsupervised data. Since the -means depends mainly on distance calculation between all data points and the centers then the cost will be high when the size of the dataset is big (for example more than 500MG points). We suggested a two stage algorithm to reduce the cost of calculation for huge datasets. The first stage is fast calculation depending on small portion of the data to produce the best location of the centers. The second stage is the slow calculation in which the initial centers are taken from the first stage. The fast and slow stages are representing the movement of the centers. In the slow stage the whole dataset can be used to get the exact location of the centers. The cost of the calculation of the fast stage is very low due to the small size of the data chosen. The cost of the calculation of the slow stage is also small due to the low number of iterations. Keywords: Data Mining, Clustering, -means algorithm, Distance Calculation.
1 Introduction No theoretical research work available on the running time was required for the means to achieve its goals as mentioned by [1]. They researched the worst-case running time scenario as superpolynomial by improving the lower bound from Ω iterations to 2Ω √ . [9] has developed another method to reduce the number of iterations but it was not as fine-tuned as [1]. On the other hand [4] have proved that the number of iterations required by -means is much less than the number of points. Moreover, [5] were unable to bound the running time of -means, but they proved that for every reclassified point one iteration is required. Then after convergence will be guaranteed.
Δ
iterations the
A group of researchers worked on choosing the best centers to avoid the problems of Means of either obtaining the non-optimal solutions or empty clusters generations. [3] worked on modifying the -means to avoid the empty clusters. They moved the center of every cluster into new locations to ensure that there will be no empty clusters. The comparison between their modified -means and the original -means show that the number of iterations is higher with the modified -means method. In case of the numerical *
Corresponding author.
A. Özcan, J. Zizka, and D. Nagamalai (Eds.): WiMo/CoNeCo 2011, CCIS 162, pp. 110–122, 2011. © Springer-Verlag Berlin Heidelberg 2011
Two-Stage Clustering with k-Means Algorithm
111
examples which produce empty clusters, the proposed method cannot be compared with any other method since there is no modified -means algorithm available to avoid the empty clusters. [6] on the other hand developed a procedure in which the centers have to pass a refinement stage to generate good starting points. [7] used genetically guided means where the possibility of empty clusters will be treated in the mutation stage. Another method of center initializing based on values of attributes of the dataset is proposed by [8]. The later proposed method creates a complex procedure which leads to be computationally expensive. [2] on the other hand, developed a method to avoid unnecessary distance calculations by applying the triangle inequality in two different ways, and by keeping track of lower and upper bounds for distances between points and centers. This method is effective when the dimension is more than 1000 and also when the clusters are more than 20. They claimed that their method is many times faster than normal means method. In their method the number of distance calculations is instead of where is the number of points and are the number of clusters and the number of iterations respectively. [9] In contrast, Hodgson used different triangular equality to achieve the goal, in which they reduced the number of distance calculations.
2 Theoretical Background and the Proposed Method Simple modifications of -means clustering method have been proposed. The theoretical background of the proposed method is described below: The main idea behind -means is to calculate the distance between the data point and the centers using the following formula: /
,
Where the Euclidean distances between the data point initial centers are . The points in one cluster are defined as:
(1) at the cluster
and the
for 1,2, … , regarded as one cluster and is the total number of points in that cluster. The chosen randomly either from the dataset or arbitrarily. In our method we have used the random selection of the centers from the dataset to avoid wasting one more calculation (iteration). Any -means clustering method depends on the number of clusters set at the beginning. There is no guarantee that the centers will move or converge to the mean points of the average of the cluster. This is one of the drawbacks of -means. Also there is no guarantee that the convergence will happen to the local mean. Assume that is the set of clusters to minimize the criteria . ; so that converges to (the cluster centers): , where where
,
,…,
;
,…, min |
(2) |
is the probability distribution over the Euclidean space.
(3)
112
R. Salman et al.
If the represents the entire dataset then the objective is to find a subset of such that . We assume that the data with one center is a stationary random sequence satisfying the following cumulative distribution sequence: ,
,…,
,
,…,
,
,…,
,
,…,
(4)
then the above sequence has one mean: (5) The process of clustering is equivalent to minimizing the Within-Cluster Sum of Squares for the, so called, fast stage: min
(6)
and for the so called, slow stage, as follows: min
(7)
where are the centers of the clusters which are equals to the centers of the previous stage. The within cluster sum of squares is divided into two parts corresponding to the fast and the slow stages of the clustering: ,
,
(8)
The centers of the slow stage start with
3 The Results The complexity of the -means is where is the number of clusters, is the number of iteration required to get to the stopping criteria and is the input patterns. For example if the data size is 1000 points, 4 clusters and it require 20 iterations to get the optimal locations of the centers. Then, 80,000 is the time complexity. The time complexity in the proposed method has two folds, first is time complexity of the fast stage of clustering: where is the number of data for the fast stage and is the iterations during the fast stage only. The second part of the time complexity is calculated according to the slow stage of clustering: where is the number of
Two-Stage Clustering with k-Means Algorithm
iterations during the slow stage. Assume that complexity is: =
7200
100 and 8000 =
113
3 then the total time 15200
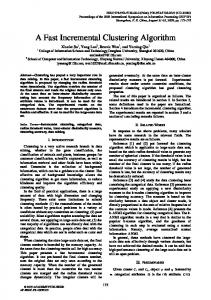
This will represent a reduction in the calculation time for the clustering of more than 5 times. However, if the data is bigger than the previous figure then the time reduction will be higher. For example if the data is 1Million the reduction will be approximately 10 times. This is quite well illustrated in the following diagram:
Fig. 1. Complexity measure of the k-means and the modified k-means with 100 samples
The and are the fast iterations and the slow iterations of the modified means. Respectively. The black graph in Fig. 1 is the time complexity of the normal -means. Other graphs represent the complexity of the modified -means. Therefore the more the graphs will approach the normal -means the higher the value of the properties. From the above graph it can be concluded that the lower values of less time required to achieve total clustering. The more iterations, for the fast stage, the faster the algorithm works. However, the catch here is we cannot go very low with as the time of the clustering will approach the normal -means. In other words the clustering procedure will produce blank clusters. The proper percentage would be 10% - 20%. The set up of the parameters of the red graph of the above diagram has a complexity of almost 5 times less than the normal -means clustering. In the case of 500, the complexity using higher number of data for the fast stage clustering, results will be skewed upwards as shown below:
114
R. Salman et al.
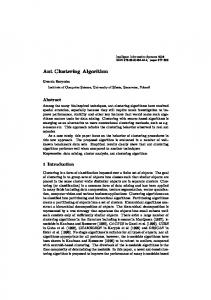
Fig. 2. Complexity measure of the k-means and the modified k-means with 500 samples
The set up of the parameters of the red graph of the above diagram has complexity less than 2 times than the normal -means clustering. This indicates that the more the data chosen for the fast stage of clustering the less advantages of this method.
4 Numerical Examples Two examples presented here to validate the proposed method. 1- A data set with 800 samples and 2-dimension (3 clusters) is used. The following figures show the movement of one of the centers and the two stage clustering. 2- From Figs. 3 and 4 it is very clear that the approach of the red line (slow stage coordinate of one center) is very smooth comparing with the other fast stage coordinate movements. The first value of the red (slow) graph is the same as the last value of the blue (fast) graph. The number of iterations is higher than is required but this is only for clarification. The number of iterations required for the fast stage will of course be higher than the slow stage scheme. Moreover, as you can see from the above graph, the coordinates have not been changed a lot. This means that the -means algorithm does not need to run many times since we reached the correct accuracy. Another presentation of the effectiveness of the method is the movements of the three centers as shown in figures 5-8.:
The following algorithm describes briefly the proposed procedure:
Two-Stage Clustering with k-Means Algorithm
Algorithm. , , , , Input: Output: with clusters % of from randomly Select While For 1 Calculate the modified distance , Find minimum of Assign the cluster number to point End for Calculate End while Calculate the average of the calculated clusters to find new centers Use the whole dataset While For 1 Calculate the modified distance , Find minimum of Assign the cluster number to point End for Calculate End while
Fig. 3. Fast and Slow stages of the movement of one coordinate during the clustering
115
116
R. Salman et al.
Fig. 4. Fast and Slow stages of the movement of the second coordinate during the clustering
Fig. 5. Three center movement during the fast stage clustering
Two-Stage Clustering with k-Means Algorithm
117
A more detailed description is shown in the following figures in which the fast stage shows the squares and the slow stage shows the diamond symbol:
Fig. 6. Fast and slow stages of the first cluster center movements
Fig. 7. Fast and slow stages of the second cluster center movements
118
R. Salman et al.
Fig. 8. Fast and slow stages of the third cluster center movements
As can be seen from the above diagrams, that the centers have moved many steps during the fast stage, this has been achieved in fast response. The diamond shapes shows the slow stage of iteration. The number of iterations of the slow stage is much less than the fast stage. Also the movements of the centers are very small. In this case the required calculation would be reduced from many steps to only couple of full step (for all dataset). This of course will save some time and reduce expenses. To be more specific about the proposed method Table 1 shows the creation of clusters in different iterations for three dimensional data. Table 1. Distribution of points and centers during the fast and the slow stages of clustering Iter No.
1 Fast 2
Clusters Old Centers
New Centers
C1
8
4
4
4.867
3.267
1.567
C2
4
4
4
6.16
2.85
4.68
C1
4.867
3.267
1.567
4.867
3.267
1.567
C2
6.16
2.85
4.68
6.16
2.85
4.68
Points in Clusters 30,38,44 53,58,72 86,88,93 113,114 138,145 30,38,44 53,58,72 86,88,93 113,114 138,145
Points
15
Two-Stage Clustering with k-Means Algorithm
119
Table 1. (continued) C1
4.867
3.267
1.567
5.015
3.318
1.636
C2
6.16
2.85
4.68
6.323
2.901
4.987
C1
5.015
3.318
1.636
5.06
3.226
1.897
C2
6.323
2.901
4.987
6.396
2.933
5.071
C1
5.06
3.226
1.897
5.083
3.205
1.956
1
2
Slow
3
C2
6.396
2.933
5.071
6.409
2.942
5.1
C1
5.083
3.205
1.956
5.083
3.205
1.956
C2
6.409
2.942
5.1
6.409
2.942
5.1
4
1-50,58 61,82,94 99 51-57,5960 62-81 83,93 95-98 100-150 1-50,54,58 60-61,70 80-82,90 94,99,107 51-53,5557 59,62-69 71-79 83-89 91-93 95-98 100-106 108-150 1-50,54,58 60-61 63 65,70,8082 90,94 99,107 51-53,5557 59,62,64 66-69,7179 83-89,9193 95-98 100-106 108-150 1-50,54,58 6061,63,65 70,8082,90 94,99,107 51-53,5557 59,62 64,66-69 71-79 83-89 91-93,9598 100-106 108-150
150
120
R. Salman et al.
The two stages are clearly indicating the formation of clusters at each stage. The centers of the slow stage are the same as the centers of the end of the fast stage. The fast stage has taken only 10% of the whole dataset. Although the number of iterations of the slow stage is 4, in bigger dataset this can be reduced by increasing the iterations of the fast stage.
5 Speed Up Analysis The speed of the normal -means is shown in blue while the speed of the modified means is shown in red. Two different computers were used of 32bit and 64bit Operating Systems. Regardless, of the speed of the computer used the validation of the modified -means always consistent as indicated by Fig. 9. The data used for the fast stage clustering is only 10%of the whole data which is randomly selected. The dataset used in this example is “Synthetic” which is 100,000 samples with 10 dimensions. The speed of the modified -means is almost twice the speed of normal -means. This is due to the fact that 2-stage -means clustering uses less full data iterations. The speed up is very clear in the high accuracy when the required µ is 10 or less, where µ is the stopping criteria or the required accuracy. This is always important when you try to find good clustering results.
Fig. 9. Comparison in the speed of the modified -means and normal -means with different computers
The speed up of the modified -means comparing with the normal -means is varying according to the accuracy. For the lower range of accuracy the speed up of
Two-Stage Clustering with k-Means Algorithm
121
clustering is ranges from (1-9) times. This would reduced for the higher accuracy for example from 10 to 10 . Figure 9 shows clearly that the speed up is settled for the higher accuracy within 2 times. On the other hand the range of the random data selected to archive the fast clustering is also fluctuating. The best range is between 10%-20%. In the normal situation we require a good accuracy for the clustering to archive the full clustering to all data. This would be between 10%-20% of the data and accuracy between 10 to 10 as shown in Table 2. Table 2. Speed up of clustering with the modified k-means using different dataset sample
Accuracy
percentage of the total data 10%
15%
20%
30%
40%
10
1.9
1.8
1.8
1.7
1.5
10
3.8
3.5
3.4
3
2.5
10
4.7
8.9
3.1
7
4.3
10
1
1.7
1.1
3
8.5
10
2.9
1.6
2.2
2.1
2.4
10
2
1.9
2.6
2.3
2.4
10
2
1.4
2.4
2.3
1.6
10
2
1.4
2.4
2.3
1.6
10
2
1.4
2.4
2.3
1.6
10
2
1.4
2.4
2.3
1.6
The proper range of the sample data is between 10%-20%. Carrying out the required time for running the normal -means and the modified -means for 9 different data samples shows that the best range is 10%-20% to get less time in the calculation of the two algorithms as shown in Table 3.
Percentage of the data
Table 3. Calculation time for normal kmeans and modified kmeans
10% 20% 30% 40% 50% 60% 70% 80% 90%
Fast + Slow k-means (sec) 4.81 9.93 14.94 19.95 25.17 30.45 36.62 42.01 47.66
Normal k-means (sec) 14.3 14.3 14.3 14.3 14.3 14.3 14.3 14.3 14.3
122
R. Salman et al.
6 Conclusion A simple proposal for achieving high speed of -means clustering for ultra dataset has been presented in this paper. The idea has two folds. The first is the fast calculation of the new centers of the -means clustering method. A small part of the data will be used in this stage to get the final destination of the centers. This of course will be achieved in high speed. The second part is the slow stage in which the -means will start from well positioned centers. This stage may take couple of iteration to achieve the final clustering. The whole dataset will be used for the second stage. In normal -means algorithm if the initial centers are exactly located at the means of the clusters of the data, then the algorithm requires only one step to assign the individual clusters to each data point. In our modified -means we are trying to get to that stage of moving any initial centers to a location which is either the locations of the means or near it. The big the difference between these locations will decide on how many times the normal -means required to run to assign all data to their clusters. Our algorithm will move the centers fast to the locations which are near the means. Future work is required to find out the effect of different locations of the clusters on the speed up.
References 1. Arhter, D., Vassilvitskii, S.: How Slow is the kMeans Method? In: SCG 2006, Sedona, Arizona, USA (2006) 2. Elkan, C.: Using the Triangle Inequality to Accelerate K –Means. In: Proceedings of the Twentieth International Conference on Machine Learning (ICML-2003), Washington DC (2003) 3. Pakhira, M.K.: A Modified k-means Algorithm to Avoid Empty Clusters. International Journal of Recent Trends in Engineering 1(1) (May 2009) 4. Dude, R.O., Hart, P.E., Stork, D.G.: Pattern Classification. Wiley-Interscience Publication, Hoboken (2000) 5. Har-Peled, S., Sadri, B.: How fast is the k-means method? Algorithmica 41(3), 185–202 (2005) 6. Bradley, P.S., Fayyad, U.M.: Refining Initial Points for Kmeans Clustering. Technical Report of Microsoft Research Center. Redmond,California, USA (1998) 7. Wu, F.X.: Genetic weighted k-means algorithm for clustering large-scale gene expression data. BMC Bioinformatics 9 (2008) 8. Khan, S.S., Ahmed, A.: Cluster center initialization for Kmeans algorithm. Pattern Recognition Letters 25(11), 1293–1302 (2004) 9. Hodgson, M.E.: Reducing computational requirements of the minimum-distance classifier. Remote Sensing of Environments 25, 117–128 (1988)