vector machine is employed to classify the wavelet coefficients of the AC resistive signal. ..... BURGES, C.J.C.: 'A tutorial on support vector machines for pattern.
Identification of CO and NO2 using a thermally resistive microsensor and support vector machine S. AI-Khalifa, S. Maldonado-Bascon and J.W. Gardner
Abstract: Levels of carbon monoxide and nitrogen dioxide in air are currently monitored using two different thick-film resistive gas sensors. The resultant high power consumption of thick-filmbased gas sensors is problematic for portable multi-gas monitors. The use of a single low-power thermally-modulated resistive gas sensor to monitor simultaneously both gases is reported. The silicon micromachined substrate not only reduces the D C power consumption to 100mW at 300°C but also permits AC temperature modulation through a small thermal mass. Uniquely, a support vector machine is employed to classify the wavelet coefficients of the AC resistive signal. This simple method permits the rapid classification of CO/N02 gas mixtures with a high level of confidence (94% or better) using just one low-power gas microsensor. Thus demonstrating the potential application of a single low-power thermally-modulated resistive gas sensor in portable multi-gas monitors.
1
Introduction
Various signal processing methods for use with thermallymodulated sensors for gas sensing, have been reported in the literature [1-6]. For example in [3] a heating element was driven by a sinusoidal voltage and the resulting modulation in sensor resistance analysed by the fast Fourier transform (FFT) method. The amplitudes of the higher harmonics contain information relating to the analyte type and concentration. More recently, these Fourier coefficients were used to train a back-propagation neural network, which was then employed to predict the concentrations of CO and NOz in binary mixtures [6]. In 2001, we reported upon the use of a wavelet transform to predict the presence of CO and NOz gases in air (e.g. for an alarm) as well as predictions of the actual gas concentrations [7]. Here, we propose the use of a support vector machine (SVM) method to predict more efficiently the concentrations of CO and NO2 in air using a single thermally-modulated micromachmed metal oxide gas sensor. A SVM classifies into two different groups (classes) objects characterised by a vector (x) of its features. In this work, the feature vector is formed with the wavelet coefficients obtained from the sensor signal. An eight-order Daubechies filter is used to obtain these wavelet coefficients
[SI.
We now illustrate the simplest case: linear machmes trained on separable data. The training data are { x l , y l } i = 1, . . . ,Nt (Nt is the number of training samples), x, E Rd~~
~
(d is number of features in the vector) and yl E {-1, 1) (‘-1’ for one class and ‘1’ for the other). In the separable case, a hyperplane, w separates positive and negative samples. Those data A- that satisfy wx+ b = 0 lie on the hyperplane where w is normal to the hyperplane, b/liw!I is the perpendicular distance from the hyperplane to the ongin and wI1 is the Euclidean norm of w. Samples from positive and negative training samples satisfy:
1
The SVM creates the separating hyperplane with the largest margin between the hyperplane and any training data. N.
w=
Ccjyix; i= 1
where the vectors xiwith cxi= 0 are the support vectors and the decision function is defined as: f ( x ) = wx
+b =
N2
(3)
where ui are the Lagrange multipliers from solving the optimisation. One class is assigned when the decision function is positive and the other when negative. A nonlinear case can be performed by the transformation of x(x- > +(x) E H) where the mappings 4(.)are performed by a kernel function K ( .. .) that defines an inner product in H , in this case (3) is modified as follows:
~~
0IEE, 2003 IEE Proceedings online no. 20030004 doi: 10. 1049/ip-sint:20030004 Paper first received 9th April 2002 and in revised form 16th September 2002 S. AI-Khalifa and J.W. Gardner are with the School of Engineering. University of Warwick, Coventry CV4 7AL, UK S. Maldonado-Bascon is with the Dpto. de Teona dela Seiial y Comunicaciones, Universidad de Alcal6, Alcalli de Henares, Madrid, Spain IEE Proc.-Sei. Meus. Teclinol., Vol. 150, No. I , Junriuvy 2003
+
C~;Y~XX: b
i= 1
(4) i= 1
where only Ns terms must to be added (Ns is the number of support vectors). In a non-explicit transformation 4(.)the plane w is not available and the decision function is expressed in terms of the kernel K ( .. .). The optimal hyperplane is obtained by 11
maximising the distance LD:
jc 1
LD =
ai
-
I
I=
(5)
aiaj.Y,y,K(xj, x,)
‘J
under the constraints of: 4
C a , y l = o and I=
a,
2o
(6)
I
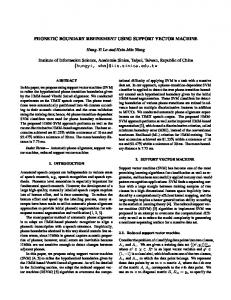
As can be seen from (5), d(x) is not necessary, so in many cases a kernel K(...) is used without an explicit knowledge of +(x). A more detailed description of SVMs can be found in [9]. In Fig. 1, two classes have been classified with a linear SVM. The two classes are marked with either a ‘*’ or a ‘-A-’ and the support vectors are circled. In this case the hyperplane (w,b) is just a straight (solid) line because of the two-dimensioned nature of the problem. two-set classification
3.0
/
’
2.5
2.0
I
N a,
e i
5 1.5
c
a,
c
1.o
2
0.5
1.0
1.5 feature 1
2.0
2.5
3.0
Fig. 1 Example of the h,vperplane classijication of data using a SVM rnuclzine
Our goal here is to predict the gas type (CO, NO:! or the mixed CO + NOz) and concentration from the response of a thermally-modulated resistive gas microsensor and i t SVM.
PECVD Si-nitride LPCVD Si-nitride
Gas Testing Station
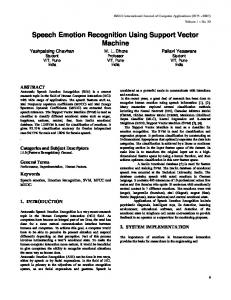
Fig. 2 shows a schematic cross-section of the silicon micromachined resistive gas sensor [6]. The platinum resistive heating element Rheaterdriven by a sinusoidal AC voltage Klc with a DC bias Vdc. The resistance R, of a palladium doped tin oxide film lying on top of gold electrodes is measured using a constant current source Is. Fig. 2c shows a photograph of an array of three identical devices that were created by depositing the metal oxide film onto the silicon die that was then annealed at 600°C before being bonded onto a 16 pin PCB package. This gas testing station was controlled by Lab-View software running on a 600MHz PC with a National Instruments data acquisition card to drive/sense the sensor chip. Full details are presented in [lo]. 3
0.5
0
With the SVM being applied to the wavelet decomposition of the periodic resistive signal [7]. We propose that a SVM can be efficiently applied to gas classification problems. Following training, independent test data are used and then assigned first to one of the two gas classes: C, and Cz (1 or -1). In our implementation, xi is formed with the wavelet coefficients obtained from the sensor signal and y , is either ‘1’ for ‘CO or ‘-1’ for the other gases at the first stage and ‘1’ for NO2and ‘- 1’ for the binary gas CO + NO2 at the second stage. So two SVMs are applied to obtain the gas type. The extension of the classification scheme to gas concentrations is described in Section 4.
Feature selection
In many cases, a SVM uses a large number of features for each vector. The most important features must then be selected. In most supervised learning problems, feature selection is important for a variety of reasons: generalisation performance, running time requirements, and constraints and interpretational issues imposed by the problem itself. The feature selection problem addressed here is that of discriminating between finite point sets (i.e. the two classes C1 and Cz) in a d-dimensional feature Rd by a separating plane that utilises fewer features than d.
’22 lectrodes heater
400pm
-L a
b
C
Fig. 2 a Cross-section of the silicon micromachmed resistive gas sensor, b Schematic representation of heater drive circuit and sensor measurement circuit c Photograph of the resistive device used for experimental work 12
IEE Proc.-Sci. Meus. Teclmol, Vol. 150. No. I , January 2003
From our experimental procedure, the initial feature vector has 102 features, namely the 102 wavelet coefficients from a four-stage decomposition. In the SVM algorithm, we assume that the mapping function $(x) is available. So, the algorithm can be considered to be modified in such a way that the new training set is {xi;y;} = {$(x;), vi} and a hyperplane obtained by its normal w which is used to classify x. Classification is performed by the following inequality:
.{xi, +
if w b 2 0 + class 1 if%;, w + b < O + c l a s s 2
102-wavelet coefficients for NO, 20000
(7)
The angle 9, of every feature vector component with the normal of the hyperplane can be obtained. An orthogonal feature component to w implies an irrelevant feature.
I
-5000
4
4.1
0
identification of gas type and concentration
Gas type
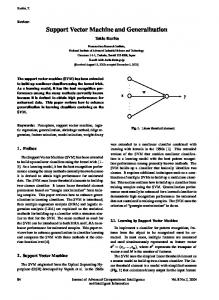
Fig. 3 shows the typical resistive response of the microsensor to a modulated heater voltage at two concentrations of CO in air. Here it is only necessary to use just one period of signal (unlike in FFT) to predict the gas type (or concentration). The computation is as follows: one period of the input signal is introduced into a wavelet decomposition block. Four decompositions are performed over the low pass filter output. A single vector is produced concatenating the wavelet coefficients of the four decompositions. The resulting vector for a single period input signal is illustrated in Fig. 4. From the previous decomposition, 102 wavelet coefficients are obtained in total. These 102 wavelet coefficients are used first for gas type classification and later for gas concentration prediction. However, 102 wavelet coefficients present a very high dimensionality and, clearly, many do not contribute significantly to the prediction process. So here, we have used the SVM both for classification and for feature selection. Out of the 102 wavelet coefficients, the coefficients with the most information about the gas are selected. From the SVM, a plane w that separates two classes is obtained. If the plane is orthogonal to a vector component, then t h s component is irrelevant. Using this premise, we can eliminate all the components with a scalar product with w near to zero, i.e. the vector components of low value can be eliminated without reduction of the performance of the classification task. In Fig. 5, the magnitude of the result from training w components are plotted. These components have been obtained with a reduced training set where one class corresponds to CO and the other class corresponds to
t
20
60
40
80
100
120
wavelet coefficients
Fig. 4 Graph showing a typical set of wavelet coeficients for the analysis of NO2 in air
0.35 .
0.30 t
+
-
0.25 -
9
0.20 -
;I
3 .C
E
f
0.15 0.10
0.05 0 0
Fig. 5
20
40
60 w components
80
100
120
Full set of 102 wuvelet components used in vector w
CO+NO2 and NOz. The three classes CO, NO2 and the mixture are separated in two stages. First CO is one class whilst the NO2 and the mixture are the other class. For this second class another classification is performed to identify between pure NO2 and the mixture. As can be seen in Fig. 5, there is a high correlation between adjacent coefficients. So, we have selected the maxima from Fig. 5 in order to reduce the correlation between the selected coefficients to classify the gas. Next, the ten largest coefficients are taken from Fig. 5. The result is a reduction in the number of features, and these are selected as the features for the classification. Fig. 6 represents the magnitude of the w components for the new training process. Using these selected components of the wavelet coefficient vector, tests have been performed on over 182 sets. The gas type classification results are presented in Table 1, and show that the gas type is predicted with an accuracy of over 94%.
i350 i 4.2
time, s
Fig. 3 Response oj device to the AC temperature wive (open yquares) in Sppm (Jolid Jquares) and 80ppm (circles) of CO in clean air ut 2S% rh. The temperature wave is only upproximately sinusoidd given a sinusoidal drive voltage IEE Proc.-Sci Mea&. Teclinol, Vol. 150, No. I , Juiiuarv 2003
Gas concentration
The SVM can also be used for regression and so predict the gas concentration, a detailed description of SVM regression can be found in [l 11. In this case the output y , is not binary; instead yl is the value of the regressed function for the given input x. A Gaussian kernel has been used for this part, and is given by K ( x , x')
e-+x'/2
(8) 13
0.8 0.7
0.6
I
Table 2: Estimation (prediction) of gas concentration and the associated error
1
1
~
0.3
Real concentration, PPmlPPm
0 w components
Fig. 6 Reduced set of IO wavelet components used in vector w
Table 1: Actual classification percentages for the pure CO, pure NO2 and a mixture of both in air CO, %
NOz, %
CO+NOz, %
100
100
94
461
20110
20.6/9.46
3.015.7
40120
41.2119.22
3.014.1
CO/N02
80140
79.0139.40
1.3l1.5
CO/N02
130/60
123.3157.22
5.414.9
It has been shown that a single thermally-modulated resistive gas sensor can be employed to predict the presence and levels of CO and NOz in air. A simple SVM method can be used to classify the wavelet coefficients and predict unknown gas types and concentrations with a high level of confidence (94% or better). The SVM code can be implemented very efficiently using, for example, a low-cost 8-bit microcontroller and 1 kByte of RAM. Moreover, the ability to detect two pollutant gases in air with one lowpower sensor reduces the overall power consumption to a level suitable for commercial battery-powered, multi-gas monitors.
7
341 32 ,
4
6
-
8
8
I
I
I
10 12 14 16 testing samples
I
18
I
20
_L
22
Fig. 7 Concentration of CO in a binary gas mixture bused on the training data (labelled *) and predicted on test dutu (labelled 0). The nominal gas concentration is 40ppm, although there will be some small experimental error on this value
where is selected by observation of several runs and x, x‘ are the input and support vectors respectively. Once the gas type is known a different SVM is applied to CO, NO2 and for the mixed gas. The number of support vectors obtained with the training set of the mixture are 42 for the CO and 33 for the NOz. An example of the results is shown in Fig. 7 and ths corresponds to a CO concentration of 40 ppm in air. The median results from four different data sets, where six samples have been taken are presented in Table 2, and show the gas concentration can also be predicted accuratly with errors of less than 5%.
14
Conclusions
Acknowledgments
The authors wish to thank Dr. Nicolae Birsan (Tiiebingen University) for the deposition of the metal oxide films and Professor Nice de Rooij (Institute of Microtechnology, Neuchatel) for the processing of the silicon devices.
44
3010 2
Error, Yo
CO/N02
6
I
Estimated Concentration, PPmlPPm
CO/N02
5
0.1
50 48
Gas
References
1 CAVICCHI, R.E., SUEHLE, J.S., KREIDER, K.G., GAITAN, M., and CHAPARALA, : ‘Optimised temperature pulse sequences for the enhancement of chemically-specific response pattems from microhotplate gas sensors’. Conf. Proc. Transducers ‘95 and Eurosensors I X ? Stockholm, Sweden, 1995, pp. 82>826 2 GOPEL, W., and SCHIERBAUM, K.D.: ‘SnOz Sensors: current status and future prospects’, Sem. Acuutors B, Cheni., 1995, 2&27, pp. 1-12 3 NAKATA, S., AKABE, S., NAKASUJI, M., and YOUSHIKAWA, K.: ‘Gas sensing hased on non-linear response: Discrimination between hydrocarbon and quantification of individual components in a gas mixture’, Anal. Chenz., 1996, 68,pp. 2067-2072 4 IHOKURA, K., and WATSON, J.: ‘Stannic Oxide Gas Sensors, Principles and Applications’ (CRC Press, Boca Raton, FL, 1994) 5 AL-KHALIFA, S., GARDNER, J.W., and CRAINE, J.F.: ‘Characterisation of a thermal wave nucrosensor for intelligent analysis of atmospheric gases’. Presented at Sensors and their applications VIII, Glasgow, lop, 1997 6 HEILIG, A., BARSAN, N., WEIMAR, U., SCHWEIZERBERBERICH, M., GARDNER, J.W., and GOPEL, W.: ‘Gas identification by modulating temperatures of Sn02-based thick film sensors’, Sens. Actuators B., Chem., 1997, 43, pp. 4 S 5 1 7 AL-KHALIFA, S. GARDNER, J.W., and MALDONADOBASCON, S.: ‘Rapid multicomponent analysis using a thermallymodulated resistive gas microsensor and a discrete wavelet transform’. Sensors and their Applications, London, XI/ISMCR, lop, 2001 8 MALLAT, S.: ‘A Wavelet tour of signal processing’ (Academic Press, 1998) 9 BURGES, C.J.C.: ‘A tutorial on support vector machines for pattern recognition’, Datu Min. Knoad Discou., 1998, 2, (2), pp. 121-167 10 AL-KHALIFA, S.: PhD Thesis, University of Warwick, Coventry CV4 7AL, U.K. 2000 11 SMOLA, A.J., and SCHOLKOPF: ‘A tutorial on support vector regression’. Neurocolt2 Technical Report Series, October 1998., (Available at http://www.neurocolt.com.)
IEE Proc-Sci. Meus. Teclmol, Vol. 150, No. I , Juiiuury 2003