Proceedings of the 7th IASTED International Conference Biomedical Engineering (BioMED 2010) February 17 - 19, 2010 Innsbruck, Austria
USING GAUSSIAN PROCESS MODELS FOR NEAR-INFRARED SPECTROSCOPY DATA INTERPOLATION Darren Leamy Biomedical Engineering Research Group Department of Electronic Engineering National University of Ireland Maynooth Maynooth, Co. Kildare, Ireland email:
[email protected]
Tom´as Ward Biomedical Engineering Research Group Department of Electronic Engineering National University of Ireland Maynooth Maynooth, Co. Kildare, Ireland email:
[email protected]
ABSTRACT Gaussian Process (GP) model interpolation is used extensively in geostatistics. We investigated the effectiveness of using GP model interpolation to generate maps of cortical activity as measured by Near Infrared Spectroscopy (NIRS). GP model interpolation also produces a variability map, which indicates the reliability of the interpolated data. For NIRS, cortical hemodynamic activity is spatially sampled. When generating cortical activity maps, the data must be interpolated. Popular NIRS imaging software HomER uses Photon Migration Imaging (PMI) and Diffuse Optical Imaging (DOI) techniques based on models of light behaviour to generate activity maps. Very few non-parametric methods of NIRS imaging exist and none of them indicate the reliability of the interpolated data. Our GP model interpolation algorithm and HomER produced activity maps based on data generated from typical functional NIRS responses. Image results in HomER were taken as the bench mark as the images produced are commonly considered to be representative of the true underlying hemodynamic spatial response. The output from the GP approach was then compared to these on a qualitative basis. The GP model interpolation appears to produce less structured image maps of hemodynamic activity compared to those produced by HomER, however a broadly similar spatial response is compelling evidence of the utility of GP models for such applications. The additional generation of a variability map which is produced by the GP method may have some utility for functional NIRS as such information is not explicitly available from standard approaches. GP model interpolation can produce spatial activity maps from coarsely sampled NIRS data sets without any knowledge of the system being modelled. While the images produced do not appear to have the same feature resolution as photonic model-based methods the technique is worthy of further investigation due to its relative simplicity and, most intriguingly, its generation of ancillary information in the form of the variability map. This additional data may have some utility in NIRS optode design or perhaps it may have application as additional input for response classification purposes. This GP technique may also be of use where model information
680-160
Juˇs Kocijan Jozef Stefan Institute Ljubljana, Slovenia and University of Nova Gorica Nova Gorica, Slovenia email:
[email protected]
is inadequate for DOI techniques. KEY WORDS Optical Imaging; Biomedical Signal Processing; NearInfrared Spectroscopy; Gaussian process models.
1
Introduction
Near-infrared spectroscopy (NIRS) is a non-invasive method for measuring localised hemodynamics in the brain. This technique uses light at multiple near-infrared wavelengths to measure concentrations of oxygenated haemoglobin (HbO) and deoxygenated haemoglobin (HbR). Since there is a relationship between cerebral vascular responses and neural stimulation, the recorded HbO and HbR signals give an indirect measurement of neuronal activity. NIRS only interrogates a small area of cortex so interpolation of the data is required to produce a spatial activity map. The most popular method for producing images from NIRS data is through a linear approximation to the photon diffusion equation [1]. This method is implemented in the NIRS data analysis package HomER. Cruder, more familiar, methods of interpolation have been applied to NIRS signals before [2]. However, the method employed by HomER is widely trusted to be the highest standard of NIRS imaging. The Gaussian process model is a probabilistic, nonparametric black-box model. It differs from most of the other black-box modelling approaches as it does not try to approximate the modelled system by fitting the parameters of the selected basis functions but rather searches for the statistical relationship among measured data. Gaussian process models are closely related to approaches such as Support Vector Machines and especially Relevance Vector Machines. Typically, Gaussian process models have been explored for various applications as a method for classification or regression. Various interesting applications (e.g. [3], [4] in medicine and bioengineering fields) have exploited different properties of Gaussian pro-
257
cess models. In the field of geostatistics Gaussian Process regression models are used for probabilistic analysis of data and are more commonly known under name Kriging. It is the latter application of GP which we are applying here. Here, we apply the GP interpolation process to NIRS data and compare results to those obtained in HomER. GP model interpolation is unique in that it produces an interpolated magnitude map and also a variance map. The levels of variance at each interpolation point give an indication of how reliable the estimated magnitude value is. This is the first time as far as the authors are aware that a Kriging approach has been applied to data generated by near infrared spectroscopy methods and it may open up new vistas of research at least for non-parametric approaches to image construction in this domain.
2 2.1
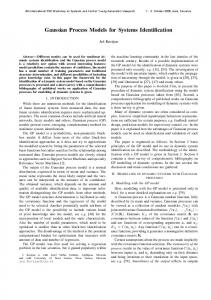
3 0.5 cm
A 1 2
Figure 1. Optode configuration. The solid dark green circle labelled A indicates the location of the light source. The open circles, labelled 1-4 indicate the locations of the photodetectors. The solid red circles indicate the midpoints of the paths, which are used as the data source locations for GP model interpolation. Points on the grid are 0.5 cm apart.
Background NIRS Theory
In NIRS, near-infrared wavelengths of light are shone on to the scalp. Some of the emitted photons are absorbed and some are scattered. Some of the scattered photons are ‘back-scattered’ so that they exit the scalp again. A photodetector can be placed on the scalp to record the intensity of the transmitted light exiting at that point. A pairing of light source to photodetector is called an ‘optode’. The light recorded by a photodetector is predicted to have travelled in a roughly banana-shaped path [5]. By controlling the separation of the light source and photodetector, the expected depth of the photon path can be controlled. This source-detector separation is set so that a small area of cortex is interrogated by the photons. The intensity of the back-scattered light is related to the amount of light that has been absorbed and scattered. The absorption spectrum of HbO and HbR has been recorded before [6]. Using the absorption coefficients of HbO and HbR at the two wavelengths used, the modified Beer-Lambert law can be used to calculate concentrations of HbO and HbR along the path [7]. This indicates the changes in HbO and HbR in the interrogated area of cortex. A more detailed introduction to NIRS can be found elsewhere [8]. 2.2
4
0.5 cm
posterior distribution for model predictions. xi ∈