Specifically, each door is characterized by three features (color, shape and sound), and only one ..... Schizophrenia: a disconnection syndrome? Clin Neurosci ...
A. Sorkin et al. / 13th Medicine Meets Virtual Reality Conference Proceedings, 2005
Virtual Reality Testing of Multi-Modal Integration in Schizophrenic Patients Anna SORKIN¹, Avi PELED2, Daphna WEINSHALL¹ Interdisciplinary Center for Neural Computation, Hebrew University of Jerusalem, Israel. 2 Institute for Psychiatric Studies, Sha’ar Menashe Mental Health Center, & Faculty of Medicine, Technion, Israel. 1
Abstract. Our goal is to develop a new family of automatic tools for the diagnosis of schizophrenia, using Virtual Reality Technology (VRT). VRT is specifically suitable for this purpose, because it allows for multi-modal stimulation in a complex setup, and the simultaneous measurement of multiple parameters. In this work we studied sensory integration within working memory, in a navigation task through a VR maze. Along the way subjects pass through multiple rooms that include three doors each, only one of which can be used to legally exit the room. Specifically, each door is characterized by three features (color, shape and sound), and only one combination of features – as determined by a transient opening rule – is legal. The opening rule changes over time. Subjects must learn the rule and use it for successful navigation throughout the maze. 39 schizophrenic patients and 21 healthy controls participated in this study. Upon completion, each subject was assigned a performance profile, including various error scores, response time, navigation ability and strategy. We developed a classification procedure based on the subjects’ performance profile, which correctly predicted 85% of the schizophrenic patients (and all the controls). We observed that a number of parameters showed significant correlation with standard diagnosis scores (PANSS), suggesting the potential use of our measurements for future diagnosis of schizophrenia. On the other hand, our patients did not show unusual repetition of response despite stimulus cessation (called perseveration in classical studies of schizophrenia), which is usually considered a robust marker of the disease. Interestingly, this deficit only appeared in our study when subjects did not receive proper explanation of the task.
Introduction Schizophrenia is a very debilitating disease, involving multiple and diverse symptoms, none of which is unique to schizophrenia. There is no biological marker to diagnose schizophrenia, and today the diagnosis is achieved primarily by psychiatric evaluation, which relies on symptoms, medical history, interview and observation. This procedure is difficult and somewhat unreliable, since each patient manifests a different sub-set of symptoms, whose evaluation in turn may differ even across expert observers. In this paper we describe a new tool for the diagnosis of schizophrenia, which is essentially a computer game based on Virtual Reality Technology (VRT), including real time interactions and multi-modal stimulations. We believe that VRT is specifically suitable for studying schizophrenia for a number of reasons: (i) Schizophrenia involves primarily high-level brain functions [1, 2], and therefore some of its symptoms may be only manifested in a natural complex setup, with a strong sense of presence. (ii) Moreover, by incorporating visual and auditory modalities and visual-motor skills within one task,
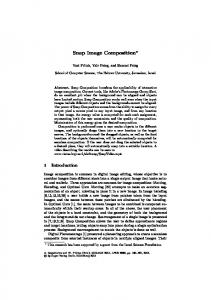
A. Sorkin et al. / 13th Medicine Meets Virtual Reality Conference Proceedings, 2005 multiple parameters can be measured during one behavior, rather than in a separate manner, revealing true correlations among functions. (iii) Finally, by replacing the traditional “boring” testing procedure with a "fun" game in a virtual environment, we may be able to overcome the notorious low motivation and lack of concentration exhibited by schizophrenic patients. By way of background, schizophrenia is a devastating mental disorder with no known cure. The symptoms are usually classified as positive or negative. Positive symptoms include hallucinations (mostly auditory, though visual, tactile or olfactory rarely occur) and delusions (false unshakable beliefs). Hallucinations and delusions are so strong that they dominate the perception, actions and behavior of the patient. Negative symptoms consist of disorganized thinking & speech, social withdrawal, absence of emotion & expression, and reduced energy, motivation & activity. Typically, negative symptoms are more subtle and harder to define; they may be misinterpreted as personality traits, or may be confused with a reaction to certain life situations. In the current study we sought to measure aspects of sensory integration within working memory (WM), known to be deficient among schizophrenic patients [3]. These patients also exhibit decreased ability to adjust to change (known as perseveration, or the repetition of response despite stimulus cessation) [4]. We therefore designed a virtual maze, with rooms that include a number of different doors, identified by a few features. The task is to navigate in the maze by opening only the “correct” door in each room, as defined by a fixed combination of features – the opening rule; remembering the rule puts load on the working memory of the subject. Moreover, the rule changes abruptly, which challenges the subject’s ability to adapt to change. Our main result in this study is the establishment of a routine that can distinguish patients from controls based on their performance profile, including multiple measurements collected during the VRT task. We measured errors scores, aspects of response time, and a variety of parameters reflecting the subject’s navigation ability and decision strategy. We then developed a classification procedure, which modeled the distribution of the normal population, and then computed the probability to observe a given profile given this distribution. Finally, we fixed a single threshold to classify a profile as healthy or not. This procedure predicted correctly 85% of the participating patients (in a leave-one-out paradigm), and all the control subjects. Our second main finding concerns perseveration – in our tests, patients adapt their response well (like controls) to change of stimuli when they are given proper explanation and training about the experiment. Perseveration as measured in classical studies of schizophrenia appears only when no initial explanation about the task is given, and thus seems related more to task understanding than to adaptability to change. Experiment 1: Working Memory Design The main experiment involves a computer game, requiring navigation in a virtual maze with “challenge” and “delay” rooms. Each “challenge” room has three doors, only one of which can be legally used to exit the room, while each “delay“ room has a single door. The goal of the game is to reach the end of the maze as fast as possible, which only happens after all the rooms have been legally exited (by opening the correct door). Each door in a “challenge” room is associated with up to three distinct features shape (triangle, square or circle), color (red, green or blue) and sound (3 different sounds), see Figure 1a. The sound is played when the subject examines the door. At each point in
A. Sorkin et al. / 13th Medicine Meets Virtual Reality Conference Proceedings, 2005 time, there is a certain “opening rule” which determines which door should be used to exit a “challenge” room. For example, the rule may say that only red doors can be opened, in which case any red door, regardless of its shape or sound, can be used. There will always be only one such door in each “challenge” room. The subject has to figure out the correct rule and open only the appropriate door (with the correct combination) in each “challenge” room. We created four experimental conditions by manipulating two factors: the number of features which define the opening rule (1 or 2), and the presence or absence of a distractor feature on the doors (a door feature that is not used in the opening rule), see Table 1. The rule changes over time as indicated by a visual cue. When the correct door is chosen, the subject receives a reward (cigarette or chocolate icon) and gets encouragement (a dancing figure clapping hands), see Figure 1b. Number of features 1 2
Table 1. Four rule types used in the experiment. No distractor Distractor present Sound
Sound + Color as distractor
Sound & Shape
Sound & Shape+ Color as distractor
In between challenge rooms, the subject passes through a few “delay” rooms with only one door. A door in a “delay” room is also associated with a colored shape and sound, different from those used on doors in challenge rooms (see Figure 1c). “Delay” rooms are included in order to increase the load on the subject’s working memory.
Figure 1. The virtual maze. a) “Challenge” room with 3 doors. b) Feedback when the correct door is opened. c) “Delay” room.
Methods Procedure: 39 schizophrenic patients and 21 healthy controls matched by age and education level participated in the study. All subjects volunteered and received payment. The patients were evaluated using the standard PANSS (Positive and Negative Symptoms Scale). The experiment included a training phase, followed by the actual game. Training consisted of 3 stages: First, subjects learned how to open doors legally without movement. Second, they learned how to navigate in the maze at the desired speed. Finally, they practiced on a game-like session, with emphasis on achieving best performance (rather than speed). Subjects were encouraged to verbalize their strategy, were reminded of the ultimate goal, and received rich positive feedback from the experimenter.
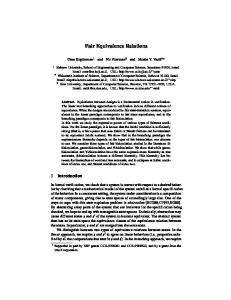
A. Sorkin et al. / 13th Medicine Meets Virtual Reality Conference Proceedings, 2005 Equipment: The sense of reality was obtained with 3D glasses, head tracker and joystick. Subjects used the joystick to navigate and open doors. The navigation button enabled movement in four directions: forward, backward, left and right. A change in the direction of movement could also be made by turning the head. Data Analysis: We collected a vector of 26 parameters for each subject based on some continuous physical measurements. These included errors scores and Response Time (RT), the position and direction of gaze of each subject at any time, and the subject’s rate of improvement with time. The 26 parameters define a subject’s performance profile and can be divided to three groups: WM & Integration, Navigation & Strategy, and Learning. • The WM & Integration group includes various errors scores, perseveration and distractor effect. In calculating error scores we distinguished between: (i) errors made during learning the rule (after the rule has changed); (ii) errors made while using the rule; (iii) the number of consecutive errors. Among all the erroneous choices, perseveration errors include all the repeated selections of a previous incorrect choice, or any erroneous choice which is consistent with a previous “opening rule” that has already changed. Perseveration was measured as the ratio between the number of perseveration errors and the total number of errors. Finally, the distractor effect was measured as the difference in error rate between two conditions: distractor is present less distractor is absent (the rows in Table 1). • The Navigation & Strategy group includes three components: response time, navigation profile and strategy parameters. The navigation profile of a subject includes a combined measure of navigation speed with the number of collisions with walls and movements’ histogram (e.g., forward, backward, rotation). The subject’s decision strategy is measured by the number of doors inspected in each room, and the time spent looking at each door. To assess the selection strategy of a subject, we compared the histogram of locations of selected doors with the histogram of locations of correct doors. • The Learning group measures the rate of subject’s improvement with time on WM & Integration parameters, RT and navigation speed. All the data was normalized so that, within the control group, each parameter is distributed with zero mean and standard deviation 1. A subject is noted to differ from the control group on a given parameter if his absolute value exceeds 2 in the normalized distribution. Results The patients group showed a very large variance in all the measured parameters. Each patient differed from the control group in a unique subset of parameters. To illustrate, two examples of individual performance plots are shown in Figure 2. There, patient A performed within the control range on all but two parameters, while patient B deviated in a wide range of parameters (concentrated in the upper right corner), most of which belong to the WM & Integration group of parameters. The biggest difference between patients and controls (involving more than half of the patients) was manifested in increased errors rate when using the rule, increased consecutive errors, and large head rotation. The increased errors rate when using the rule in the patients group was maintained through both the training and experimental sessions. Some patients, however, showed large improvement during the training stage.
A. Sorkin et al. / 13th Medicine Meets Virtual Reality Conference Proceedings, 2005
Figure 2. This plot shows subjects’ performance profiles in polar coordinates. Each parameter corresponds to a certain angle j, and the radius r reflects the subject’s measurement value in the normalized coordinates system for that measurement. Thus a subject’s profile corresponds to a close curve through 26 (r, j) pairs. A, B) The personal profile of two patients, respectively, is shown in red. C) The performance profiles of all 21 control subjects, shown in blue, concentrate by definition in the area r ≤ 2. Generally, the patients’ group demonstrated decreased ability to ignore irrelevant information. Accordingly, in the distractor conditions (right column of Table 1), they had higher errors rate. In addition, a noticeable number of patients showed one (or more) of the following deficits: increased errors rate during rule learning, elevated RT, and poor selection strategy. Overall, the patients were significantly slower than the controls; it was expressed in RT, speed and time spent looking on doors. However, they also showed a much bigger improvement than controls in RT and navigation speed. Finally, there was no marked difference between the groups in decision strategy or movement profile. One of our most surprising finding is the similarity between patients and controls in the perseveration measure. Recall that in the relevant literature, perseveration is one of the strongest indicators of the disease. However, our approach to scoring perseveration differs from the classical procedure in two ways: First, we measure perseveration by a ratio, the number of perseverative errors divided by the total number of errors. This is because when the number of total errors is elevated, the number of perseverative errors should be expected to increase as well, irrespective of the source of error. Indeed, the numbers of total and perseverative errors showed very high correlation (0.87). Second, in our experiment subjects received a detailed explanation about the task, as well as extensive training. This difference might explain the discrepancy between our results and the relevant literature; to test this hypothesis, we designed an additional experiment, as reported below (experiment 2). We also tested the correlation between our measurements and the subjects’ PANSS scores, revealing a number of significant correlations (p