low-cost Linux workstation equipped with spatial tracking hard- ware, data gloves and .... time step 130, when the broken-down vortex is carried out of the integration area. ..... timization strategies such as data set partitioning and hard drive.
Visualization of Particle Traces in Virtual Environments Falko Kuester
Ralph Bruckschen
Visualization and Interactive Systems Group Department of Electrical and Computer Engineering The Henry Samueli School of Engineering University of California, Irvine, CA 92697-2625
�
Bernd Hamann �
�
Kenneth I. Joy
�
Visualization and Graphics Research Group Center for Image Processing and Integrated Computing Department of Computer Science University of California, Davis, CA 95616-8562
ABSTRACT Real-time visualization of particle traces in virtual environments can aid in the exploration and analysis of complex three dimensional vector fields. This paper introduces a scalable method suitable for the interactive visualization of large time-varying vector fields on commodity hardware. A real-time data streaming and visualization approach and its out-of-core scheme for the pre-processing and rendering of data are described. The presented approach yields low-latency application start-up times and small memory footprints. A proof of concept systems was implemented on a low-cost Linux workstation equipped with spatial tracking hardware, data gloves and shutter glasses. The system was used to implement a virtual wind tunnel in which a volumetric particle injector can introduce up to 60000 particles into the flow field while an interactive rendering performance of 60 frames per second is maintained.
Keywords Virtual Reality, Virtual Wind Tunnel, Particle Tracing, Scientific Visualization, Computational Fluid Dynamics, Out-of-Core Visualization, Simulation, Stereoscopic Rendering.
1.
INTRODUCTION
As numerical simulations are becoming more powerful, it is possible to simulate physical phenomena at ever increasing resolution. The goal is to provide a scientist with intuitive and interactive tools for the exploration and analysis of these large time-varying data sets. The challenge is to visualize the data generated by highprecision simulation runs without loss of accuracy. Unfortunately, computational resources available for visualization frequently do not match those used for simulation and it is no longer possible to visualize the resulting massive data sets using an exclusive incore approach. This implies that the amount of data has to be reduced to allow for reasonable visualization times. Using available approaches, an increase in rendering speed generally comes at the expense of a reduction in data precision. In particular, when techniques such a sub-sampling are used, undesired artifacts can be
Permission to make digital or hard copies of all or part of this work for personal or classroom use is granted without fee provided that copies are not made or distributed for profit or commercial advantage and that copies bear this notice and the full citation on the first page. To copy otherwise, to republish, to post on servers or to redistribute to lists, requires prior specific permission and/or a fee. VRST’01, November 15-17, 2001, Banff, Alberta, Canada. Copyright 2001 ACM 1-58113-427-4/01/0011 ...$5.00.
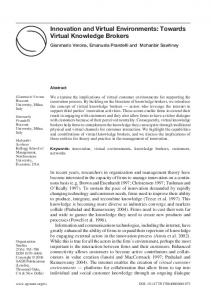
Figure 1: Real-time particle visualization in VR.
introduced or potentially important features removed. The visualization problems associated with very large time-varying data sets in computational fluid dynamics (CFD) are frequently addressed by creating image sequences or movies in batch processes. Such an approach generally requires basic knowledge of the result, frequently derived from interaction with lower resolution datasets. Some improvements have been made with 3D interactive movies, but interactive visualization in full resolution is still expensive. The goal of the work described herein is to enable visualization of arbitrarily large scientific data sets while using minimal CPU and memory footprints, enabling the system to run on low-cost commodity hardware as well as massively parallel systems. The out-of-core approach is specialized for real-time visualization of large-scale time-varying data sets at the highest available level of resolution and is suitable for virtual wind tunnel scenarios (Figure 1). The system was used to implement a volumetric particle injector, which can emit up to 60000 particles into the flow field while maintaining an interactive frame rate of 60 frames per second. This performance was achieved by pre-calculating a dense � trajectory seeds) uniform rectilinear grid of particle injectors1 ( � and storing the particles on all resulting trajectories out-of-core in a scheme optimized for selection of sub-grids. For the initial test phase, data sets were generated for a classical
�
A particle injector releases a constant stream of particles into a flow. In a numeric simulation, this is discretized by adding a particle for each time step of the simulation.
problem: simulating the flow of a fluid around a spherical object. In this case, a Reynolds number2 of about 2000 was selected to simulate the flow field around a sphere pushed slowly through water. A rectilinear grid of 128*128*1024 was used for the computation of about 250 time steps. A finite-difference Navier-Stokes solver was used to generate the simulation data.
2.
RELATED WORK
Visualization of time-varying fluid flows using large amounts of particles has been approached, for example, by Lane [1]. Using 3D movies, the possibility of rendering large amounts of particles in real time was demonstrated by Meiselbach [2]. Out-of-core particle tracing algorithms have been developed by Ueng et al. [3] for the most common forms of meshes used in CFD. A more detailed description of the problem definition and related issues can be found in [4]. A server-based approach supporting interactive frame rates was demonstrated by Cox and Ellsworth [5] for relatively small particle systems. The interactive visualization of flow data sets in virtual reality (VR) environments was studied by Jern and Earnshaw [6], and for time-dependent data sets by Kenwright and Lane [7] using in-core algorithms.
3.
IMPLEMENTATION
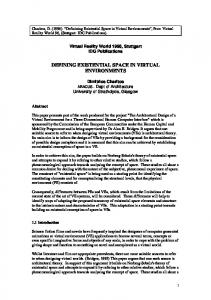
The presented system consists of four main components: (1) a CFD simulator with (2) a particle tracer, (3) an encoder, and (4) a renderer integrated into a VR framework. Figure 2 illustrates the different system components and data flow.
Computing time Process & Data Interaction Abstract
Simulation
Days to Weeks
Vectorfields
Covered in this Paper
Minutes to Hours
Encoder Datachunks
Milliseconds
Renderer Images
System
Simulation Setup Mainframe or Workstation
Particle Tracer Select Region and Resolution Particles of Injectorvoxel
Hours to Days
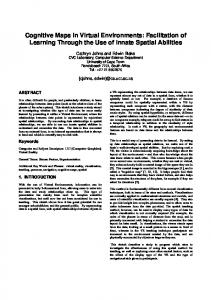
particle data into the discussed scheme. At each time step during the simulation run the coordinates of all particles together with the number of the injector and the time step of injection are written to a file and compressed with gzip to reduce the amount of memory needed for storage. Since the code for the simulation and particle tracer is not yet optimized for commodity hardware with respect to the required memory footprint, the complete simulation run is performed as a pre-processing step on an Origin2000 server. The computational results are directly stored on the Linux RAID system that is mounted through the local area network using NFS. After encoding, the resulting data files are directly available for visualization and updated data sets can be incrementally added as they become available. The sphere test data set consists of 250 time steps for a simulation on a rectilinear grid of 128*128*1024 resolution. The uniform rectilinear injector grid has a size of ���� yielding approximately 400000 particle injectors. The grid’s dimensions are currently determined by the size of the integration area in y and z directions, forming a cube. Since many particles are leaving the integration area after about 100 time steps, the maximum amount of particles per injector during the simulation is about 130. The compressed data files have a maximum size of 275MB each. Due to the structure of the simulated flow, the amount of particles is oscillating around a constant value of about 110 after time step 131. The fog-ring vortex shown in Figure 3 breaks down (Figure 4) and is replaced by a rotating double helix structure (Figure 5). Effectively, the maximum amount of visualized particles is reached at time step 130, when the broken-down vortex is carried out of the integration area. Figure 7 shows these features in more detail.
None
Mainframe or Workstation
Mainframe or Workstation connected to RAID
Select Subregion Graphics Workstation (Apply Foglance) with RAID
Figure 3: Vortex structure.
Figure 2: System Components.
3.1 Simulation The legacy simulation code was originally written in Fortran and implements a finite-difference method for a rectangular grid and a particle tracer. The particle tracer was modified for the continuous injection of particles based on a uniform rectilinear grid of entry points. Particles without mass are calculated in a secondorder von Heun scheme using trilinear interpolation in rectilinear hexahedral grid elements. The existing Fortran code was converted to C using f2c. Further improvements were added to the C code to enable the use of dynamically allocated memory. It was possible to instrument the existing particle tracer such that it converts the � The Reynolds number is proportional to the ratio of inertial force and viscous force. It is used in momentum, heat, and mass transfer computations to account for dynamic similarity.
Figure 4: Vortex break down.
Figure 5: Double helix structure.
3.2 Data Representation The classical visualization approach for interactive particle tracing is to read the data needed for calculating the particle traces from a storage system and calculating particle trajectories procedurally and in-core. The velocity of the particles is then interpolated and their new positions are determined. Using this method, visualization with artificial fog is impractical for tera-byte data sets, since very large massive parallel systems are needed. This is due to the amount of data required for the integration with a limiting factor being the data throughput from the storage system to the server. In a time-dependent CFD simulation on an unstructured tetrahedral grid, the minimal data required to compute a particle path are two tetrahedra with velocity vectors defined at their corners. This means that for every particle two sets of four coordinates with four velocity vectors are needed. When using single-precision floatingpoint variables, 256 bytes will have to be transferred per particle. Assuming a static mesh, this amount can be reduced by 50% when the mesh is cached in main memory. The other limiting factor is the amount of searches required on the storage system. As “seeks” generally require more time than the actual read operations, usually larger data blocks need to be processed for each particle. Since these methods strive to achieve complete freedom of interaction for user specifiable input, they are optimized for random access to data on the storage system. For the particles that are rendered, the amount of data needed is much smaller. Every particle can be described by its coordinates. Using single-precision floating-point variables, twelve bytes are needed. By transforming the coordinates to 16-bit integer values, this can be reduced to six bytes. In certain cases particles are color-coded by an underlying scalar field value such as pressure or absolute speed. For this purpose, an additional 16-bit value can be added to align the data to 64 � bits (8 bytes). With this approach, particles need only �� of data throughput compared to the data needed to actually generate them.
3.3 Particle Tracer and Encoder In order to optimize rendering performance the method described herein limits interaction by pre-calculating particle traces for a user defined raster. Instead of calculating particle traces on the fly procedurally, and traversing the complete visualization pipeline in realtime, the approach calculates particle traces in bulk large enough to allow interaction by selection. It is possible to store the particles in a scheme such that they can be interactively selected in real time during later data exploration. The drawback is that a new raster needs to be selected and the particles re-calculated to explore different parts of the flow. This turn-around time is highly dependent on the size of the data, its structure, and the used computational hardware. As particle tracing can be parallelized efficiently, either a simulation mainframe or a render farm could be used. The simulation used for testing is a sequential finite-difference method
applied to a rectangular grid including a particle tracer. After each time step, new particles are injected from a raster of entry points. All particles in the integration area are traced and their coordinates, time of entry, and number of entry points are stored. The integration scheme is a second-order von Heun method using the two time steps that are stored in main memory during the simulation. The second-order scheme is sufficient, as the simulation itself is only of first order. The time stepping of the particle integration is the same as the stepping of the simulation. This assures that the particles are synchronized with the simulation speed. Particle injectors are located in a uniform rectilinear mesh that discretizes a volume in a user-specified region. The volume can be intersected with the model located in the flow field. When this occurs, the particle injector are disabled in the impacted region. For every injector, the particles are stored in a list, sorted by time of entry. At each time step, a particle is added to the list with the coordinates of the injector, and new particle positions are calculated. All particles that leave the integration space will be deleted. When the maximum particle threshold is reached, particles are deleted based on their age, i.e., in FIFO order. This approach simulates the dissolving of paint molecules in a liquid. During the encoding step, the maximum amount of particles per injector is calculated, and all active injectors are sorted by their Morton code3 . Based on the final order, the particle lists for each injector are traversed. The coordinates are down-sampled to 16-bit integer values and stored in consecutive files. To achieve a constant block size, each particle list is padded with zeros up to the maximum amount per entry point. After storing the particles, a header file is generated with the following information:
number of particle injectors, file pointer for the first time step of each particle injector (used to calculate the seek location), block size (maximum amount of particles per entry point), size of integration area (to transform from 16-bit to floatingpoint representation), size of particle injector grid (to calculate cursor position), number of time steps, and file size per time step. The encoder was implemented in C and utilizes a local RAID on the Linux system. Each time step is read into main memory, sorted, re-sampled, padded, and written into consecutive files. Following each time step, the header file is also generated and stored. The file names are directly correlated with the current time step. Since the converter parses ASCII data piped to it from a de-compression process, each time step requires about five minutes to complete. The padding penalty for missing particles is up to five megabytes per time step, resulting in a maximum file size of 28MB for the described problem. This overhead, however, enables significantly faster look-up operations on block-aligned data. The alternative would be to store block� sizes per time step and injector in main memory. Using the �� grid with 250 time steps, results in an � The Morton order defines a linear numbering of the leaves of a complete quadtree (2D case) or octree (3D case) [8]. A Morton order optimizes the amount of searches needed to select a rectangular subset of a uniform rectilinear grid. In the 3D case, the worst case requires eight searches to access a rectangular subset, see Figure 6. The maximum size of the data to be read is eight times the size of a rectangular subset.
0
1
4
5 16 17 20 21 64 ....
3
2
7
6 19 18 23 22
12 13
8
9 28 29 24 25
15 14 10 11 31 30 27 26 �� � �� � �� � �� � ��
48 49 52 53 32 33 �� � �� � �� � 116 � 117 �� �� � 36�� � 37�� ��
� 115�� � 114�� � 119 � 118 �� �� 51 50 55 54 35 34 �� � 39�� � 38�� ��
192
� �� � �� � �� � �� �� � �� � �� � �� � �� �� � � � � � � � � 46 �� � 43�� � 42�� �� � 127�� � 126�� 123 122 � 212�� � 213�� �� � 128�� � 129�� ��
255
191
� 40�� � 41�� 124 125 120 121 60 61 56 57 44 45 �� 63 62 59 58 47
Acessed Datablocks: 38 39 40 41 42 43 114 115 116 117 118 119 120 121 122 123 124 125 126 127 128 129 212 213
Figure 6: Morton scheme. The shaded area indicates the data blocks associated with the given 4x4 cursor for the 2D case.
overhead of approximately 1.4GB to be stored in main memory, which conflicts with the original goal of working with the smallest possible CPU and main memory foot prints. The resulting data set for the described test case is 60GB.
3.4 Renderer The renderer is implemented as a plug-in component for VirtualExplorer, a VR toolkit developed jointly between the UC Davis and UC Irvine [9]. VirtualExplorer (VE) is a customizable plugin-based VR framework for immersive scientific visualization, data exploration and geometric modeling. The framework is layered on top of a run-time plug-in system and re-configurable virtual user interface and provides a variety of plug-in components. The system enables access to scene-graph-based APIs, including Performer and OpenInventor, direct OpenGL support for visualization of time-critical data as well as collision and generic device managers. Plug-ins can be loaded, disabled, enabled, or unloaded at any time, triggered either through pre-defined events or through an external Python-based interface. The framework is currently being extended with a variety of application areas in mind, with the most important ones being user-guided data exploration and highprecision engineering design. The CFD visualization toolkit provides two distinct plug-ins to enable out-of-core particle visualization. An optimized data loader and data streaming component and a designated OpenGL-based real-time rendering engine. The required user interface and interaction metaphors are provided through the VE framework. For example, the virtual particle injector can be controlled either through a spatially tracked input device or its appropriate keyboard- or software-based simulator. At start-up time, the plug-ins are launched as independent processes. The data acquisition process then acquires data from the RAID system and stores it in shared memory, together with the
required pointers. The specific data sets are determined by the current spatial coordinates of the cursor that is provided through the VE framework and constantly dispatched to the plug-ins. Initially, the renderer only reads the global header file and proceeds to create handles to all available particle files. As a consequence, the visualization system has nearly no pre-load delay before rendering. Once initialized, the user has interactive control over a box-shaped cursor of customizable size. The maximum cursor size is limited by the data transfer rate of the data storage system � that is used. A cursor encapsulating � particle injectors has proven very efficient for the tested visualization tasks. Once the cursor is positioned in the flow field, the matching particle injectors in it are calculated. Next, the corresponding file pointers are sorted and traversed. If the difference between two pointers is larger than the cursor size times the block size, the data up to the last pointer is read and a seek operation to the next pointer is performed. The underlying Morton order of the file pointers minimizes the amount of required seeks. For each point in the cursor, a pointer into the loaded data blocks is stored to enable rendering of the particles. During actual rendering, the list of pointers into the loaded blocks is traversed. Every particle is then transformed back into its original coordinate system and rendered. Particles are rendered as simple points with user adjustable color. The blend function of the 3D hardware is set to add up the RGB values per rendered pixel, therefore achieving the desired fog effect. By default particles are rendered as gray pixels onto a dark blue background, adding up the RGB values of overlying particles without Z-buffering. Particles that are in alignment with the viewing direction appear brighter. Finally, the background geometry, the cursor, model, integration area and navigation tools are rendered from a user-definable scene graph.
3.5 Interaction The application supports the advantages of head-tracking and natural two-handed input. It can utilize spatial tracking hardware and glove devices for the interaction with the data. A set of generic hand gestures is supported for intuitive scene navigation. Users can apply a walk, drive or fly metaphor to explore the environment or use translate, rotate and scale operations for more customized control. The particle injector can be attached to a tracked data glove or stylus device and freely positioned within the virtual wind tunnel. Particles can be injected at any time and for any duration. An advantage of the two-handed interface is that particles can be added to the flow field while the user navigates through it.
4. RESULTS
� A uniform rectilinear particle injector grid of �� was sufficient to visualize the key features of the turbulent flow. However, additional tests with different data sets are required to determine if an “optimal” injector size can be defined for arbitrary data. Initial runs indicate that the visualization algorithms are bound by the transfer rate from the side of the RAID. The data transfer rate currently translates into a stable update rate of 10 frames per second, with each frame representing a unique time step. The average CPU load on the system is roughly 20% while utilizing 128MB of RAM. The available data update rate of 10Hz is fast enough to support smooth visualization. Although the update rate is bound by the speed of the RAID system, the threaded rendering process runs at a frame rate of more than 75 frames per second. This performance makes the system suitable for real-time interactive stereoscopic rendering in virtual environments. The under-utilized CPU and memory resources allow for a variety of additional improve-
ments in rendering techniques and interaction. However, the turnaround time of the simulator using the current sequential implementation needs to be improved by a factor of at least 10.
4.1 Performance At the moment, the performance of the pre-processor seems to be poor in comparison with the performance of the renderer. As particle tracing can be efficiently parallelized, this is of less concern.
4.1.1
Pre-processing
Even though particle tracing for rectangular meshes leads to very fast algorithms, the sequential technique integrated in the finitedifference simulation program requires about a day to calculate all particles for the 250 time steps of the simulation. An improved parallel, out-of-core particle tracer is needed and should exploit bulk particle rendering.
4.1.2
Rendering
The theoretical minimal refresh rate of this system is given by �
��������� �"!#� $&%('()*�+%-,/. where � �+��� � = the average seek time of the RAID system and � $&%('()*�+%0, = the time needed to read in the largest block of particles in seconds. The value of � $&%0'()1�2%0, can be estimated from the raw throughput of the RAID system. In this case, �the assumed value of ������� � would be 10ms. With a cursor size of � injectors and an average of 130 active particles per injector, the largest data block size is 520KB assuming that eight bytes are used to represent each particle. With a data transfer rate of 60MB per second, the RAID system can deliver 118 blocks per second, resulting in � $3%('()*�+%0, = 8.47ms. Therefore, a theoretical minimal update rate of 11 frames per second is possible. The achieved frame rate is currently on the lower theoretical limit. Data fragmentation on the RAID system has to be analyzed more carefully and correlated with the 60MB per second peak transfer rate to provide a better performance measure.
5.
HARDWARE SETUP
All algorithms were developed with a wide range of system configurations in mind. However, the emphasis was to provide realtime visualization and interaction capabilities for low-cost commodity hardware. The current proof-of-concept system runs under RedHat Linux 6.2 on a PentiumIII (866Mhz) system with 512MB of main memory and a GeForce2 GTS graphics board (64MB). The data sets are stored on a 120GB E-IDE RAID system using four low-cost IBM DeskStar ATA 100 disks and an AMI Hyperdisk soft-raid controller. At this point, the available Linux drivers limit the RAID to ATA 66. Eye3D Premium shutter glasses were used for the creation of stereoscopic visualizations. This system configuration, in combination with the VirtualExplorer virtual reality framework, provides intuitive access to the common interaction metaphors. In the cost-optimized implementation, the user relies on mouse and keyboard mappings that simulate the more expensive spatial tracking and interaction devices. Considering the total price of less than US$ 2500 for this setup, the system delivers an astonishing price-performance ratio. If the user is not limited by system cost, additional tracking hardware such as the Polhemus Fastrak, Ascension Flock of Birds and the Fakespace PinchGlove in combination with more advanced projection displays such as workbenches or walls are supported and replace the device simulators.
6. CONCLUSIONS This paper introduces a new method for the interactive visualization of particle traces for large time-dependent CFD data sets and demonstrated that this method can be performed on commodity hardware. The described out-of-core visualization technique provides frame rates suitable for fully interactive virtual environments and scales for bigger data set sizes. Out-of-core algorithms in combination with the commodity PC based systems can aid in transitioning virtual reality applications into the main stream research and development as well as the consumer market. A distributed client-server based implementation which enables access to a wide range of available VR visualization hardware is currently being tested. The achieved data rates suggest that a coupling of the available systems using the common 100Mbit Ethernet is feasible for the described data complexity. System tests on a wide variety of already existing data sets are in progress. These tests will determine how efficient the data conversion tools are and how the system performs with tera-byte data sets streamed over a high-speed network. Experiments on how this method scales on larger and faster RAID systems need to be conducted and a wide range of possible optimization strategies such as data set partitioning and hard drive de-fragmentation explored.
7. ACKNOWLEDGMENTS This work was supported by the National Science Foundation under contracts ACI 9624034 (CAREER Award), through the Large Scientific and Software Data Set Visualization (LSSDSV) program under contract ACI 9982251, and through the National Partnership for Advanced Computational Infrastructure (NPACI); the Office of Naval Research under contract N00014-97-1-0222; the Army Research Office under contract ARO 36598-MA-RIP; the NASA Ames Research Center through an NRA award under contract NAG21216; the Lawrence Livermore National Laboratory under ASCI ASAP Level-2 Memorandum Agreement B347878 and under Memorandum Agreement B503159; the Lawrence Berkeley National Laboratory; the Los Alamos National Laboratory; and the North Atlantic Treaty Organization (NATO) under contract CRG.971628. We also acknowledge the support of ALSTOM Schilling Robotics and SGI. We thank the members of the Visualization and Graphics Research Group at the Center for Image Processing and Integrated Computing (CIPIC) at the University of California at Davis and the members of the Visualization and Interactive Systems Group (VIS) at the University of California at Irvine. We also thank Wolfgang Borchers from the University of Erlangen, Germany, for providing us with his CFD data set and finite-difference Navier-Stokes solver.
8. REFERENCES [1] D. A. Lane, “UFAT - A particle tracer for time-dependent flow fields”, in Proceedings of the Conference on Visualization, R. Daniel Bergeron and Arie E. Kaufman, Eds., Los Alamitos, California, USA, Oct. 1994, pp. 257–264, IEEE Computer Society Press. [2] C. Meiselbach and R. Bruckschen, “Interactive visualization: On the way to a virtual wind tunnel”, in Flow Simulation with High-Performance Computers, II, Ernst Heinrich Hirschel, Ed., vol. 52 of Notes on Numerical Fluid Mechanics, pp. 203–208. F. Vieweg and Sohn, Wiesbaden, Germany, 1996.
[3] Shyh-Kuang Ueng, C. Sikorski, and Kwan-Liu Ma, “Out-of-core streamline visualization on large unstructured meshes”, IEEE Transactions on Visualization and Computer Graphics, vol. 3, no. 4, pp. 370–380, Oct./Dec. 1997. [4] Frits H. Post and Theo van Walsum, “Fluid flow visualization”, Technical Report DUT-TWI-92-69, Delft University of Technology, Department of Technical Mathematics and Informatics, Delft, The Netherlands, 1992. [5] Michael B. Cox and David Ellsworth, “Application-controlled demand paging for Out-of-Core ´ Roni Yagel and visualization”, in IEEE Visualization 97, Hans Hagen, Eds., Los Alamitos, California, USA, Nov. 1997, IEEE Computer Society Press, pp. 235–244. [6] Mikael Jern and Rae A. Earnshaw, “Interactive real-time visualization system using a virtual reality paradigm”, in Visualization in Scientific Computing, M. G¨obel, H. M¨uller, and B. Urban, Eds., pp. 174–189. Springer-Verlag, Vienna, Austria, May 1994. [7] David N. Kenwright and David A. Lane, “Interactive Time-Dependent Particle Tracing Using Tetrahedral Decomposition”, IEEE Transactions on Visualization and Computer Graphics, vol. 2, no. 2, pp. 120–129, June 1996.
[8] H. J. Samet, Design and analysis of Spatial Data Structures: Quadtrees, Octrees, and other Hierarchical Methods, Addison–Wesley, Redding, MA, 1989. [9] Falko Kuester, Bernd Hamann, and Kenneth I. Joy, “Virtualexplorer: A plugin-based virtual reality framework”, in Proceedings of SPIE, R.F. Erbacher, P.C. Chen, M. Groehn, J.C. Roberts, and C.M. Wittenbrink, Eds., San Jose, California, USA, 2001, SPIE - The International Society of Optical Engineering. [10] T. J. Chung, Finite Element Analysis in Fluid Dynamics, McGraw Hill, 1987. [11] Robert Haimes and Dave Darmofal, “Visualization in computational fluid dynamics: A case study”, in Proceedings of Visualization ’91, Los Alamitos, California, USA, 1991, pp. 392–397, IEEE Computer Society Press. [12] W. Thompkins and R. Haimes, “A minicomputer/array processor/memory system for large-scale fluid dynamic calculations”, in Impact of New Computing Systems on Computational Mechanics, A. Noor, Ed., pp. 117–126. The American Society of Mechanical Engineers, 1983.
(a)
(b)
(c) Figure 7: Core vortex structure in the simulation. As the sphere is suddenly moved through the liquid, a fog ring forms (a). The vortex breaks down after about 50 time steps (b) and is replaced by a helix like structure (c). This figure is reproduced in color on page 202.