Keywords: BaBar, distributed computing, Objectivity, operational monitoring, ... rperf monitors a number of quantities; we look mostly at cpu usage and network ...
Visualization Tools for Monitoring and Evaluation of Distributed Computing Systems Developed for the BaBar Prompt Reconstruction System R.F. Cowan1? , G. Grosdidier2 for the BaBar Prompt Reconstruction and Computing Groups 1 2
Laboratory for Nuclear Science, Masschusetts Institute of Technology, Cambridge, MA 02139 USA LAL-IN2P3-CNRS, Universit´e Paris-Sud, Orsay, France (currently at SLAC) Abstract We describe several tools used to evaluate the operation of distributed computing systems. Included are tools developed for visual presentation of data accumulated from several sources. Examples are taken from the BaBar Prompt Reconstruction system, which consists of more than 200 individual nodes and transmits several hundred gigabytes/day to an object-oriented data store. Each node records its actions in a log file, and along with other performance logs, these supply the data required. One tool, a log analyzer and browser based on Perl/PerlTk, was developed to spot failures as recorded in the log files. It was built primarily to narrow the search for synchronous events (”hickups”) across the nodes to a few useful lines per node instead of a full log file of several megabytes each. It is also used to navigate through these log files and other failure reports, and as a presenter for the monitoring of the whole system. Another presents each node’s activities in a parallel manner to help detect situations where resource demands by one node affect the activities on others. These tools have contributed to the understanding of several problems encountered during this system’s development. Keywords:
BaBar, distributed computing, Objectivity, operational monitoring, performance evaluation, Perl/Tk, rperf, snoop, tcptrace, visualization, xmgrace
1 Introduction The BaBar Prompt Reconstruction System, which is described in detail elsewhere[1, 2], utilizes up to several hundred individual computing nodes to perform event reconstruction of the datastream from the BaBar detector at the Stanford Linear Accelerator Center. For the purposes of this note, the relevant portions of this system are a single-node event distributor, called the logging manager, a multiple-node event processing farm, and a few database servers that provide access to conditions data and receive the output data from the processing nodes. The output consists of C++ objects transmitted and stored using an object-oriented database product, Objectivity/DB[3, 4]. Each node is a Sun Ultra 5 running Solaris 2.6. Data is processed units of BaBar “runs”; a run is the data taken during one PEP-II fill, typically 200–300k events. A major goal is to track the performance of the farm as a whole and identify any particular bottlenecks that limit performance. These may indicate competition between the nodes for resources from the database servers or logging manager.
2 How monitoring is done Monitoring information is obtained from four sources: (1) individual farm node log files (one per node per run), (2) system performance (rperf) data gathered continuously by cron jobs; ?
Research supported by the U.S. Department of Energy under Cooperative Agreement #DE-FC02-94ER40818.
(3) database activity data (oolockmon), also gathered continuously via cron; and (4) network activity dump files (snoop, tcptrace) that are gathered during special tests. 2.1 Information sources Farm node log files are plain text files generated by the main processing application and may be as large as several megabytes each. They contain timestamps created every time the node progresses from one processing state to the next. Object database usage is monitored by tracking lock activity. Multiple access to the object data is controlled by a locking mechanism. The entire database, called a federation, is partitioned into a number of individual databases, which are further partitioned into containers. Locks occur at the container level and are of two kinds: “read” and “update”. Database activity can also be monitored by tracking the number of userids, unix process ids, and internal transaction ids accessing the database as a function of time. A standard unix utility, rperf, is used to gather system statistics from the nodes and servers. rperf monitors a number of quantities; we look mostly at cpu usage and network packet transfer rates. A cron job manages scripts that record periodic usage snapshots. Network use is monitored on-demand by logging network activity with the packet capture program snoop[6] and analyzing the logs with tcptrace[7]. tcptrace presents its information as xplot[8] files. We have written an xplot to xmgrace converter to provide more flexible data presentation. 2.2 Monitoring tools For each type of performance data we have developed a tool to present the data in visual form. We chose xmgrace[5] to produce the graphical output for all tools except the OprLogScan tool, which has its own GUI. xmgrace can be used interactively via its own GUI, where plots can be scaled, overlaid, transformed, annotated, etc., and can be run in batch mode using plain text control files. In either case hardcopy output can be produced for PostScript and other common formats. 2.2.1 The OprLogScan tool As the farm processes each run, it is crucial to be able to analyze activities simultaneously across the hundreds of log files to spot failures which can affect the processing over all the nodes. In particular, it can be critical to spot synchronous glitches across multiple nodes. The OprLogScan script was developed mainly in this spirit, and obviously Perl was very well suited for this task, due to its ability to handle character strings. To display the results of the scan process, a GUI was built in Perl/Tk, and it is logically and technically totally embedded within the Perl analyzer: it allows to easily get multiple windows to compare simultaneous events, to display summaries at one time, and to use the tag facilities offered through Perl/Tk to navigate across all the windows (Figure 1). [This and additional figures may be found at http://www.slac. stanford.edu/BFROOT/www/Computing/Online/PromptReco/CHEP2000/paper186.] The overall application, while digging into several hundred files of several megabytes each, remains quite fast and effective, and allows monitoring of the processing in real time, with a summary window showing in reverse video the differences with the previous snapshot. We have been using Perl 5.00503 together with Perl/Tk 800.014 for this work, with very few failures.
Figure 1: OprLogScan screen snapshot showing summary window, single log file window, and time slice window.
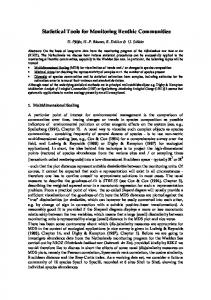
2.2.2 Event processing time monitoring The processing steps of each event’s data are the same across events and across nodes, and can be treated as a state machine with sixteen possible states. This small number of states permits a simple graphical depiction of each node’s state as a function of time. We have chosen to present this as a series of barchart strips, one per node. A C-shell script scans the log files, extracts the state transition times, and stores them in a file. A second tool reads this and creates a graphics file for xmgrace. This file is processed and a barchart is produced (Figure 2). Up to twenty nodes can be readably plotted on a single page. These can be time-sliced and zoomed to provide additional detail. A third tool reads the summary file and produces histograms (Figure 3) of time spent in various states and combinations thereof for either all events or for events of certain types (e.g., bhabhas, multihadrons, etc.). 2.2.3 Database activity monitoring We developed tools to monitor database activity (Figure 4). As well as assisting with sorting out bottlenecks, these plots give an excellent measure of overall operation by showing the explicit downtime between run cycles. 2.2.4 System performance monitoring System performance data is monitored via rperf, a common Unix system statistics gathering tool. A cron job controls scripts that log system performance data. A plotting tool extracts selected data
Run−9953−1−99−12−09.05:33:06
First Fwk Start
Thu Dec 9 05:35:38 1999, page 1 of 5
This Fwk Start
bronco031 bronco030 bronco029 bronco028 bronco027 bronco026 bronco025 bronco024 bronco023 bronco022 bronco021 bronco020 bronco019 bronco017 bronco016 bronco015 bronco014 bronco013 bronco012 bronco011
Initialize Objy TRANS: start read TRANS: commit begin Job 1st new trans strt begin Run beginCB trans committed new trans started OFTM event doEvent started doEvent completed
0
2
4
6
8
10
12
14
16
18 20
22
24
26
28
30
about to commit endCB
Time (minutes) (0=Thu Dec 9 05:35:38 1999 ) Mon Dec 13 09:11:39 1999
Figure 2: Barchart strip display of state transitions for 20 nodes. The vertical key on the right names the state associated with each color. Individual node names are on the left axis. Lengthy stretches of red indicate unexpectedly long times to send output data to the object database.
Run−9953−1−99−12−09.05:33:06 Event type timing histogram for events passing TagInspector "isRecoMultiHadron" 790 isRecoMultiHadron: 10053 entries, min 2.000000 < 15.013727 ± 29.604274 < max 570.000000
632
counts
474
316
158
0 0
20
40 60 event time (seconds)
Sun Jan 9 16:11:42 2000
80
100
R. Cowan Laboratory for Nuclear Science M.I.T.
Figure 3: Event processing time histogram for events classified as multihadrons. This data is extracted from the same event timing summary file as used for the barchart strips.
Opr Production Federation Usage for 27 Dec 1999 00:00−24:00 /nfs/objyserv1/objy/databases/Production/physics/V1/production/opr/BaBar.BOOT 140 #uid@host #pid@host #transaction ids
120
#ids
100 80 60 40 20 0 6000
#total locks #update locks
5000 #locks
4000 3000
2000 1000 0 99−12−27 06:00:00
99−12−27 12:00:00 Date/time
99−12−27 18:00:00
Sun Jan 9 16:49:49 2000
99−12−28 00:00:00
R. Cowan Laboratory for Nuclear Science M.I.T.
Figure 4: Database activity plot, showing locks (bottom) and number of processes, users, and transactions (top) accessing the database. Each activity period corresponds to one run’s processing cycle.
OPR Farm Test From Tue Nov 09 13:00:00 1999 to Tue Nov 09 14:00:00 1999 bronco006 bronco007 datamove4 datamove5 datamove8
Cpu Usage (%) (Usage = System + User)
100.0
80.0
60.0
40.0
20.0
0.0 0.0
20.0 40.0 time (minutes) (0=Tue Nov 09 13:00:00 1999)
60.0
Figure 5: CPU usage for certain nodes during a test. Data is taken from rperf logs. The tool can plot any
rperf-reported quantity.
from the log files for periods of interest and creates xmgrace batch files (Figure 5).
2.2.5 Network activity monitoring Monitoring network activity has proven useful on a few occasions to debug problems in communication between the farm nodes and the servers. We used existing tools to capture network activity (e.g., snoop[6]) and to analyze the captured data (e.g., tcptrace[7]). However, tcptrace uses a plotting tool called xplot[8], and in keeping with our use of xmgrace, we wrote an xplot-toxmgrace converter, at least for the xplot commands that tcptrace uses, since xmgrace is more flexible.
3 Conclusions The development of these tools was crucial to the timely understanding of the BaBar Prompt Reconstruction system. Each was developed to address a particular set of problems and provided information that was critical in overcoming difficulties encountered in development. They were very successful in allowing the project to move forward. They also provide an archival history of the operational characteristics of the system. These tools are easily adaptable to monitor other quantities; all that is needed is to replace the front-end data extraction portions as appropriate. They have also been successfully used to study the behavior of other BaBar processing environments. These tools are still undergoing development as software changes continue to occur. New diagnostic capabilities are added every month or two to look at new problems and behavior as the system grows.
References 1
2
3
4
5
6 7
8
T. Glanzman, J. Bartelt, T.J. Pavel, S. Dasu, The BaBar Prompt Reconstruction System, SLAC-PUB-7977, Oct 1998. 8pp. Presented at International Conference on Computing in High-Energy Physics (CHEP 98), Chicago, IL, 31 Aug–4 Sep 1998. T. Glanzman et al., The BABAR Prompt Reconstruction System, or Getting the Results out Fast: an evaluation of nine months experience operating a near real-time bulk data production system. Presented at International Conference on Computing in High-Energy Physics (CHEP 2000), Abstract #288, Padova, Italy, 7–11 Feb 2000. D. Quarrie et al., Operational Experience with the BaBar Database. Presented at International Conference on Computing in High-Energy Physics (CHEP 2000), Abstract #103, Padova, Italy, 7–11 Feb 2000. J. Becla, Improving Performance of Object Oriented Databases, BaBar Case Studies. Presented at International Conference on Computing in High-Energy Physics (CHEP 2000), Abstract #110, Padova, Italy, 7–11 Feb 2000. xmgrace is a plotting utility for X windows and has been ported to VMS, OS/2, and Win9*/NT. Complete information on xmgrace and the package itself are available at http://plasma-gate.weizmann.ac.il/Grace. Distributed by Sun Microsystems. tcptrace is a TCP dump file analysis tool written by Shawn Ostermann at Ohio University. More information is available at http://jarok.cs.ohiou.edu/software/tcptrace/ tcptrace.html. The xplot program, written by Tim Shepard, can be found at ftp://mercury.lcs.mit. edu/pub/shep.