Echocardiogram View Classification using Edge Filtered Scale-invariant Motion Features
1
Ritwik Kumar1 , Fei Wang2 , David Beymer2 , Tanveer Syeda-Mahmood2 Department of Computer and Information Science and Engineering, University of Florida, FL, USA 2 IBM Almaden Research Center, San Jose, CA, USA
[email protected], {wangfe, beymer}@us.ibm.com,
[email protected]
Abstract In an 2D echocardiogram exam, an ultrasound probe samples the heart with 2D slices. Changing the orientation and position on the probe changes the slice viewpoint, altering the cardiac anatomy being imaged. The determination of the probe viewpoint forms an essential step in automatic cardiac echo image analysis. In this paper we present a system for automatic view classification that exploits cues from both cardiac structure and motion in echocardiogram videos. In our framework, each image from the echocardiogram video is represented by a set of novel salient features. We locate these features at scale invariant points in the edge-filtered motion magnitude images and encode them using local spatial, textural and kinetic information. Training in our system involves learning a hierarchical feature dictionary and parameters of a Pyramid Matching Kernel based Support Vector Machine. While testing, each image, classified independently, casts a votes towards parent video classification and the viewpoint with maximum votes wins. Through experiments on a large database of echocardiograms obtained from both diseased and control subjects, we show that our technique consistently outperforms stateof-the-art methods in the popular four-view classification test. We also present results for eight-view classification to demonstrate the scalability of our framework.
1. Introduction Echocardiography is an important diagnostic aid in cardiology for the morphological and functional assessment of the heart. During an echocardiogram exam, a sonographer images the heart using ultrasound by placing a transducer against the patients chest. Reflected sound waves reveal the inner structure of the heart walls and the velocities of blood flows. Since these measurements are typically made using 2D slices of the heart, the transducer position is varied during an echo exam to capture different anatomical sections
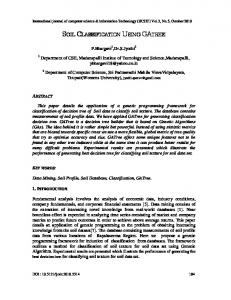
Figure 1. Images from the eight echocardiogram viewpoints in this paper. In clockwise order from top left, Apical Four Chamber (A4C), Parasternal Long Axis (PLA), Parasternal Short Axis - Basal (PSAB), Parasternal Short Axis - Papillary (PSAP), Apical Two Chambers (A2C), Apical Three Chambers (A3C), Apical Five Chambers (A5C), Parasternal Short Axis - Mitral (PSAM).
of the heart from different viewpoints. In current clinical practice, transducer positioning and viewpoint capture requires manual intervention in both imaging and in interpretation. The sonographer manually delineates major anatomical structures like Left Ventricle (LV) and computes numerical quantities like ejection fraction from the images. This data is examined further by a cardiologist who makes the diagnosis based on the interpretation made from the echocardiogram. The knowledge of the probe viewpoint plays a crucial role in the interpretation process as it tells the examiner what exactly is he or she looking at. Fig. 1 shows some of the more common viewpoints captured during an echo exam, including apical 4 chamber and parasternal long axis. In the last few years, there has been tremendous progress in the field of cardiac view recognition in echocardiograms [17, 16] and similarity search based decision support systems for cardiology [3]. The primary focus in such systems is to be able to automatically detect features from the echocardiogram video which can then be used to conduct higher level disease discrimination and similarity search. Hence, the automatic echocardiogram view classification, the first step in any such system, has gained importance. Being primarily an image based classification problem, it
has attracted considerable attention from the computer vision and pattern recognition community [6, 20, 17, 3]. The problem that we tackle in this paper is that of automatically assigning view labels to echo videos obtained from unknown viewpoints. This problem is hard because even for videos belonging to same viewpoint, significant variation arises from differences in pathologies, patients, instruments, and sonographers’ expertise. The problem is complicated further by the fact that the images obtained by echocardiogram generally have high noise and low contrast. Furthermore, even for videos belonging to different viewpoints, its not trivial to label the viewpoints and experts like cardiologist and cardiac sonographer are required. In addition to this, obtained images can be translated, rotated or zoomed with respect to others. A key component in any view classification system is one of representation – what feature set is used to represent a video? It is well-known in the pattern recognition community, for example, that the proper choice of feature representation has a greater impact on performance than selecting among the top network architectures. In this paper, we present a view classification approach that uses a stateof-the-art classifier, vocabulary-based PMK and multiclass SVMs [9], and pairs it with a novel and powerful set of motion and edge-based features. In our technique, interest points are scale-invariant points in the motion magnitude map that are also near intensity edges. This combination of motion and intensity features allows out system to select the important portions of echo cardiac anatomy to make the classification stage a success. The eight viewpoints classified by our system are shown in Fig. 1. The rest of the paper is organized as follows. Section 2 provides a survey of the existing techniques for view recognition. In Section 3 we describe our framework for feature detection and description. The training and testing algorithms are presented in Section 4. Section 5 presents experimental results and a comparison with state-of-the-art techniques. Finally, we conclude in Section 6.
2. Previous Work In the first automatic cardiac view recognition system, Ebadollahi et al. [6] proposed a constellation-of-parts based method. They used a generic heart chamber detector [2] to locate heart chambers, and they represented the spatial arrangement of the chambers using a Markov Random Field (MRF) based relational graph. Final classification of a test image was performed using a Support Vector Machine on MRF network output. This method suffers from sensitivity of the chamber detection method to frequently present noise in the echocardiogram images while demonstrating limited robustness to basic image transformations. Aschkenasy et al. [1] represented each view by a signature obtained by multi-resolution spline filtering of the
Figure 2. The first column shows intensity images, the second and third columns show motion magnitude and phase from optical flow computed between the first column frames and next video frame. The first two rows are Apical Four Chamber view while the last two are Parasternal Long Axis. For motion magnitude and phase images, brighter colors represent higher values. Intraclass similarity and interclass disparity can be readily noted in the motion magnitude images. All four rows belong to different patients.
training images. For a test image, these templates were elastically deformed and the deformation energy along with similarity were used to classify the test image using a linear discriminant. Drawbacks of this method include the use of a classifier with limited discrimination ability as well as the use of features which are accurate only when the test image and template are close to one another. Zhou et al. [20] cast view recognition as a multi-class object detection problem. Using a multi-class LogitBoost network, this work exploited both positive examples corresponding to viewpoint along with negatives corresponding to background. The use of Haar-like rectangular features, however, makes the method sensitive to presence of noise in the images. Further, large number of Haar-like features necessitated pruning and high recognition rates were only guaranteed when sophisticated methods were included to handle contradicting recognition results. Results for only two-view classification were presented in this paper. Otey et al. [16] proposed a hierarchical classification strategy for view classification where first a classification into corresponding view type (e.g. Apical, Parasternal etc) was made, followed by a final view classification within the type. Features included gradient, peak, raw pixels and other
Figure 3. Images from top row, first two columns of Fig. 2 overlaid (motion in green and intensity in red). Significant motion (bright green) in the motion magnitude image corresponds to anatomical features like heart valves, while extraneous motion is localized to noise infested ”blank” regions e.g. heart chambers.
statistical features, which were then fed to dimensionality reduction stage. The final classification was made using Logistic Model Tree classifier at both levels. Park et al. [17] revisited boosting for view classification, where they used the MLBoost learning algorithm along with multi-object detection and integrated local-global features. Their system was built around a Haar-like feature based Left Ventricle (LV) region detector, and each view was modeled according to the spatial layout of other heart chambers with respect to the LV region. In this system, test images were classified based on their spatial region layout with respect to the template region layouts. View classification is made based on a key frame from the given echo video, the end diastolic frame. This method cannot be used to detect views in which LV region is absent. Roy et al. [18] proposed the use of simple intensity histograms for view classification. They reasoned that as different regions and chambers are visible in different echo viewpoints, the intensity distribution can help discriminate viewpoint. The final classification was made using a multilayer perceptron where the number of hidden layer units was empirically chosen. The signature histogram for a given echo image is heavily dependent on the region of interest for which intensity values are considered, and the choice of this region is not made explicit in this work. Most recently, Beymer et al. [3], for the first time, proposed to exploit the motion information present in the echocardiogram videos for view classification. They used Active Shape Models (ASMs) to capture the shape and texture information and then tracked these across different frames to derive motion information. All the informa-
tion is concentrated by projecting it down to a low variance eigenspaces and the final classification is done by minimizing a ”sequence fit” measure. One of the downsides of this technique is that ASMs require manual delineation of shape in the training data, which can be time consuming. This work also presented a comparative study of some of the competing view classification methods. View recognition problem can also be looked at as an object recognition problem if we identify each view as a different object class. It has been purported that intraview variation observed in echocardiogram videos is too complicated for generic object recognition methods to handle [3]. We present comparison with one of the more effective object recognition techniques [8], which uses SIFT features [15] and Pyramid Matching Kernel (PMK) [8] based SVM classifier, to address this issue. With regards to previous work in echo view recognition, out work acheives the highest recognition rate and is the most extensible. Compared to the 4-class recognition experiments in [17] and [3], our 4-class recognition accuracy is higher. Built on a scalable framework, our system does not require an initial LV detection stage as in [17] or an expensive manual labeling during training as in [3]. Also, our system is the first to report good results on a larger 8-class viewpoint class experiment. But more generally, our paper makes an important contribution in its fusion of motion and intensity to form a discriminating “spatiotemporal” feature. As detailed in the following section, our features are unique both in their location and description. Feature locations are scale invariant interest points in motion magnitude that are also close to intensity edges. Feature descriptions include position (x, y) and histograms of local motion and intensity. The utility of these features is borne out through a comparison with the SIFT/PMK experiment in [3]. A survey of object, activity and scene recognition literature reveals that there has been attempts to use motion to define features but none has explored detecting and encoding features as we do. Jhuang et al. [11] used a hierarchy of detectors for finding interest points, and one of stages in the system uses features based on filtering of optical flow. Sidenbladh and Black [19] used motion features obtained from the time derivative of wrapped consecutive frames at multiple scales. Dalal et al. [4] used oriented histogram of differential optical flow over the entire image but did not use optical flow to detect any interest points while Laptev et al. [14] used the same histograms but at points detected using [13]. Efros et al. [7] used rectified and blurred optical flow over the whole image for human detection, but motion is not used for interest point detection. Ke et al. [12] used volumetric spatio-temporal features for activity recognition. Dollar et al. [5] used histograms of x and y components of optical flow for encoding features but the interest point de-
tection was done using Quadrature Gabor Filters. Using scale invariant features detected on the edge filtered motion magnitude field has the distinct advantage of being able to locate anatomical features with significant motion, which these above methods lack. Further, since we use the histogram of motion magnitude to encode our feature vectors, locating them where motion is interesting makes sense.
3. Modeling Viewpoint using Edge-filtered Motion Features Since the native form of the data obtained from echocardiogram is a video of anatomical structures in motion, we ideally seek a model which exploits all the information (structural, textural and motion) present in video for viewpoint discrimination and is not limited to using a few key frames. Further, we want a method which can be seamlessly applied to any viewpoint and is not limited to any particular subset of viewpoints (like in [17]), and thus our technique should be independent of the presence of specific anatomical structures in the images. And finally, our technique should provide recognition rates which are competitive with respect to the existing state-of-the-art. In order to satisfy these conditions, we propose a framework which works with a few salient features obtained from analysis of both intensity frames (structural and textural information) and optical flow (motion information) in a given video sequence. In the next subsections we describe the basic preprocessing and the two important aspects of salient feature selection process - localization and encoding.
3.1. Preprocessing Echocardiogram videos undergo some basic preprocessing before we begin the process of feature point localization and encoding. This includes extraction of the fan sector (which contains the actual image) and a rough alignment. For extraction of the region of interest, either manual or template matching based automated technique can be used (or the method described in [16]). Once the fan sector has been extracted, using the top, left and right extreme points, we automatically align all the echocardiogram videos with each other via an affine transform. The three points mentioned above are sufficient to compute the affine transformation matrix. Even though the classifier that we intend to use, PMK based SVM, is capable to handling small amount of image transformational discrepancies, this initial alignment improves the discrimination ability of our system.
3.2. Feature Localization In a given echocardiogram video of a heart cycle, there are image regions (corresponding to different anatomical structures) which demonstrate significant amount of motion and other regions which do not. Furthermore, these regions
Figure 4. Top rows shows echocardiogram frame and its edge map. Second row shows the motion magnitude corresponding to frame in the top row in red with detected feature points in green. Bottom row shows the features filtered using the edge map.
are disparate for different viewpoints while similar for image sequences belonging to same viewpoints. To characterize this information, we analyzed the optical flow for echocardiogram video sequences computed using Demons algorithm [10]. There are two important things to be noticed about the optical flow obtained for the echocardiogram image sequences: 1) the deformation field contains a considerable amount of noisy motion (even after smoothing) as an artifact of the noise present in the intensity images, and 2) of the two components of the motion field magnitude and phase, phase is sensitive to image transformations (rotation, translation etc) while magnitude is comparatively more stable (see Fig. 2).
Figure 5. The proposed feature location and description algorithm. The frames of the training videos undergo affine alignment and then optical flow for each video is computed. Scale invariant features are detected from the magnitude of the optical flow and only those feature points which lie in vicinity of the intensity image edge are retained. The features are finally encoded using the location, local texture histogram and local motion magnitude histogram.
Choosing features on motion magnitude alone would select a number of weak features that follow erroneous motion and noise. Motion in echocardiogram images is meaningful only when it is associated with anatomical structures, and this information is absent in the motion magnitude images. This is shown in Fig. 3, where intensity image has been overlaid over the corresponding motion magnitude image. We propose using the structural information present in the intensity images to guide the feature localization process. To achieve this we filter the motion magnitude images using an edge map on image intensity. Thus, only motion which corresponds to anatomical structures is retained while the remaining extraneous motion is disregarded. Given these edge-filtered motion maps, the next step is to choose specific interest points. In the field of object recognition, much work exists on locating interest points (e.g. space time features [13], scale-invariant features [15] etc). For our implementation we have chosen to use scaleinvariant features primarily due to their simplicity and effectiveness. It must be noted that a direct application of the these object recognition methods to echocardiogram images is largely ineffectual (as demonstrated by Beymer et al. [3]) primarily on account of low contrast and noise in echocardiogram images. To the best of our knowledge, we are the
first to exploit edge filtered motion magnitude images for obtaining discriminating features in either echocardiogram viewpoint or object recognition literature. Filtering the motion magnitude image using the edge map means that motion magnitude information only in the neighborhood of intensity edges is retained. As scale invariant features [15] are sensitive to edges in the image, we avoid features arising from artificial edges by first detecting features on the motion magnitude image and then retaining only those which lie in some neighborhood of the intensity edges. This process is demonstrated in Fig. 4. Note that, this process is not same as a mere sampling of the edges because the features points that we retain correspond to significant motion, and we will use this crucial information when we encode the features.
3.3. Feature Description Once the features have been located, the next important step is to encode them using information which will be useful in discrimination. Foremost, the location itself is important information, so we want to include (x, y) image coordinate of the feature in our description. Next, in order to account for all important motion information, we include a histogram of motion magnitude in a
window around the feature point in our description. Here we leave out the phase information because it is sensitive to common image transformations like rotation. The advantage of including motion magnitude information is that it can encode a certain amount of anatomical information (e.g. feature points around heart valves would have a motion magnitude histogram skewed towards higher values). The structural information present in the intensity images is also important and we include it using a histogram of the intensity values in a neighborhood around the features point. Using histograms of both motion and texture information brings in robustness to possible presence of outliers in the actual values of texture and motion magnitude. Note that the scale invariant features (SIFT) [15] also include a method for feature description using oriented histograms of image gradients but these are found to be in effectual for echocardiogram images (as gradients are too noisy). The novel description presented here outperforms SIFT descriptors by a considerable margin (Section 5). The complete feature selection and description framework is presented in Fig. 5.
4. Training and Testing Algorithms Once the salient features have been detected and encoded, an effective classification technique is required for viewpoint discrimination. Most of the existing methods use a single key frame from the echocardiogram video sequence for classification purpose while we conjuncture that better performance can be obtained if we more information that is present in the video sequence. The classification framework that we propose uses as many frames per video sequence as desired. We classify each frame independently and each frame casts a vote towards parent video classification. A given video sequence is assigned a class which gets the maximum votes from the constituent frames. In case of a tie reclassification is done only among tied classes. Empirically we have noted that classifying the video randomly is equally effective as the number of cases with ties are rare. One advantage of this technique is that the crucial problem of key frame selection is resolved, as the frames we use are obtained by uniformly sampling the video sequence. Further, using multiple frames per video brings in some robustness to the classification process as misclassification by a few outlier frames is automatically discounted. The training algorithm in our system (Algorithm 1) detects and encodes salient features for each frame in the training data. Then a hierarchical dictionary is learnt from all the features in the system using non-uniform bins [9]. Then the dictionary is used to learn the model parameters of a kernelbased SVM [9]. The testing algorithm (Algorithm 2) detects and encodes the salient features in the given test video sequence in a similar manner as the training algorithm. Then using the learnt dictionary and SVM, each frame is indi-
Algorithm 1: View Classification Training Input: Labeled Training Echocardiogram Videos: trainSet, Neighborhood Size: nh, Number of Frames: n Output: SVM Parameters: M , Feature Dictionary: D 1 Pick a reference frame and detect its 3 anchor points 2 foreach Video V ∈ trainSet do 3 FV = {n equidistant frames ∈ V } 4 foreach frame f ∈ FV do 5 Feature Set for f , F SVf = {}. 6 Extract Region of Interest (ROI). 7 Detect the 3 anchor points. 8 Compute Affine matrix w.r.t. reference frame. 9 Apply the affine matrix and align ROI. 10 MVf = Optical Flow w.r.t. next frame in sequence. [10] 11 EVf = Edge map of f . 12 M ag = ||MVf ||2 . (Motion Magnitude) 13 F T ={ Scale invariant features in M ag [15]}. 14 foreach Feature i ∈ F T do 15 Loc = (x, y) coordinate of i. 16 if Loc ∈ nh × nh neighborhood of some edge ∈ EVf then 17 THist = histogram of nh × nh intensity neighborhood of i. 18 MHist = histogram of nh × nh motion magnitude neighborhood of i. 19 F TVi ec = concat(Loc, THist , MHist ). S 20 F SVf = F SVf {F TVi ec } S S
F SVf [9].
21
Learn Dictionary, D, from
22
Learn SVM parameters M using F SVf , D & PMK [9].
V
f
vidually classified and final classification is made using the voting scheme described earlier.
4.1. Parameter Selection Like any other learning based method, there are a few parameters that need to be set in our system. Here we provide some meaningful heuristics that can be used to set these parameters. Foremost is the number of frames per video to be used for classification. We have noticed that as the number of frames increases so does the recognition rate, but at the expense of computation time, so this parameter should be set based on accuracy-efficiency trade-off. Next is the neighborhood size selection for edge filtering, motion and texture histogramming. Here we have noticed that a neighborhood size of around 10 % of the ROI (rectangle containing image sector/fan) size provides the best result. This number is also used to set the number of bins in histograms.
Algorithm 2: View Classification Algorithm Input: Learnt SVM Model: M , Test Echocardiogram Videos: testV ideo, Dictionary:D Neighborhood Size: nh, Number of Frames: n 1 FtestV ideo = {n equidistant frames ∈ testV ideo } 2 vote = zeros(numberOf P ossibleV iews). 3 foreach frame f ∈ FtestV ideo do f 4 Compute F StestV ideo as described in Alg. 1. f 5 Classify f using F StestV ideo , SVM M and D. 6 class(f ) = view obtained by classification. 7 vote(class(f )) = vote(class(f )) + 1. 8
Classify testV ideo as argmaxview {vote(view)}.
Minor changes in this size does not have any significant impact on recognition rates. Parameters of scale invariant features detector are set to give around 200 features per frame. The next parameter is the dictionary size used during the learning phase. We set it such that 5 % of the total features are retained in the dictionary with random initialization. And finally, each component of the feature vector is uniformly weighted during dictionary creation.
5. Experiments In order evaluate the performance of our view classification framework, we present results from two sets of experiments. First, in order to compare the performance of our method with existing state-of-the-art techniques, we present classification results using A4C, PLA, PLAB and PLAP view points (same as those used in Beymer, et al. [3]). Second, to demonstrate the capability of our method to easily expand to classify more than just four views, we present results for a much larger and complicated eight way viewpoint classification problem. We conducted our experiments on a large collection of echocardiogram videos1 which contains 113 echocardiogram video sequences belonging to eight different viewpoints. Details of the database are listed in Table 1. The videos were captured at 320 × 240 pixel size at 25 Hz. The ECG waveform included in the video was used to extract a heart cycle synchronized at the R-wave peak. These video were manually labeled as belonging to one of the eight views. For the first experiment, we implemented the setup described in [3]. We used four viewpoints from the data set and conducted training and testing in a leave-one-out fashion. The experiment was repeated 20 times with each time a different random initialization of the feature dictionary. Average recognition rates are reported in Table 2, where 1 Downloaded from the web page of an author http://www.cise.ufl.edu/∼fewang/echoview mmbia2008.html
of
[3]
View A2C A3C A4C A5C
Videos Frames View Videos Frames 11 237 PLA 18 384 6 129 PSAB 12 271 26 597 PSAP 16 370 11 209 PSAM 13 237 Total Videos: 113, Total Frames: 2470
Table 1. Number of videos, frames and views in our data set. Method/Views ICCV 2005, SIFT+PMK [8] ICCV 2007, ML-Boosting [17] MMBIA 2008, ASM+Motion [3] Our Method
A4C 59.3
PLA 65.5
PBAB 47.7
PSAP 73.2
All 62.0
80.3
75.5
67.5
70.9
74.9
96.2
88.9
91.6
75.0
88.9
96.2
98.9
100.0
100.0
98.4
Table 2. Comparison with the state-of-the-art method in recognition accuracies for four-way classification. Recognition percentages are reported.
each row contains results using the method cited next to the method name. Results for the competing methods were taken from [3]. The best result in each column is highlighted in bold. Our method was run with 20 frames per video and neighborhood size of 15 × 15 pixels with 15 bin histograms. The dictionary was set to have approximately 14000 features (using the heuristic mentioned earlier). The second experiment included all the eight classes mentioned in Table 1. We conducted the training and testing in a leave-one-out fashion and repeated the experiment 20 times each with a different random initialization of the dictionary. The confusion matrix for the viewpoint classes using our method, presented in Fig. 6, yields an average recognition rate of 81%. Our method was run with 20 frames per video and neighborhood size of 15 × 15 pixels with 15 bin histograms. The dictionary was set to have approximately 23000 features. Our implementation can process a video with 20-30 frames in under 1 minute.
5.1. Discussion It can be noted from the results reported in Table 2 that our method outperforms all of the existing state-of-the-art methods by a convincing margin. We attribute this primarily to a better and more comprehensive use of the information present in echo videos. When compared to the results presented in [3], besides the better recognition rates, the significant advantage of our techniques is that time and effort consumed by manual labeling of the ASM features is not required. This translates to seamless expansion of our method to more view classes and larger training sets. We have also presented comparison to the classification method presented in [17]. This method is built around a
features detected on edge filtered motion magnitude images and PMK based SVM. Through experiment on real data we have demonstrated the our method convincingly outperforms existing state-of-the-art methods for echo view classification. We have also presented results for a more difficult eight-way view classification problem. Future work may include exploring hierarchical classification strategies with our features to attain higher recognition rates with even more view classes.
References Figure 6. Confusion Matrix for eight-way view classification. Numbers are the fraction of videos classified. Recognition rate over all videos is 81.0 %.
Haar-like feature based Left Ventricle (LV) detector which severely limits its capability to effectively classify those views which lack LV region. Note that results presented are from a re-implementation of the method which uses Left Atrium region in place of LV for PSAB view and Haarwavelet local features (as in the original paper) for LV detection. Our method demonstrates better recognition rates as well as capability to include more view classes (with or without LV) over this technique. Moreover, being a boosting based method, [17] tends to only work well when very large amount of training data is provided. Finally, we have compared our method to an otherwise quite effective object recognition method presented in [8]. This implementation used 25 images per view class and PCA to reduce the dimension of 128-long SIFT feature vectors to 2. Classification was done using PMK based SVM with 6-D feature vectors ((x, y) location, scale, orientation, 2 PCA coefficients). This comparison is particularly important here because it demonstrates the importance of looking for good features at the right place, in our case, motion magnitude images. SIFT features have been widely used in various object and image recognition application, but as demonstrated here, a direct application of SIFT based classification is ineffective. From the results presented for the second experiment (Figure 6), it can be noted that even when the problem of view classification is complicated by presence of multiple similar looking classes, our method can still yield good results. It can be noted that the 3 new Apical views create confusion with A4C view while PSAM creates confusion with the other Parasternal views. Recognition rate over all videos is 81.0%.
6. Conclusion We have introduced a novel scalable system for echocardiogram viewpoint classification which uses scale invariant
[1] S. Aschkenasy, C. Jansen, R. Osterwalder, A. Linka, M. Unser, S. Marsch, and P. Hunziker. Unsupervised image classification of medical ultrasound data by multiresolution elastic registration. Ultrasound in Medicine and Biology, 32(7):1047–1054, 2006. [2] D. R. Bailes. The use of the gray level sat to find the salient cavities in echocardiograms. Journal of Visual Communication and Image Representation, 7(2):169–195, 1996. [3] D. Beymer, T. Syeda-Mahmood, and F. Wang. Exploiting spatio-temporal information for view recognition in cardiac echo videos. In IEEE Computer Society Workshop on Mathematical Methods in Biomedical Image Analysis (MMBIA), pages 1–8, 2008. [4] N. Dalal, B. Triggs, and C. Schmid. Human detection using oriented histograms of flow and appearance. In ECCV, 2006. [5] P. Dollar, V. Rabaud, G. Cottrell, and S. Belongie. Behavior recognition via sparse spatio-temporal features. In 2nd joint IEEE international workshop on visual surveillance and performance evaluation of tracking and surveillance, 2005. [6] S. Ebadollahi, S. Chang, and H. Wu. Automatic view recognition in echocardiogram videos using parts-based representation. In CVPR, pages 2–9, 2004. [7] A. A. Efros, A. C. Berg, G. Mori, and J. Malik. Recognizing action at a distance. In ICCV, 2003. [8] K. Grauman and T. Darrell. The pyramid matching kernel: Discriminative classification with sets of image features. In ICCV, 2005. [9] K. Grauman and T. Darrell. Approximate correspondences in high dimensions. In NIPS, 2006. [10] A. Guimond, A. Roche, N. Ayache, and J. Meunier. Threedimensional multimodal brain warping using the demons algorithm and adaptive intensity corrections. IEEE Transactions on Medical Imaging, 20(1):58–69, 2001. [11] H. Jhuang, T. Serre, L. Wolf, and T. Poggio. A biologically inspired system for action recognition. In ICCV, 2007. [12] Y. Ke, R. Sukthankar, and M. Hebert. Efficient visual event detection using volumetric features. In ICCV, 2005. [13] I. Laptev. On space-time interest points. IJCV, 2005. [14] I. Laptev, M. Marszaek, C. Schmid, and B. Rozenfeld. Learning realistic human actions from movies. In CVPR, 2008. [15] D. G. Lowe. Distinctive image features from scale-invariant keypoints. IJCV, 60(2):91–110, 2004. [16] M. Otey, J. Bi, S. Krishna, B. Rao, J. Stoeckel, A. S. Katz, J. Han, and S. Parthasarathy. Automatic view recognition for cardiac ultrasound images. In MICCAI: Intl Workshop on Computer Vision for Intravascular and Intracardiac Imaging, pages 187–194, 2006. [17] J. Park, S. Zhou, C. Simopoulos, J. Otsuki, and D. Comaniciu. Automatic cardiac view classification of echocardiogram. In ICCV, pages 1–8, 2007. [18] A. Roy, S. Sural, J. Mukherjee, and A. K. Majumdar. Statebased modeling and object extraction from echocardiogram video. IEEE Transactions on Information Technology in Biomedicine, 12(3):366–376, 2008. [19] H. Sidenbladh and M. J. Black. Learning the statistics of people in images and video. IJCV, 54:54–1, 2003. [20] S. Zhou, J. Park, B. Georgescu, J. Simopoulos, J. Otsuki, and D. Comaniciu. Image-based multiclass boosting and echocardiographic view classification. In CVPR, pages 1559–1565, 2006.