message delivery ratio while minimizing overhead both in terms of extra traffic ..... the solution is that there must exist a means of digitally signing data as well as ...
Encounter–Based Routing in DTNs Samuel C. Nelson, Mehedi Bakht, and Robin Kravets Department of Computer Science University of Illinois at Urbana-Champaign {snelso20,mbakht2,rhk}@cs.uiuc.edu Abstract—Current work in routing protocols for delay and disruption tolerant networks leverage epidemic-style algorithms that trade off injecting many copies of messages into the network for increased probability of message delivery. However, such techniques can cause a large amount of contention in the network, increase overall delays, and drain each mobile node’s limited battery supply. We present a new DTN routing algorithm, called Encounter-Based Routing (EBR), which maximizes delivery ratios while minimizing overhead and delay. Furthermore, we present a means of securing EBR against black hole denialof-service attacks. EBR achieves up to a 40% improvement in message delivery over the current state-of-the-art, as well as achieving up to a 145% increase in goodput. Also, we further show how EBR outperforms other protocols by introduce three new composite metrics that better characterize DTN routing performance.
I. I NTRODUCTION Delay and disruption tolerant networks (DTNs) transport application data by creating a “store and forward” network where no infrastructure exists. Although end-to-end connectivity may not be available between two nodes, DTN routing protocols instead take advantage of temporal paths created in the network as nodes encounter their neighbors and exchange messages they have been asked to forward. Since there are no guarantees that a route will ever be available, many current DTN routing protocols apply epidemic-style techniques [19], leveraging the fact that an increased number of copies of a particular message in the network should improve the probability that the message will reach its intended destination. However, such techniques come at a high price in terms of network resources, resulting in the rapid deletion of buffer space and energy on resourcelimited devices, the rapid depletion of available bandwidth, and the potential to greatly increase end-to-end delay. A number of routing protocols have been proposed to enable data delivery in such challenging environments [2], [4], [7], [11], [14], [17], [18], [20], [21], [6], [5]. However, many of these protocols trade overhead and computational complexity for increased successful delivery. This overhead expresses itself as more traffic in the network creating more contention in clusters of high connectivity and increased energy consumption for nodes exchanging messages. Furthermore, many DTN protocols make routing and forwarding decisions based on advertised contact information, allowing for denial-of-service attacks over the already intermittently connected network. All of these effects can decrease overall network performance. One method to mitigate this overhead is to identify key properties in the network that allow for more intelligent forwarding and message replication decisions. For example, in environments targeted by DTNs, such as disaster scenarios
and certain vehicular networks, different classes of nodes naturally tend to have more node encounters than others. The main contribution of our research capitalizes on this network property to design a DTN routing protocol that uses local observations about a node’s environment. Our protocol, Encounter-Based Routing (EBR), uses an encounter-based metric for optimization of message passing that maximizes message delivery ratio while minimizing overhead both in terms of extra traffic injected into the network and control overhead, as well as minimizing latency as a second order metric. Furthermore, we present a security component to our protocol that protects against denial-of-service attacks aimed at eliminating copies of messages in the system. To fully evaluate EBR, we propose the use of three composite metrics, which clearly illustrate the interplay between fundamental metrics like message delivery ratio, goodput, and end-to-end delay. We then use these metrics to evaluate EBR and compare it to the major protocols developed for DTNs, showing improved performance and overhead. EBR achieves up to a 40% improvement in message delivery over the current state-of-theart, as well as achieving up to a 145% increase in goodput. The rest of this paper is as follows. Section II presents a taxonomy of current DTN routing protocols. Section III presents our Encounter-Based Routing protocol EBR. Section IV shows how to secure EBR against black hole denial-of-service attacks. Section V describes our evaluation methodology and presents results. Finally, Section VI presents conclusions and future research directions. II. DTN ROUTING P ROTOCOL TAXONOMY DTN routing protocols can be classified as either forwarding-based or replication-based. Forwarding-based protocols keep one copy of a message in the network and attempt to forward that copy toward the destination at each encounter. In contrast, replication-based protocols insert multiple copies, or replicas, of a message into the network to increase the probability of message delivery. Essentially, replicationbased protocols leverage a trade-off between resource usage (e.g., node memory and bandwidth) and probability of message delivery. Although all replication-based protocols take advantage of this trade-off, these protocols can be further separated into two classes based on the number of replicas created: quota-based and flooding-based. Flooding-based protocols send a replica of each message to as many nodes as possible, whereas quota-based protocols intentionally limit the number of replicas. Assume that mt indicates the maximum number of unique messages (excluding
2
replicas) that have been created prior to some time t. Then, an upper bound on the total number of messages (including replicas) in the network at time t is mt · L, where L is the maximum number of replicas for any given message. L can be a probabilistic or discrete variable. Given these definitions, a quota-based routing protocol can be defined as follows: A replication-based routing protocol is quota-based if and only if L is independent of the number of nodes in the network (assuming the characteristics of the network, such as storage, bandwidth, and mobility, allow for every node to have a replica of every message). Conversely, any replication-based protocol where L is dependent on the number of nodes in the network is defined to be flooding-based. These definitions allow us to classify routing protocols into three groups. Traditional Internet routing protocols (e.g., IP [15]) and ad hoc routing protocols (e.g., AODV [13], DSR [10]) are forwarding-based, since nodes along a route forward messages toward the destination without storing or creating extra replicas of the messages. Forwarding-based approaches for DTNs have been proposed [8], [16], but are limited in their effectiveness due the instability or even nonexistence of routes from any particular node to the destination. One forwarding-based approach, proposed by Jain et al. [9], utilizes future knowledge about node mobility and specific node encounters to improve the protocol (e.g., knowledge that a node will encounter a bus at noon that will have access to the Internet). However, the availability of such future knowledge constitutes a special class of DTN networks and such approaches will not work in general. Epidemic routing is an obvious example of a flooding-based protocol, since the number of replicas in the system is directly dependent on the number of nodes in the system. One of the major flooding-based protocols for DTNs is MaxProp [4]. MaxProp is flooding-based, since, if resources and mobility allow, it is possible for every node in the network to have a replica of the same message. Other examples of floodingbased DTN protocols include Prophet [11], RAPID [2] and PREP [14]. Prophet attempts to use information about the likelihood of nodes encountering particular destinations to optimize the exchange of messages. RAPID orders messages through the use of utility functions, with the goal of intentionally maximizing specific metrics (e.g., delay). PREP, a variant of Epidemic Routing, assigns priority to messages based on costs to destination, source and expiration time, and uses this priority to determine which messages should be deleted or transmitted when buffer or bandwidth is constrained respectively. In an attempt to mitigate the inherent resource burden from flooding-based protocols, many of these protocols specify complex optimizations, making implementation harder and error-prone, that are tuned and tweaked for performance in different environments. Recent work by Erramilli et. al recognizes similar problems with current DTN routing protocols and proposes techniques to utilize properties of nodes, such as contact rate, when making forwarding decisions [6], [5]. They are concerned with
choosing the best node(s) to forward messages to based on utility values. This technique, however, can result in floodinglike behavior if many encountered nodes have high utility values. On the other hand, if many encountered nodes have low utility value, messages may never leave the source nodes. The main problem with flooding-based protocols is their high demand on network resources, such as storage and bandwidth. This led to work in developing quota-based protocols. Spray and Wait [17] is a quota-based protocol where an upper bound on the number of replicas allowed in the network is fixed during message creation. Spray and Wait breaks routing into two phases: a spray phase, where message replicas are disseminated, and a wait phase, where nodes with single-copy messages wait until a direct encounter with the respective destinations. A follow-up protocol called Spray and Focus [18] uses a similar spray phase, followed by a focus phase, where single copies can be forwarded to help maximize a utility function. While both Spray and Wait and Spray and Focus succeed in limiting some of the overhead of flooding-based protocols, their delivery ratios suffer. While quota-based protocols are much better stewards of network resources than their flooding-based counterparts, one possible criticism is their inability to successfully deliver a comparable amount of messages. In this paper, we show this to be false by developing a quota-based protocol using an encounter-based routing metric that has extremely low routing overhead, while maintaining delivery ratios better than or comparable to current flooding-based protocols. III. E NCOUNTER - BASED ROUTING (EBR) The primary goal of a DTN routing protocol is to obtain high message delivery ratio and good latency performance, while maintaining low overhead. However, current floodingbased protocols (e.g., MaxProp [4], RAPID [2]) achieve high delivery ratios at the expense of excessive network resource usage, and current quota-based protocols ((e.g., Spray And Wait [17], Spray and Focus [18]) that reduce this overhead are not able to achieve comparable delivery rates. In response, we present Encounter-based Routing (EBR), a quota-based DTN routing protocol that achieves high delivery ratios comparable to flooding-based protocols, while maintaining low network overhead. This improvement in delivery ratio is accomplished by taking advantage of the following observed mobility property of certain networks: the future rate of node encounters can be roughly predicted by past data. This property is useful because nodes that experience a large number of encounters are more likely to successfully pass the message along to the final destination than those nodes who only infrequently encounter others. Many networks experience this phenomenon; examples include disaster recovery networks, where ambulances and police tend to be more mobile and bridge more cluster gaps than civilians, and vehicular-based networks, where certain vehicles take popular routes. Since EBR is a quota-based routing protocol, it limits the number of replicas of any message in the system, minimizing network resource usage. Additionally, EBR bases routing
3
decisions on nodes’ rates of encounters, showing preference to message exchanges with nodes that have high encounter rates. These routing decisions result in higher probability of message delivery, avoiding routes that may never result in delivery and so reducing the total number of message exchanges. In EBR, information about a node’s rate of encounter is a purely local metric and can be tracked using a small number of variables. Therefore, EBR is able to maintain very low state overhead, as compared to other protocols that can require up to O(n) routing messages exchanged during every contact connection, and O(n2 ) routing state locally stored (e.g., MaxProp [4], Prophet [11]). A further strength of EBR is that its message replication rules are simple to understand and implement, as opposed to complex rules found in many protocols, minimizing the chance of bugs and reducing computational complexity (e.g., the resources in terms of CPU cycles required to operate the protocol). A. Algorithm Every node running EBR is responsible for maintaining their past rate of encounter average, which is used to predict future encounter rates. When two nodes meet, the relative ratio of their respective rates of encounter determines the appropriate fraction of message replicas the nodes should exchange. The primary purpose of tracking the rate of encounter is to intelligently decide how many replicas of a message a node should transfer during a contact opportunity. To track a node’s rate of encounter, it maintains two pieces of local information: an encounter value (EV), and a current window counter (CWC). EV represents the node’s past rate of encounters as an exponentially weighted moving average, while CWC is used to obtain information about the number of encounters in the current time interval. EV is periodically updated to account for the most recent CWC in which rate of encounter information was obtained. Updates to EV are computed as follows: EV ← α · CW C + (1 − α) · EV. This exponentially weighted moving average places an emphasis proportional to α on the most recent complete CWC. Updating CWC is straightforward: for every encounter, the CWC is incremented. When the current window update interval has expired, the encounter value is updated and the CWC is reset to zero. In our experiments, we found an α of 0.85 and update interval of around 30 seconds allow for reasonable results in a variety of networks. These parameter choices are further elaborated upon in Section V. Since EV represents a prediction of the future rate of encounters for each node per time interval, the node with the highest EV represents a higher probability of successful message delivery. Therefore, when two nodes meet, they compare their EVs. The number of replicas of a message transferred during a contact opportunity is proportional to the ratio of the EVs of the nodes. For two nodes A and B, for
every message Mi , node A sends EVB mi · EVA + EVB replicas of Mi , where mi is the total number of Mi replicas stored at node A. For example, assume node A has 4 replicas of a message M1 and 8 replicas of a message M2 . Furthermore, assume node A, with EVA = 5, comes in contact 15 = 34 of with node B, with EVB = 15. Node A sends 5+15 the replicas of each message. Therefore, node A transmits 3 replicas of message M1 and 6 replicas of message M2 . Algorithm 1 presents the basic form of EBR, where Wi represents the current window update interval parameter. Algorithm 1 EBRRouting if time ≥ nextU pdate then EV ← α · CW C + (1 − α) · EV CW C ← 0 nextU pdate ← time + Wi end if if Contact C available then for All messages Mi in local buffer do mi ← Mi .numOf Replicas c ⌋ msend ← ⌊mi · EVEV c +EV Send msend replicas of Mi to node C end for end if
B. Generalizing EBR In this section, we prove that EBR adheres to the definition of a quota-based protocol (as described in Section II) and show the relevant bounds, both for the simple version, where L, the maximum number of replicas of a message, is discrete, and for a more general version, allowing the use of probabilistic L values. For discrete L values, it is easy to show that EBR is quotabased. Along with its data, every message contains a value indicating the maximum number of replicas into which this current message is allowed to be split. As an example, assume an application at node A creates a message with the maximum allowable replicas set to 10. Assume node A encounters node B and, based on the EBR protocol described in Section III-A, wishes to transmit 8 replicas. Then, A creates a copy of the message for node B and assigns B’s maximum allowable replicas to 8. Furthermore, A resets its maximum allowable replicas to 2. Continuing this procedure in a recursive fashion maintains the bound set by the initial message. However, L values are not limited to a discrete maximum number of replicas. The discrete structure can easily be relaxed into a probabilistic structure, while maintaining meaningful (yet probabilistic) bounds. Probabilistic L values can allow for less sensitivity to exact network conditions. When using discrete L values, changes to the initial number of message replicas allows for a fundamental tradeoff between MDR, goodput, and average latency (see Section V). Using probabilistic L values and increasing or decreasing variance and mean can allow applications to compromise and not require exact decisions about the number of allowable replicas.
4
While any distribution may be used in this probabilistic model, the Gaussian distribution allows for immediate, eloquent properties that help establish the bound on the number of messages in the network. In this case, the application specifies the mean and variance of the distribution, instead of a discrete number. Assume a node A wishes to split the message M into two replicas, MA and MB . Node A must follow the following EBR message splitting rule: If M ∼ N (µ, σ 2 ), then it can only be split into MA ∼ 2 2 N (µA , σA ) and MB ∼ N (µB , σB ) such that µ = µA + µB 2 2 2 and σ = σA + σB . For example, a message with mean 10 and variance 5 may be split into two messages, one with mean 8 and variance 4, and one with mean 2 and variance 1. It may not, however, be split into a message of mean 8 and variance 4, and one with mean 7 and variance 1. As a further note, EBR maintains the ratio of mean to variance for all message splits. This message splitting rule preserves the Gaussian distribution for the two newly created replicas. This is due to a result from statistics known as Cramer’s Theorem: 2 2 • If X + Y ∼ N (µx + µy , σx + σy ), 2 then X ∼ N (µx , σx ) and Y ∼ N (µy , σy2 ). We now demonstrate that this general version of EBR is a quota-based replication protocol, and establish an upper bound, by proving the following theorem: Theorem 3.1: Let S be a schedule of future message creations. Let t be an arbitrary future time. Assume M1 , M2 , ..., Mi ∈ S are all the messages created before time t. Assume each message Mi has a Gaussian random variable (for notational ease, we refer to this directly as the message Mi ), with mean µi and variance σi2 , that represents the maximum number of replicas the current message is allowed to be split into. The upper bound on the maximum number of message replicas in the system is: i i X X σj2 . U ∼N µj , j=1
j=1
Proof: Let U be the sum of all message replicas in the system. Assuming messages never split, there will be i messages in the system, each with mean µi and variance σi2 . We utilize the following rule of linearity for Gaussian distributions (the converse of Cramer’s Theorem): 2 2 • If X ∼ N (µx , σx ) and Y ∼ N (µy , σy ), then X + Y ∼ 2 2 N (µx + µy , σx + σy ). Therefore, i i i X X X σj2 . Mi ∼ N µj , U= j=1
j=1
j=1
Now assume a message, Mj ∼ N (µj , σj2 ) is split into 2 2 ) such that ) and Mj2 ∼ N (µj2 , σj2 Mj1 ∼ N (µj1 , σj1 2 2 µj = µj1 + µj2 and σj2 = σj1 + σj2 (the message splitting rule of EBR). Then by the same linearity rules, Mj = Mj1 + Mj2 , leaving U unchanged.
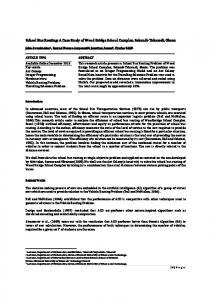
One minor issue to address is that the statistical rules and theorems each assume true Gaussian distributions. However, it does not make sense in our system for a message M to hold a negative value. The probability of this occurring can be made sufficiently small by forcing the application to choose sufficiently low variances for corresponding means (which can never be below zero). IV. S ECURING EBR The decision regarding how many replicas of a messages a node should transmit to a contact depends completely upon the ratio of both parties’ encounter values. Therefore, a malicious node can convince a node following protocol to transmit virtually any percentage of replicas to it. One of the most worrisome results is the possibility of a denial-ofservice (DoS) attack where malicious nodes act as “black holes”. Malicious nodes performing this attack advertise an ultra-high encounter value, causing all contacts to send almost all replicas to them. The malicious nodes then simply delete these messages, attempting to stop, or at least slow, message delivery. Work by Burgess et. al shows that two popular types of denial-of-service attacks, dropping all messages (which we refer to as black hole denial-of-service) and flooding the network with fake messages, result in similar network degradation [3]. This degradation does not cripple the network because malicious nodes suffer from the same level of intermittent connectivity as non-malicious nodes. In this paper, we have chosen to consider the case of black hole DoS attacks. This is because EBR is a low-overhead quota-based protocol, and hence extra flooding is not as big a concern as black holes. In quota-based protocols, non-malicious nodes do not flood messages, real or fake, and should simply drop messages with a high number of copies, as they are malicious. To determine how vulnerable EBR is to black hole DoS attacks, we perform a series of simulations where a certain percentage of the nodes are malicious. Malicious nodes always advertise an exceptionally high encounter value, and immediately delete any message replicas obtained. Each data point is the average of 10 runs, and small 95% confidence intervals are shown. A vehicular mobility model is used, which is explained, along with simulation parameters, further in Section V. The results of this experiment, shown in Figure 1, indicate that network performance can be hindered with a relatively small number of malicious nodes. However, matching the work done by Burgess et. al, additional malicious nodes are not able to cripple the network. These results indicate that it is necessary to provide an optional solution that prevents DoS attacks. Users not minding the decrease in performance may choose not to implement this solution. However, providing a solution is necessary for those users more concerned about maximizing network performance. The penalty for choosing the solution is that there must exist a means of digitally signing data as well as binding keys to indentities, such as PKI. The insight of the solution comes from the observation that an encounter value can never be altered unless an external
5
Message Delivery Ratio
1 0.8 0.6 0.4 0.2 0 0
Fig. 1.
0.1 0.2 0.3 0.4 Percentage of Malicious Nodes
0.5
MDR in Attack Scenarios
must be trusted by all nodes in the network since previous transaction data is deleted after a signed encounter value is obtained (e.g., a node is checkpointed by a checkpointing node). It is possible for colluding nodes to artificially inflate each other’s encounter values by signing multiple “fake” meeting messages. This is a difficult problem, and we have not discovered a clear-cut solution. However, using statistical techniques, nodes diligent in looking for abnormal contact rates can mitigate the damage, If a node legitimently meets another node or group of nodes very frequently, it can lessen its chances of raising a false red flag by simply not storing some of the meetings, and not updated its encounter value for those meetings. A more thorough investigation of this is future work. V. E VALUATION
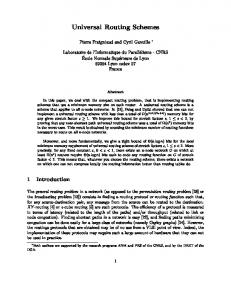
Fig. 2.
Timestamp Protocol
event (e.g., coming in contact with another node) occurs. Therefore, proving that the encounter value was altered only during an external event assures other nodes that the node in question is not individually faking the value. Now, of course, nodes can still collude to artificially inflate their encounter values; this case will be considered shortly. Note that the goal is to prevent the artificial increase, not decrease, of encounter values. The protocol works as follows. Assume node A comes in contact with node C, and node C wishes to send data to node A. The goal is for node A to offer acceptable evidence to node C that the encounter value is not forged. To give acceptable evidence for this, node A must keep a list of transactions in which all previously encounter nodes digitally sign a time stamped message stating that “node A met me at time T”. A graphical illustration of this is given in Figure 2. Node A can then offer all of these messages to node C, and allow node C to recompute node A’s encounter value from scratch. If the recomputed value is equal to the value provided by node A, then node C can confidently transmit replicas to node A. It is possible, even probable, that inherently trustworthy nodes are present in the network. For instance, in disaster recovery networks, police and emergency responders can be considered highly trustworthy entities. These nodes can be utilized to sign, or checkpoint, actual encounter values. This checkpointing process allows a node to delete all previous transactions and simply start with the new, signed encounter value. Checkpointing nodes verify the encounter value in the same fashion as mentioned above and then provide a signed encounter value back to the node. Checkpointing nodes
The primary goal of our evaluation is to show that EBR achieves a high message delivery ratio and good latency, while maintaining extremely low overhead. To demonstrate this, we first present the metrics used in our evaluation, followed by a brief description of the mobility models. Finally, we present a comprehensive evaluation of EBR in comparison to five other popular DTN routing protocols. To perform our evaluation, we use the Opportunistic Network Environment simulator (ONE) [1], which is a simulation environment designed specifically for disruption tolerant networks. A. Metrics Although traditional evaluation metrics provide a good understanding of the performance of a network, the evaluation of many current DTN routing protocols is hindered by the limited, and sometimes misleading, metrics used. To give a clearer, more complete picture of the evaluation, we consider three traditional performance metrics as well as introduce three composite metrics. Traditional performance metrics include average message delivery ratio and end-to-end message latency, while resource usage, or resource friendliness can be captured by goodput. Goodput is defined as the number of messages delivered divided by the total number of messages transferred (including those transfers that did not result in a delivery). In a resource constrained network, effective use of available storage can be captured by the number of messages dropped due to buffer overflows. We evaluated this metric in all of our scenarios; however, since it closely correlates to goodput, those results were omitted due to space constraints. While these three traditional metrics provide a comprehensive view of the communication in DTNs, many protocols trade off effectiveness in one metric for effectiveness in another. Composite metrics are able to penalize protocols for performing poorly in individual primary metrics, giving a more complete picture of protocol performance. We consider three composite metrics to illustrate the relative relationship between the primary metrics. The MDR x Average Delay metric takes MDR and penalizes it for having a poor end-to-end delay,
550 500
0.8 0.7 0.6 0.5 0.4 0.3 0.2
450 400 350 300 250 200 150
50
100 150 200 Number of Nodes
Fig. 3.
250
300
0
100 150 200 Number of Nodes
250
0.14
0.0035
0.12
MDR x Goodput
0.16
0.004 0.003 0.0025 0.002 0.0015 0.001
300
0.1 0.08 0.06 0.04 0.02
0.0005
0 0
50
0.18 0.16 0.14 0.12 0.1 0.08 0.06 0.04 0.02 0 0
50
100 150 200 Number of Nodes
250
300
100 150 200 250 Number of Nodes
300
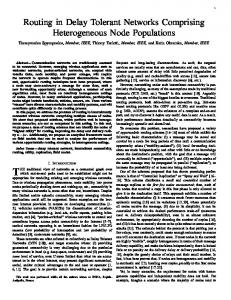
Vehicular: Varying number of nodes (a) MDR, (b) Average Delay, (c) Goodput
0.0045
Fig. 4.
50
100 150 200 Number of Nodes
250
300
0
50
100 150 200 Number of Nodes
250
300
MDR x (1 / Average Delay) x Goodput
0
MDR x (1 / Average Delay)
Epidemic EBR Prophet Spray and Wait Spray and Focus
Goodput
1 0.9
Average Delay (seconds)
Message Delivery Ratio
6
0.0005 0.00045 0.0004 0.00035 0.0003 0.00025 0.0002 0.00015 0.0001 5e-05 0 0
50
Vehicular: Varying number of nodes (a) MDR x Average Delay (b) MDR x Goodput, (c) MDR x Goodput x Average Delay
allowing for a more complete picture. Similarly, the MDR x Goodput metric looks at MDR and penalizes it for having poor goodput, giving a view of the network stewardship along with traditional MDR. Finally, the MDR x Average Delay x Goodput metric looks at MDR and penalizes it both for poor average delay and poor goodput. It is important to note that the absolute value of composite metrics is more or less meaningless by itself, since the metrics are artificial in nature. Therefore, when comparing protocols using composite metrics, one should consider the protocols’ relative performance to one another. Further note that to maintain the standard of “higher is better”, average delay is always inverted when used in composite metrics. B. Mobility Models Since DTNs can operate in many different environments, we use three different mobility models in our evaluation, specifically chosen to encompass a wide variety of DTN environments: a map-driven model simulating a vehicular network, an event-driven model simulating a disaster scenario [12], and a traditional random waypoint (RWP) model. The vehicular-based map-driven model, which is part of the ONE simulator, limits node movement to actual streets found on an imported map, an approximate 5 km x 3 km section of downtown Helsinki, Finland. Approximately 15% of the nodes were configured to follow pre-defined routes (like tram lines) with speed between 7 and 10 m/s, the default for trams in the ONE simulator. The rest of the nodes were divided into four groups of nodes and four groups of “points-of-interest” (POI). Each node group was assigned different probabilities of picking the next node from a particular group of POIs to simulate the phenomenon that people often visit certain areas of a city more frequently than others based on their profession,
age and other factors. The speed of these nodes varied between 2.7 and 13.9 m/s, the default for car simulation in ONE. The role-based, event-driven disaster mobility model [12] captures distinct movement patterns of roles as they react to external events. For this model, we simulate four equally spaced disaster events and a hospital. 50% of the nodes are civilians that flee from the events, 25% are ambulances that oscillate to and from events and a centrally located hospital, and 25% are police personnel who at first gravitate towards an event, but then react by “patrolling” the area in a random walk fashion. Police and ambulances always travel between 17 and 20 m/s, unless stopped. Civilians always travel between 1 and 4 m/s, unless stopped. Finally, we simulate the routing protocols with a traditional random waypoint model. For this simulation, nodes are relatively slow moving, since the disaster scenario and vehicular models are relatively fast moving. Nodes move between 0.5 and 1.5 m/s, and pause at destinations for some time between 0 and 120 seconds. For the disaster and random waypoint mobility models, the simulation area is 3 km by 3 km. For all simulations, the transmission range of each node is 250 m. C. Performance Results To demonstrate the effectiveness of EBR, we perform two groups of simulations on each of the three mobility models. To illustrate how each of the protocols reacts to changes in node density, we vary the number of nodes in the network starting at 26, followed by 51 to 251 in increments of 50, while keeping the area constant. The extra node represents a hospital in the middle of simulation area for the purpose of the disaster scenario mobility model. To illustrate how each protocol reacts to varying network loads, we vary the per-
800 Average Delay (seconds)
0.7 0.6 0.5 0.4 0.3 0.2 0.1
600 500 400 300 200 100
0
50
Fig. 5.
100 150 200 Number of Nodes
250
300
0
Average Delay (seconds)
0.3 0.25 0.2 0.15 0.1 0
50
Fig. 6.
50
100 150 200 Number of Nodes
250
300
0.00018 0.00016 0.00014 0.00012 0.0001 8e-05 6e-05 4e-05 2e-05 0 0
50
100 150 200 250 Number of Nodes
300
Disaster: Varying number of nodes (a) MDR, (b) Average Delay, (c) MDR x Average Delay x Goodput
0.35 Message Delivery Ratio
Spray and Wait Spray and Focus EBR Epidemic Prophet MaxProp
700
100 150 200 Number of Nodes
250
300
1200 1100 1000 900 800 700 600 500 400 300 200 100
EBR Epidemic Prophet Spray and Wait Spray and Focus MaxProp
0
50
100 150 200 Number of Nodes
250
300
MDR x (1 / Average Delay) x Goodput
Message Delivery Ratio
0.8
MDR x (1 / Average Delay) x Goodput
7
4e-05 3.5e-05 3e-05 2.5e-05 2e-05 1.5e-05 1e-05 5e-06 0 0
50
100 150 200 250 Number of Nodes
300
RWP: Varying number of nodes (a) MDR, (b) Average Delay, (c) MDR x Average Delay x Goodput
node offered load by adjusting the number of messages sent per minute per source from 1 (lower load), to 2 (medium load), to 4 (higher low). Following this comparative evaluation, we evaluate how EBR reacts to changes in two local parameters: the popularity counter weighting constant (α) and the number of initial replicas per message. In all simulations, we keep the area constant, the packet size constant at 25 KB, and the buffer space constant at 1 MB. Each simulation lasts for one simulated hour. Unless otherwise noted, each data point is the average of at least 10 runs, with 95% confidence intervals displayed. Due to the large amount of time required to simulate MaxProp in ONE, it was only evaluated fully for 26, 51, and 101 nodes, and is the average of four runs for 151 nodes, and is not evaluated for higher numbers of nodes. MaxProp is omitted from the evaluation using the vehicular mobility model due to the large amount of time required to simulate it. 1) Comparative Results: We evaluate EBR against five other popular protocols: (1) basic epidemic [19], (2) Prophet [11], (3) Spray and Wait [17], (4) Spray and Focus [18], and (5) MaxProp [4]. To enable a comparison between EBR and Spray and Focus, we implemented Spray and Focus to use an EBR-style encounter value (EV) to optimize delivery ratios in the focus phase. When nodes running Spray and Focus are in the focus phase, they hand-off single-copy messages to nodes with a higher EV. First, we present the results from the vehicular mobility model. Note that MaxProp is not included in this set of simulations due to the large amount of time necessary to simulate it on the ONE simulator. EBR performs extremely well in terms of MDR, compared to the other quota-based protocols, Spray and Wait and Spray and Focus (see Figure 3(a)). Two factors account for this. First, the mobility model fits perfectly into the
assumptions of EBR, namely that past information on rate-ofencounters is a good estimator for future rate-of-encounters. Second, the network utilization seems to be correlated to MDR in this scenario, most likely due to constrained buffer space. EBR is, by far, the most resource friendly, as shown by the goodput metric (see Figure 3(c)). While EBR seems to have unfavorable delay, this is, in part, due to a high MDR (see Figure 3(b)). Since delay is computed only over messages that have been delivered, it is deceptive to view delay alone since many protocols quickly deliver messages that take a small number of hops, and do not deliver most high-hop messages. The composite metrics, showing a more complete picture, further illustrate the power of EBR. Second, we present the results from the disaster mobility model. Due to space, we do not present all metrics. As expected, in terms of MDR, MaxProp performs the best (see Figure 5(a)), due to its aggressive use of network resources. Closely following is EBR, which is never greater than 9 percentage points away from MaxProp. This is significant since EBR is much less demanding on network resources, yet can achieve a comparable MDR. Spray and Wait, which performs closest to EBR in terms of goodput (yet still significantly worse), performs noticeably worse in MDR. The reason EBR performs much better than Spray and Wait is due to the rolebased characteristics of the disaster scenario mobility model. Both ambulances and police are highly active, more-so than civilians, and so EBR’s assumption about predicting the rate of encounters using past data holds true. Furthermore, the goodput is significantly higher using EBR because if a large number of copies reach a high-encounter node, that node will not forward many of these copies to low-encounter nodes. This helps keep the network resource usages much lower than Spray and Wait. Note that both Prophet and Epidemic collapse as
500 400 300 200 100
0
1 2 3 4 Packets per Source per Minute
Fig. 7.
5
0
1 2 3 4 Packets per Source per Minute
5
Average Delay (seconds)
700
0.3 0.25 0.2 0.15 0.1 0.05
600 500 400 300 200 100
0
1 2 3 4 Packets per Source per Minute
Fig. 8.
0.00022 0.0002 0.00018 0.00016 0.00014 0.00012 0.0001 8e-05 6e-05 4e-05 2e-05 0 0
1 2 3 4 Packets per Source per Minute
5
Disaster: Varying load (a) MDR, (b) Average Delay, (c) MDR x Average Delay x Goodput
0.35 Message Delivery Ratio
600
MDR x (1 / Average Delay) x Goodput
700
Spray and Wait Spray and Focus EBR Epidemic Prophet MaxProp
5
0
1 2 3 4 Packets per Source per Minute
5
MDR x (1 / Average Delay) x Goodput
0.65 0.6 0.55 0.5 0.45 0.4 0.35 0.3 0.25 0.2 0.15 0.1
Average Delay (seconds)
Message Delivery Ratio
8
4e-05 3.5e-05 3e-05 2.5e-05 2e-05 1.5e-05 1e-05 5e-06 0 0
1 2 3 4 Packets per Source per Minute
5
RWP: Varying load (a) MDR, (b) Average Delay, (c) MDR x Average Delay x Goodput
the number of nodes increases. In terms of latency, MaxProp performs worst, whereas Spray and Focus performs expectedly well (see Figure 5(b)). Finally, the random waypoint model is considered. In terms of MDR (see Figure 6(a)), the gap between EBR and Spray and Wait is closer than with the disaster scenario (notice the change in scale). However, as the number of nodes increases, the gap becomes larger. The sudden increase at 50 to 100 nodes is due to the density finally becoming adequate for good delivery. Past this point, there is a minor decrease in performance for EBR, Spray and Wait and Spray and Focus and a more dramatic decrease for Prophet and Epidemic. We believe the poor performance of MaxProp is due to the relatively small buffer size. In terms of latency, Spray and Focus again performs the best (see Figure 6(b)); however, EBR consistently performs better than MaxProp. As expected, goodput strongly favors EBR. Due to space, the pure goodput metric is not shown, in favor of the 3-composite metric. In the second group of simulations, the offered load is varied from 1 to 2 to 4 messages per source per minute. Due to space constraints, we only present results for the disaster mobility model and random waypoint model. Additionally, we only include the results for MDR, delay and the three-way composite metric. For the disaster scenario, MaxProp and EBR perform expectedly well, with all protocols suffering as the offered load increases (see Figure 7(a)). The average latency, however, shows MaxProp performing much worse than other metrics (see Figure 7(b)). Furthermore, as the offer load is increased from 1 to 4 messages per source per minute, EBR performs better than both Prophet and Epidemic. This is due to EBR’s sharper drop in MDR as offer load increases. Spray and Focus and Spray and Wait perform the best, as expected. When combining all primary metrics, EBR performs at a high
level, and the gap between EBR and Spray and Wait does not quickly close (see Figure 7(c)). When the offered load is varied using the RWP mobility model, the MaxProp data is averaged over three runs, with all other data averaged over ten runs. Due to the more uniform nature of per node rate of encounters, EBR does not perform as well as it does in the disaster scenario mobility model. However, in terms of MDR, it is still in the top tier, and performs higher than all others with lower offered loads (see Figure 8(a)). In terms of latency, as the offered load increases, the gaps between protocols tends to close (see Figure 8(b)). Finally, when combining all primary metrics, we notice that EBR performs at the highest level, primarily due to low overhead, and reasonable MDR and latency (see Figure 8(c)). 2) EBR Parameter Results: To determine how EBR reacts to changes in internal parameters, we evaluate EBR against itself using different parameter settings. Due to space constraints, we only present results for the disaster scenario mobility model and only vary the number of nodes in the system. To evaluate the impact of the weight of the current rate of encounter in the EV counter, we vary α from 0.5 to 0.85. Additionally, to capture the tradeoff between resource usage and delay, we vary the starting number of message copies between 5, 11, and 20. Therefore, a total of 6 lines are shown per graphs. Again due to space constraints, we only present the graphs for the primary metrics, not the composite metrics. In terms of MDR, α does not make a substantial difference. However, the number of initial copies does. As the number of nodes grows larger, EBR using only 5 copies starts to perform best, with EBR using 11 copies within a few percentage points (see Figure 9(a)). However, in terms of average delay, EBR using 5 copies performs significantly worse than with both 11 and 20 copies (see Figure 9(b)). Again, changing the value of
9
Message Delivery Ratio
0.64 0.62 0.6 0.58 0.56 0.54 0.52 0.5 20
40
60
80
100 120 140 160 180 200 220 Number of Nodes
Fig. 9.
700 650 600 550 500 450 400 350 300 250 200
0.3 0.25 Goodput
EBR(0.5,5) EBR(0.5,11) EBR(0.5,20) EBR(0.85,5) EBR(0.85,11) EBR(0.85,20)
0.66
Average Delay (seconds)
0.68
AND
0.15 0.1 0.05
20 40 60 80 100 120 140 160 180 200 220 Number of Nodes
20 40 60 80 100 120 140 160 180 200 220 Number of Nodes
Disaster: Varying number of nodes (a) MDR, (b) Average Delay, (c) Goodput
α has little effect. The goodput is significantly greater when the number of copies is small, as expected (see Figure 9(c)). In total, when not considering latency, a small number of copies, such as 5, allows for good performance of EBR. However, when latency is considered, a bit of a trade off must be made. Therefore, we have chosen to compromise and recommend a value of 11 initial copies as default to EBR. VI. C ONCLUSIONS
0.2
F UTURE D IRECTIONS
The ability to efficiently and effectively route data through intermittently connected networks is of critical importance to DTNs. Many current routing protocols utilize flooding-based techniques to obtain relatively high message delivery ratios. This, however, comes at the expense of overwhelming network resources, mainly bandwidth and storage. Resource outages then lead to reduced performance in clustered areas, due to congestion, as well as energy strain on the devices. Filling all available buffer space with message replicas can hinder an application’s ability to store local data. Additionally, overloading the network channel hinders one-hop protocols that do not rely on routing. Unfortunately, protocols that allow for low network resource utilization generally are not able to obtain comparable delivery ratios. In this paper, we show that basing routing decisions on the encounter rate of a node can increase the delivery ratio. As shown in Section V, our EncounterBased Routing protocol (EBR) provides comparable or better message delivery ratios than current flooding-based protocols, while maintaining extremely low resource utilization. There are many interesting future directions for encounterbased routing. First, we plan on evaluating EBR using probabilistic splitting rules, as described in Section III-B. More specifically, we plan to analyze the MDR, average latency, and goodput tradeoffs when the variance of the number of replicas is increased for all nodes, as well as when the variance is nonuniform for all nodes. Following this, we plan on exploring, both mathematically and experimentally, distributions other than Gaussian. A second future direction is exploring the effects of using a second order derivative in terms of number of encounters. Currently, EBR only considers the current rate of encounters and averages this rate using an exponentially weighted average to account for both older and newer data. If EBR used a second order derivative, it would consider the change in rate of encounters over time and this trend could be used to distribute an appropriate number of message replicas.
R EFERENCES [1] ONE simulator. http://www.netlab.tkk.fi/tutkimus/dtn/theone/. [2] Aruna Balasubramanian, Brian Neil Levine, and Arun Venkataramani. DTN routing as a resource allocation problem. In Proc. ACM SIGCOMM, August 2007. [3] John Burgess, George Bissias, Mark D. Corner, and Brian Neil Levine. Surviving attacks on disruption-tolerant networks without authentication. In MobiHoc 07, 2007. [4] John Burgess, Brian Gallagher, David Jensen, and Brian Neil Levine. MaxProp: Routing for vehicle-based disruption-tolerant networks. In Proc. IEEE INFOCOM, April 2006. [5] Vijay Erramilli and Mark Crovella. Forwarding in opportunistic networks with resource constraints. In Proceedings of the Fourth ACM Workshop on Challenged Networks (CHANTS 08), 2008. [6] Vijay Erramilli, Mark Crovella, Augustin Chaintreau, and Christophe Diot. Delegation forwarding. In MobiHoc, 2008. [7] Stephen Farrell, Vinny Cahill, Dermot Geraghty, Ivor Humphreys, and Paul McDonald. When tcp breaks: Delay- and disruption- tolerant networking. IEEE Internet Computing, 10(4):72–78, 2006. [8] Dan Henriksson, Tarek F. Abdelzaher, and Raghu K. Ganti. A cachingbased approach to routing in delay-tolerant networks. In ICCCN, 2007. [9] Sushant Jain, Kevin Fall, and Rabin Patra. Routing in a delay tolerant network. In Proc. ACM SIGCOMM, 2004. [10] D. B. Johnson and D. A. Maltz. Mobile Computing, chapter Dynamic source routing in ad hoc wireless networks, pages 153–181. Kluwer Academic Publishers, February 1996. [11] A. Lindgren, A. Doria, and O. Scheln. Probabilistic routing in intermittently connected networks. In MobiHoc 03, 2003. [12] Samuel C. Nelson, Albert F. Harris, and Robin Kravets. Event-driven, role-based mobility in disaster recovery networks. In CHANTS, 2007. [13] C. E. Perkins and E. M. Royer. Ad-hoc on-demand distance vector routing. In The Second IEEE Workshop on Mobile Computing Systems and Applications, February 1999. [14] Ram Ramanathan, Richard Hansen, Prithwish Basu, Regina RosalesHain, and Rajesh Krishnan. Prioritized epidemic routing for opportunistic networks. In MobiOpp 07, 2007. [15] IEEE Computer Society. Internet protocol, rfc 791, September 1981. [16] T. Spyropoulos, K. Psounis, and C.S. Raghavendra. Single-copy routing in intermittently connected mobile networks. In (IEEE SECON), 2004. [17] Thrasyvoulos Spyropoulos, Konstantinos Psounis, and Cauligi S. Raghavendra. Spray and wait: An efficient routing scheme for intermittently connected mobile networks. In WDTN ’05: Proceeding of the 2005 ACM SIGCOMM workshop on Delay-tolerant networking, 2005. [18] Thrasyvoulos Spyropoulos, Konstantinos Psounis, and Cauligi S. Raghavendra. Spray and focus: Efficient mobility-assisted routing for heterogeneous and correlated mobility. In Fifth Annual IEEE International Conference on Pervasive Computing and Communications Workshops, 2007. [19] Amin Vahdat and David Becker. Epidemic routing for partially connected ad hoc networks. Technical Report CS-2000-06, Department of Computer Science, Duke University, apr 2000. [20] Brenton D. Walker, Joel K. Glenn, and T. Charles Clancy. Analysis of simple counting protocols for delay-tolerant networks. In CHANTS, pages 19–26, New York, NY, USA, 2007. ACM. [21] Zhensheng Zhang. Routing in intermittently connected mobile ad hoc networks and delay tolerant networks: overview and challenges. Communications Surveys & Tutorials, IEEE, 8(1):24–37, 2006.