Eurographics/ IEEE-VGTC Symposium on Visualization (2006) Thomas Ertl, Ken Joy, and Beatriz Santos (Editors)
Enhancing Slice-based Visualizations of Medical Volume Data Christian Tietjen1
Björn Meyer1
Stefan Schlechtweg1
1 Department of Simulation and Graphics Otto-von-Guericke University of Magdeburg, Germany {tietjen|stefans|preim}@isg.cs.uni-magdeburg.de
[email protected]
3
Bernhard Preim1
Ilka Hertel2,3
Gero Strauß2,3
2 ENT Department Innovation Center for Computer Assisted Surgery (ICCAS) University Hospital of Leipzig, Germany {Ilka.Hertel|strg}@medizin.uni-leipzig.de
Abstract Slice-based visualizations of CT and MRI data are frequently used for diagnosis, intervention planning and intraoperative navigation since they allow a precise analysis and localization. We present new techniques to enhance the visualization of cross sectional medical image data. Our work is focussed on intervention planning and intraoperative navigation. We address the following problems of slice-based visualization in these areas: the lack of a graphical overview on the positions of anatomic structures, the localization of a target structure and the display of safety zones around pathologic structures. To improve the overview, we introduce L IFT C HARTs, attached as vertical bars to a slice-based visualization. For localizing target structures, we introduce halos. These techniques restrict the occlusion of the original data to a minimum and avoid any modification of the original data. To demonstrate the usability of these visualization techniques, we show two application scenarios in which the techniques come into operation. Categories and Subject Descriptors (according to ACM CCS): I.3.3 [Computer Graphics]: Picture/Image Generation—Display algorithms; J.3 [Life And Medical Sciences]: Medical information systems
1. Introduction For the diagnosis of severe diseases, intervention planning and intraoperative monitoring, magnetic resonance imaging (MRI) or computer tomography (CT) data are acquired, such as cross sectional image data. Those modalities produce a set of slice images, which can be employed for 3D visualizations as well as for 2D slice-based visualizations. 3D visualizations provide an overview of the spatial relations which is appreciated for the diagnosis of complex pathologies as well as for many planning tasks. Slice-based visualizations, on the other hand, support a detailed analysis of the data and still represent the dominant mode of viewing CT and MRI data. For intervention planning and diagnosis, slice-based visualizations are always taken into account. Also, in anatomy education, cross sectional anatomy is an important aspect and deserves special attention. The Voxel-Man and the 3D Slicer for example, provide cross sectional images integrated in 3D visualizations [HPP∗ 01, GKG∗ 99]. Although slice-based visualizations are of paramount importance, in the visualization community research is focused almost exclusively on 3D visualization aspects, such as effi© The Eurographics Association 2006.
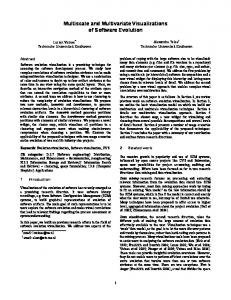
cient and high-quality volume rendering, support for transfer function specification as well as efficient isosurface rendering. In this paper, we focus on slice-based visualizations and describe how these can be enhanced using segmentation information resulting from preoperative planning. Conventional slice-based visualizations do not provide an overview of relevant structures. As an example, when viewing the current slice it is not clear whether pathologies are above or below the current section and how many slices are in between. We present techniques to display distances to structures at risk, such as major blood vessels, simplify the localization of a target structure and target location. Moreover, we introduce an overview to a slice-based viewer. The original data is not modified and the occlusion by additional information is minimized. We consider applications for intervention planning as well as intraoperative navigation, where the relevant structures are segmented preoperatively [KTH∗ 05]. In medical textbooks illustrative slice-based visualizations are common (Figure 1). In clinical applications, however, the unaltered data have to be displayed. Instead, the data may be enriched with additional information.
Tietjen et al. / Enhancing Slice-based Visualizations of Medical Volume Data
3. Concept In this section, we introduce our concepts regarding three major problems of the exploration within slice-based visualization. In the following, we shall present conceptual solutions for those problems:
Figure 1: Illustrative cross sectional images convey different strategies for the needle placement in the spine. From: [GP98]
The remainder of this paper is organized as follows. Section 2 describes related work. Afterwards, we discuss the concept, driven by specific problems in computer-assisted surgery in Section 3. In Section 4, we describe the application of the visualization techniques to support two interventions from Ear-, Nose-, Throat surgery. Finally, in Section 5 we conclude the paper.
• Graphical Overview: On radiologic workstations, in general, only one slice is visible at a time. The display of more slices is feasible at the expense of image size and/or resolution. Even with several slices visible at a time, no overview is available. • Localization of Target Structures: Especially for intraoperative navigation, the localization of target structures such as tumors is an urgent problem. • Safety Margins: Malignant tumors have to be resected with a sufficient margin. Also, in intraoperative navigation it is important to maintain some distance from the structures at risk, such as nerves and blood vessels, to avoid damaging them. Although our work is focused on medical visualization, we also consider other application areas to get ideas supporting an improved overview and localization of target structures.
2. Related Work [LE05] developed a 2D illustrative slice viewer to provide more information than the original data and visualize structures more effectively. To emulate example 2D illustrations, they composed a texture synthesis and color transfer method to generate illustrative 3D textures. For preoperative liver surgery planning, [PBS∗ 02] suggest the use of corresponding 2D and 3D viewers to exploit the advantages of both visualizations for interaction tasks, such as measurement and virtual resection. [LGF00] suggest the display of safety margins around liver tumors for risk analysis. [NWF∗ 04] developed a virtual endoscopy system (STEPS), using 3D endoscopic techniques to aid in the navigation. Research in intraoperative visualization focused on augmented reality solutions. [FNF∗ 04] and [Sch03] track an intraoperative camera and project additional information derived from preoperative image analysis in the operating view. [MZK∗ 05] investigate the usability of a see through screen, which enables the surgeon to look at the patient through a screen with the derived information. Birkfellner et al. propose the Varioscope, a light-weighted headmounted operating microscope used as a head mounted display [BFH∗ 00, BFH∗ 02]. Commercial solutions, such as the VectorVision® family (BrainLab™) or NaviBase® (RoboDent™) employ three orthogonal slices and an optional view for a multi-planar reconstruction (MPR) or a 3D view. Additionally, target points are assigned by markers or crosshairs. These visualizations are not enhanced with any segmentation information derived preoperatively.
3.1. Graphical Overview For an overview of the segmented structures in a 2D visualization, it is essential to present the relative position of structures in the current slice as well as their positions in the third dimension, i. e. within the whole set of slices. For that purpose, we present a 2.5D approach to provide the essential information. In the following, we refer to the in-plane coordinates as x, y and the slice number as the z-dimension. 3.1.1. Graphical Overviews in Time Scheduling The visualization problem that occurs here is similar to time scheduling. In this area, different techniques have been developed to visualize data entries and their temporal relations to each other. An appointment is characterized by an interval in time (tmin ,tmax ). Graphical overviews should present appointments distinguishable from each other and the temporal relations between appointments. Colored labels for different kinds of entries (e.g. private or business) and methods for handling chronological intersections allow a fast perception of the data. Examples for such techniques are found, for example, in Gantt charts or in the LifeLines project [PMR∗ 96, PMS∗ 98]. Translated to slice-based visualization, the interval of slices of the segmented structures corresponds to the lengths of appointments. We assume that each structure can be characterized by an interval of slices (zmin , zmax ) to which it belongs. We do not consider disconnected structures occurring in several intervals. The current slice corresponds to the current time or date. Like appointments, the intervals of slices to which anatomic structures belong may overlap each other. © The Eurographics Association 2006.
Tietjen et al. / Enhancing Slice-based Visualizations of Medical Volume Data
Sweepline
(a) Layout computation for the com- (b) Basic layout for MPRs pact version
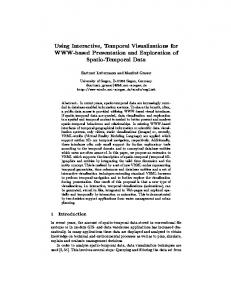
Figure 2: Concept of the L IFT C HART widget. The colored bars represent z-dimensions of anatomical structures in a volume dataset (right portion).
3.1.2. Graphical Overviews for Slice-based Visualizations Similar to temporal overviews in time scheduling, we attach a narrow frame next to the cross sectional image that represents the overall extent of slices in the volume data set. The top and bottom boundary of the frame correspond to the top and bottom slice of the dataset. Each segmented structure is displayed as a bar at the equivalent vertical position inside this frame. The vertical extent of the bar represents the interval (zmin , zmax ) for each structure. Upper bars correspond to higher structures in the body. Figure 2 presents a sketch of this concept. The overview is used to indicate in which slices certain structures occur. We refer to this combination of bars as L IFT C HART and regard it a widget which provides interactive facilities to locate structures and slices. To achieve an optimal horizontal distribution of bars in the frame, they are ordered with a Sweepline algorithm [PS93]. The slices are processed from bottom to top and for each anatomic structure a bar is drawn in the leftmost available column. If a structure ends, the respective column is freed again and can hold the bar of a new structure starting farther above. This visualization can be used not only in the standard cross sectional slices but also for MPRs, which cross the dataset in arbitrary direction. Here, the bounding boxes for each structure are projected onto a plane orthogonal to the MPR cutting plane which yields the appropriate extents of the structures (Figure 3(b)). The sorting algorithm remains the same. The L IFT C HART enhances the recognition of relative positions of structures in the volume dataset by displaying their spatial relations. To simplify the correlation between the slice view and the L IFT C HART, the color and style (if different styles are used) of the bars should correspond with © The Eurographics Association 2006.
Figure 3: Computation of the L IFT C HART layout. Left: the Sweepline moves from bottom to top and places the next available bar at the leftmost unused column. Right: the bounding box of the structure is used for computing the L IFT C HART from arbitrary directions.
the color and style of the structures displayed in the slice view. The currently displayed slice of the volume dataset is depicted by a horizontal line in the L IFT C HART widget. The slice number is displayed next to this representation. To visualize not only the z-distribution of structures in the volume, but also information about their horizontal position, we developed several arrangements of the bars in the L IFT C HART. In Figure 4, some possibilities are displayed according to structures in the neck region. The L IFT C HARTs represent structures in the neck region. Muscles (brown), veins (blue), arteries (red) and the lung (skin-colored) are shown as context. The yellow bars represent lymph nodes, the tumor is represented as a beige bar. The green line denotes the current slice. Figure 4(a) shows the most simple form including the optimization with the Sweepline algorithm. Each anatomic structure is represented by one bar. Note that due to the ordering, different categories of anatomic structures can be displayed in one column. Separated L IFT C HART. Since some anatomic structures have a defined side, e. g. the left or right Arteria Carotis Interna, the L IFT C HART may be divided in three parts: one part for structures on the left and on the right side each and one part for structures in the middle (Figure 4(b)). Aggregating Structures in the L IFT C HART. It is also possible to group bars which belong to the same class of anatomical structures to minimize the horizontal extent of the widget (Figure 4(c)). In contrast to Figure 4(a) and (b), the lymph nodes are aggregated into one column. The choice whether structures should overlap each other in the L IFT C HART or not depends on the clinical question. Pathologic lymph nodes are additionally emphasized by changing their color to a reddish tone. This is not possible in the other two versions of the L IFT C HART shown in Figure 4, because
Tietjen et al. / Enhancing Slice-based Visualizations of Medical Volume Data
JBiR
JBiL
CBiL
CBiR 24
(a)
24
(b)
24
(c)
Figure 4: Different possibilities of arranging structures in the L IFT C HART. (a) shows the most simple form. Each anatomic structure is represented by one bar. In (b), the L IFT C HART is divided in three parts: one part for structures on the left and on the right side each and one part for structures in the middle. In (c), structures of one category are aggregated in one column. Additional landmarks for orientation are displayed.
a different color denotes a different category of anatomic structures. Furthermore, landmarks for orientation in the dataset may be displayed at the frame of the L IFT C HART. As an example relevant for neck dissections, in Figure 4(c), the bifurcations of the Vena Jugularis (JBiL/JBiR) and Arteria Carotis (CBiL/CBiR) are indicated. 3.1.3. Interactive L IFT C HART Besides visualizing intervals of slices, the L IFT C HART widget can be used for interaction and navigation. The horizontal slice indicator is operated like a normal scrollbar and moves through the slices. If the mouse is placed over a particular bar, specific information about the underlying anatomic structure is shown as a tool tip. Directly selecting the L IFT C HART next to the bars moves the slice view to the slice number at the respective height. If a particular bar is selected, all slices containing the structure may be displayed by automatically cycling through the slices. In this way, a quick navigation between different structures on different slices is made possible. 3.2. Localization of Target Structures For the localization of target structures, different techniques are known from other domains, like crosshairs or halos. Usually, crosshairs only show the exact location of one structure or position in a visualization. This position is indicated by the intersection point of two lines which form the crosshairs.
Figure 5: The size of the halos depends on their distance from the target point (gray slice). The line style indicates if the current slice is above or below the target.
For intraoperative navigation, one fixed structure (e.g. the tumor) needs to be focused while a second object (e.g. the surgical tip of tool) is tracked. Both positions need to be visualized. 3.2.1. Localization of Target Structures on Road Maps Halos, as introduced by [BR03], are another technique to visualize distance and direction to a defined target. They are used for road maps on small displays to localize targets outside the visible screen area. These targets are marked by a circle with the respective distance as radius. The circles appear as circular arcs on the display since the center is outside the visible area. 3.2.2. Localization of Target Structures in Slice-based Visualizations In contrast to road maps, in our scenario the target does not lay at the same level as the displayed section but either above or below. Therefore, the radius of the halo matches the difference in slices between the current section and the target point, whose xy-position specifies the center of the circle. Given a target point in another than the current slice, a circle is drawn on the current slice with a radius equal to the distance between the current and the target slice. The line style of the circle indicates whether the position of the target is above or below the current slice (see Figure 5). If the current slice is moved towards the target, the radius of the circle decreases linearly with the target distance. To express the distance between the current slice and the target by the change of the radius, a non-linear decrease of the size might be preferable. This can be achieved by multiplying the computed halo radius with a function that increases the speed of decrease in radius the closer the target is. It is yet to be determined how much this modification affects the recognition of the distance between target and current slice. The linear form is preferable for viewing single slices since the size here is directly proportional to the distance. The non-linear form eases navigation since changes in size are larger the closer the target. The already mentioned single crosshairs can be extended in such a way that the surgical tool (e. g. a drill) is tracked with the cross and the target region (tumor) is marked on © The Eurographics Association 2006.
target x
distance
Tietjen et al. / Enhancing Slice-based Visualizations of Medical Volume Data
CBiR
tip of tool
52
CBiL
scale
Figure 6: The traditional crosshairs are enhanced to specify two points. The center is used to track a surgical tool, whereas the marks on the axes define a second target point.
the lines that form the cross in different color or using tick marks. These markings for the target region can be varied according to the user’s preferences – tick marks, colored regions, or a combination thereof. The center of these marks defines the xy-position of the target, whereas its distance to the current slice is depicted by the distance between the marks (Figure 6). The target direction can be color-coded or visualized by an arrow in the center of the crosshairs.
3.3. Slice-based Visualization of Safety Margins Safety margins are useful for intervention planning and intraoperative navigation. During a tumor resection, the tissue around the tumor is also resected to be sure that all pathologic tissue is removed. During the intraoperative navigation, it is useful to give the surgeon a hint about structures at risk near the surgical tool. To prevent structures at risk from damage, the distances of the surgical tool to such structures have to be carefully observed during the surgery and, therefore, to be displayed. Halos (in the original sense of the word) can convey this distance information. Therefore, for all structures at risk an Euclidean distance transform [Bor83, Loh98] is performed and the resulting distance information is overlaid on the slice image. We considered color-coding the distance information but rejected this idea, since presenting a color map would display too much information not relevant for the surgical strategy. Depicting important distance thresholds as halos by drawing two isolines representing defined distances turned out to be more appropriate in discussions with clinical partners. Thus, the quantitative distance information is reduced to a few categories which is easier to interpret. Note that these halos do not show distances to target structures as above but instead safety margins around structures. © The Eurographics Association 2006.
JBiL
JBiR
Figure 7: The probably pathologic structures (tumor and lymph nodes) are shown in the L IFT C HART. The lymph nodes of one side are combined into one column. Enlarged lymph nodes are colored red. For the lymph nodes safety margins of 2mm (red) and 5mm (yellow) are shown.
4. Application Scenarios The enhanced slice-based visualizations are suitable for intervention planning and intraoperative navigation. To demonstrate the application of the techniques, we choose two different surgical interventions in the realm of Ear, Nose, Throat surgery (ENT) [KTH∗ 05]. The segmentation of the relevant structures, which is a necessary prerequisite for the visualization, is accomplished with dedicated software assistants [APSH04, CDP∗ 06]. Applications in other areas, like orthopedics, are also possible. The first scenario relates to the planning of a neck dissection. Neck dissections cannot be carried out as minimallyinvasive endoscopic interventions. Therefore, surgeons have direct visual access to the whole operative area and intraoperative navigation is less important. A graphical overview is essential since many anatomic structures are relevant, but the localization of a target structure is not necessary. The second scenario relates to functional endoscopic sinus surgery (FESS) [Ken00]. For endoscopic interventions, intraoperative navigation is crucial because surgeons have no direct visual connection to the operative field. 4.1. Intervention Planning Neck dissections are carried out for patients with malignant tumors in the head and neck region to remove lymph node metastases. The extent of the intervention depends on the occurrence and location of enlarged lymph nodes. If important structures are infiltrated, the involved areas are not resectable. Therefore, it is important to estimate the resectabil-
Tietjen et al. / Enhancing Slice-based Visualizations of Medical Volume Data
portant landmarks are missing. Computer-assisted navigation is regarded as a necessity when a tumor in a critical area should be removed [SKR∗ 05]. As an example, navigation is used for the resection of tumors in the skull base in order to protect Nervus Opticus and Arteria Carotis Interna. The distance of a structure at risk to the surgical tool and the localization of the pathologic structure has to be supported visually.
Figure 8: Corresponding 3D visualization of Figure 7. Margins for lymph nodes outside the current slice are also visible.
ity as reliably as possible. In neck dissections, there are the following strategies: left or right sided and with different kinds of radicality e.g. with resection of muscles. A lot of structures have to be taken into account (e. g. muscles, vessels, nerves and up to 60 lymph nodes). In addition, critical distances or infiltrations of lymph nodes into important structures have to be identified. These two tasks can be supported using the L IFT C HART and the safety margin visualization. Due to the (potentially) large amount of lymph nodes, all lymph nodes of one side may be combined in one bar indicating in which slices lymph nodes may occur. The separation in lymph nodes located at the left and right side is motivated by the surgical strategies (left and/or right-sided surgery). The identification of pathological lymph nodes is important, thus, all noticeable nodes are emphasized. Some elongated structures like muscles and vessels occur in all slices, and are therefore not displayed (Figure 7). Other structures like the larynx are displayed, because they represent important landmarks for the orientation in the dataset. The safety margins are shown for all enlarged lymph nodes. Since the distances are computed in 3D, margins for lymph nodes outside the current slice are also visible (Figure 8). While this application of the L IFT C HART is applicationspecific, similar considerations are applicable to other intervention tasks. Due to the symmetry of the human body, the separation of the L IFT C HART into a left and right portion is often useful. 4.2. Intraoperative Navigation Endoscopic sinus surgery is an effective approach for removing lesions, including benign tumors, skull base defects with reduced trauma for the patient. Functional endoscopic sinus surgery is often supported by intraoperative navigation, especially in complex cases like relapse surgeries where im-
In practice, the tip of a surgical tool, e. g. a drill or simply a pointer, is tracked and visualized on the screen of the navigation system. The screen shows in general three orthogonal slices or an MPR using crosshairs to denote the tip of the tool. The surgeon cannot see structures lying on a slice aside. We propose to integrate the visualization of safety margins and the halo technique in these visualizations. In our scenario, we focus on a tumor near to the skull base. The surgeon has to navigate the surgical tools deep into the nasal cavity, passing a lot of bone lamella, so it is possible to get lost, even for a skillful surgeon. Near to the skull base the already mentioned Arteria Carotis Interna is located. Figure 9 demonstrates an orthographic view. The halo guides the surgeon to the tumor and the crosshairs track the tip of the tool. The different line styles of the halos indicate the required moving direction. 5. Conclusion & Future Work We present new approaches for enhancing slice-based visualizations for surgical planning and intraoperative navigation. Our methods address the basic problems of slicebased visualization, namely the lack of an overview in crosssectional images, the difficulty of localizing target structures, and the display of safety margins. For the intraoperative visualization, we developed techniques supporting a target-driven navigation of surgical tools using the halo technique. Furthermore, we support intervention planning, because the occlusion problem is circumvented using the L IFT C HART. The division in columns representing the left and right sides directly supports the surgical strategy. The enhancement of slice-based visualization using illustrative techniques has great potential. The work presented here is based on informal discussions between computer scientists and medical doctors specialized in ENT surgery. To enable a more goal-oriented development of the visualization techniques, a clinical evaluation of the visualization techniques is important. The slice-based visualizations cannot substitute 3D visualizations. Especially in intervention planning, 3D visualizations convey the spatial relationships among structures. To achieve correspondence between slice-based and 3D visualizations, the rendering styles and coloration have to be consistent in the 2D and 3D visualization as well as in the L IFT C HART. © The Eurographics Association 2006.
Tietjen et al. / Enhancing Slice-based Visualizations of Medical Volume Data
(a) The halo guides the surgeon to the target point. If the tool has to be moved upward, the lined red is shown. The stippled blue halo indicates a movement in the other direction.
(b) The crosshairs depict the current position of the surgical tool. The both marks on each hair indicate location and distance to the target.
Figure 9: Intraoperative navigation in an orthogonal view. A surgical tool has to be moved to the tumor. The arteries may not be harmed. The crosshairs depict the current position of the surgical tool. The arrow in the center of the crosshairs is useful for navigation on narrow space. Not the xy-direction is indicated, but the direction in z-direction. The safety margin to the artery gives a hint whether the tool is navigated too close to it.
We are considering several extensions of the L IFT C HART widget. For example, the distance to structures at risk could be color-coded into one bar. Other illustrative rendering styles, like stippling, hatching or silhouettes are also suitable to discriminate structures in the L IFT C HART. Furthermore, the cross sectional images themselves may be enhanced with illustrative rendering techniques primarily for educational purposes.
Acknowledgments This work was carried out in the framework of a project supported by the Deutsche Forschungsgemeinschaft (DFG) (Priority Programme 1124, PR 660/3-1). Special thanks go to Jana Dornheim and Jeanette Cordes for segmentation and Oliver Burgert (ICCAS) for his helpful suggestions.
References [APSH04] A PELT D., P REIM B., S TRAUSS G., H AHN H.: Bildanalyse und Visualisierung für die Planung von Nasennebenhöhlen-Operationen. In Bildverarbeitung für die Medizin (2004), Informatik aktuell, Springer, pp. 194– 198. 1 [BFH∗ 00] B IRKFELLNER W., F IGL M., H UBER K., WATZINGER F., WANSCHITZ F., H ANEL R., WAGNER © The Eurographics Association 2006.
A., R AFOLT D., E WERS R., B ERGMANN H.: The Varioscope AR – A Head-Monted Operating Microscope for Augmented Reality. In Proc. of Medical Image Computing and Computer-Assisted Intervention (MICCAI) (2000), Springer, pp. 869–877. 2 [BFH∗ 02] B IRKFELLNER W., F IGL M., H UBER K., WATZINGER F., WANSCHITZ F., H UMMEL J., H ANEL R., G REIMEL W., H OMOLKA P., E WERS R., B ERGMANN H.: A Head-Mounted Operating Binocular for Augmented Reality Visualization in Medicine Design and Initial Evaluation. IEEE Trans. Med. Imaging 21, 8 (2002), 991–997. 2 [Bor83] B ORGEFORS G.: Chamfering: A Fast Method for Obtaining Approximations of the Euclidean Distance in N Dimensions. In Proc. 3rd Scand. Conf. on Image Analysis (SCIA3) (Copenhagen, Denmark, July 1983), pp. 250– 255. 5 [BR03] BAUDISCH P., ROSENHOLTZ R.: Halo: A Technique for Visualizing Off-Screen Locations. In Proceedings of CHI (Apr. 2003), ACM Press, pp. 481–488. 4 [CDP∗ 06] C ORDES J., D ORNHEIM J., P REIM B., H ER TEL I., S TRAUSS G.: Pre-operative Segmentation of Neck CT Datasets for the Planning of Neck Dissections. In SPIE Medical Imaging (Feb. 2006), SPIE Press. Accepted. 1 [FNF∗ 04]
F ISCHER J., N EFF M., F REUDENSTEIN D.,
Tietjen et al. / Enhancing Slice-based Visualizations of Medical Volume Data
BARTZ D., S TRASSER W.: ARGUS: Harnessing Intraoperative Navigation for Augmented Reality. In 38. DGBMT Jahrestagung Biomedizinische Technik (BMT) (Sept. 2004), pp. 42–43. 2 [GKG∗ 99] G ERING D., K IKINIS A. N. R., G RIMSON W. E. L., H ATA N., E VERETT P., J OLESZ F., III W. W.: An Integrated Visualization System for Surgical Planning and Guidance using Image Fusion and Interventional Imaging. In Proc. of Medical Image Computing and ComputerAssisted Intervention (MICCAI) (Sept. 1999), Springer, pp. 809–819. [GP98] G ALANSKI M., P ROKOP M.: GanzkörperComputertomographie, 1 ed. Georg Thieme, 1998. 2 [HPP∗ 01] H ÖHNE K. H., P ETERSIK A., P FLESSER B., P OMMERT A., P RIESMEYER K., ET AL .: VOXEL-MAN 3D Navigator: Brain and Skull. Regional, Functional and Radiological Anatomy. Springer, Heidelberg, 2001. CDROM. 1 [Ken00] K ENNEDY D. W.: Diseases of the Sinuses. Elsevier Books, Oxford, Oct. 2000, ch. 16a: Functional Endoscopic Sinus Surgery: Concepts, Surgical Indications, and Instrumentation, pp. 197–210. 5
[PMR∗ 96] P LAISANT C., M ILASH B., ROSE A., W ID OFF S., S HNEIDERMAN B.: LifeLines: Visualizing Personal Histories. In CHI ’96: Proc. of the SIGCHI conference on Human factors in computing systems (New York, NY, Apr. 1996), ACM Press, pp. 221–227. 2 [PMS∗ 98] P LAISANT C., M USHLIN R., S NYDER A., L I J., H ELLER D., S HNEIDERMAN B.: LifeLines: Using Visualization to Enhance Navigation and Analysis of Patient Records. Tech. Rep. CS-TR-3943, HCI Laboratory, University of Maryland, 1998. 2 [PS93] P REPARATA F. P., S HAMOS M. I.: Computational Geometry: An Introduction, 5 ed. Springer, New York, 1993. 3 [Sch03] S CHEUERING M.: Fusion of Medical Video Images and Tomographic Volumes. PhD thesis, University of Erlangen-Nürnberg, 2003. 2 [SKR∗ 05] S TRAUSS G., KOULECHOV K., R ICHTER R., T RANTAKIS C., D IETZ A., L ÜTH T.: Navigated Control in Functional Endoscopic Sinus Surgery. Int. Journal of Medical Robotics and Computer Assisted Surgery 1, 3 (Sept. 2005), 31–41. 6
[KTH∗ 05] K RÜGER A., T IETJEN C., H INTZE J., P REIM B., H ERTEL I., S TRAUSS G.: Interactive Visualization for Neck-Dissection Planning. In IEEE/Eurographics Symposium on Visualization (EuroVis) (Leeds, UK, June 2005), Brodlie K. W., Duke D. J., Joy K. I., (Eds.), Eurographics Association, pp. 295–302. 1, 5 [LE05] L U A., E BERT D. S.: Example-based Volume Illustrations. In Proc. of IEEE Visualization (Oct. 2005), IEEE, pp. 655–662. 2 [LGF00] L AMADE W., G LOMBITZA G., F ISCHER L.: The Impact of 3-Dimensional Reconstructions on Operation Planning in Liver Surgery. Archives of Surgery 135, 11 (2000), 1256–1261. 2 [Loh98] L OHMANN G.: Volumetric Image Analysis. Wiley–Teubner, Chichester, 1998. 5 [MZK∗ 05] M ISCHKOWSKI R., Z INSER M., K ÜBLER A. C., Z ÖLLER J. E., S EIFERT U.: Clinical and Experimental Evaluation of an Augmented Reality System in Cranio-Maxillofacial Surgery. In Computer-Assisted Radiology and Surgery (2005), pp. 565–570. 2 [NWF∗ 04] N EUBAUER A., W OLFSBERGER S., F ORSTER M.-T., M ROZ L., W EGENKITTL R., B ÜH LER K.: STEPS - An Application for Simulation of Transsphenoidal Endonasal Pituitary Surgery. In Proc. of IEEE Visualization (Oct. 2004), IEEE, pp. 513–520. [PBS∗ 02]
P REIM B., B OURQUAIN H., S ELLE D., O LD K. J., P EITGEN H.-O.: Resection Proposals for Oncologic Liver Surgery based on Vascular Territories. In Computer-Assisted Radiology and Surgery (June 2002 (2002), Springer, pp. 353–358. 2 HAFER
© The Eurographics Association 2006.
Tietjen et al. / Enhancing Slice-based Visualizations of Medical Volume Data
JBiR
CBiR 24
Figure 8: Corresponding 3D visualization of Figure 7.
52
CBiL
Figure 7: L IFT C HART and safety margins.
© The Eurographics Association 2006.
CBiL 24
Figure 4: Possibilities of arranging the L IFT C HART.
JBiL
JBiR
CBiR
Figure 2: Concept of the L IFT C HART widget.
24
JBiL
Figure 9: Intraoperative navigation in an orthogonal view.