614
IEEE TRANSACTIONS ON ELECTRON DEVICES, VOL. 48, NO. 4, APRIL 2001
Equivalent Circuit Parameters of Resonant Tunneling Diodes Extracted from Self-Consistent Wigner–Poisson Simulation Peiji Zhao, Hong Liang Cui, Member, IEEE, Dwight L. Woolard, Senior Member, IEEE, Kevin L. Jensen, Member, IEEE, and F. A. Buot, Senior Member, IEEE
Abstract—The equivalent circuit parameters of resonant tunneling diodes (RTD) are extracted from numerical simulation results for RTDs. The RTD models used in this paper are double barrier structures. The influence of the resonant tunneling structure (RTS) parameters, such as the height of barriers, the width of the quantum well, the width of the spacers, and the width of the barriers, on the device parameters are systematically discussed. The effects of device temperature on device parameters are also discussed. Scattering between electrons and phonons greatly affects device parameters thereby the function of the RTDs. Physical explanations about how the structure parameters and device temperature influence the device parameters are provided. Based on the analysis results, a general way to get a RTD oscillator with a higher maximum frequency is suggested.
I. INTRODUCTION
S
INCE the introduction of resonant tunneling diode (RTD) structures by Chang et al. [1], the – characteristics and the origin of negative differential resistance (NDR) in the structures have been well understood [2]–[4]. These structures may be used as an oscillator with operating frequencies as high as 712 GHz and a mixer with operating frequency of 2.5 THz [5]. The remarkably fast-acting NDR of RTDs make them excellent devices for very high-frequency electronic applications. In order to understand the performance limit of RTD and to allow for the design of devices integrated with radiating structures or transmission lines, it is desirable to obtain an accurate equivalent circuit model (ECM). Two equivalent circuit models for RTD have been presented [6], [7]. One is a series-inductance model and the other is a parallel-inductance model. Quantum-based simulation of RTD suggests that, however, due to the correlation of Fermi level of source and the resonant energy level of the quantum
Manuscript received February 15, 2000; revised July 3, 2000. The work at Stevens Institute of Technology was supported by the U.S. Office of Naval Research under Contract N66001-95-M-3472, and by the U.S. Army Research Office under Contracts DAAH04-94-G0413 and DAAG55-97-10355. The review of this paper was arranged by Editor A. H. Marshak. P. Zhao was with the Department of Physics and Engineering Physics, Stevens Institute of Technology, Hoboken, NJ 07030 USA. He is now with the Department of Electrical and Computer Engineering, North Carolina State University, Raleigh, NC 27695 USA. H. L. Cui is with the Department of Physics and Engineering Physics, Stevens Institute of Technology, Hoboken, NJ 07030 USA (e-mail:
[email protected]). D. L Woolard is with the Army Research Office, RTP, NC 27709 USA. K. L. Jensen and F. A. Buot are with the Naval Research Laboratory, Washington, DC 20375-5000 USA. Publisher Item Identifier S 0018-9383(01)00759-6.
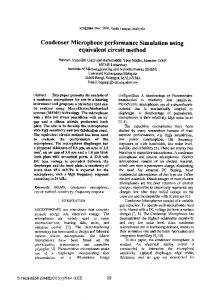
well, an inductive delay element should exist in the NDR region in parallel with the capacitance and in series with the nonlinear RTD intrinsic conductance. Thus, the parallel-inductance model of the equivalent circuit of RTD is a more appropriate equivalent circuit model of RTD (see Fig. 1) [8]. One of the tasks of device simulations is to extract device parameters for the equivalent circuit models from simulation results. Equivalent circuit model parameters for RTD at some special bias points have been extracted from simulation results [8]–[10]. However, since RTDs are highly nonlinear devices, device parameters are complicated functions of the applied voltages. The parameters at special voltage points should not be used to describe the overall behavior of the device in a certain region of voltage. There is no systematic study on how these circuit parameters are affected by bias, temperature, and device structure parameters. Recently, Huang et al. calculated conductance, capacitance, and inductance values of a RTD as a function of bias by self-consistently solving Schrödinger equation and Poisson equation [12]. Scattering in the system are not included in their calculations. It should be noted that the electrons in RTDs are in states far from equilibrium. Thus, Schrödinger equation is not suitable to describe the transport characteristics of carriers in RTDs. Furthermore, scattering in the systems may cause the change of the peak-to-valley ratio of the current–voltage (I–V) curve and the profile of conduction band edge of the device [3]. Hence, their results can only qualitatively describe the characteristics of the equivalent circuit model parameters. A systematic study of the RTD parameters, including the effects of scattering, nonequilibrium behavior of electrons, and quantum mechanics, is needed. About ten years ago, Goldman et al. found the hysteresis and plateau-like behavior of the I–V curve of RTDs. However, the origin of the hysteresis and plateau-like behavior of the I–V curve of RTDs has been the focus of on-going debate until it is found recently that five factors jointly determine the form of the I–V curve of RTSs [18]. These factors are the interference between the injected and the reflected electron waves, the behavior of the motion of an electron in an electric field, electron–phonon interactions, coupling between the energy level in the emitter quantum well (EQW) and that in the main quantum well (QW), and the behavior of the quasibound state in the main QW in an electric field. These factors jointly determine the form of the I–V curves and the charge distribution in the whole device region. The effects of the above stated factors are closely related to the structure parameters of RTDs. Thus, the latter may greatly
0018–9383/01$10.00 © 2001 IEEE
ZHAO et al.: RESONANT TUNNELING DIODES
615
influence the device parameters of the RTDs. However, the details of such influence remains to be revealed. In this paper, by self-consistently solving Wigner function equation and Poisson equation and that nonequilibrium effects and phonon scattering can be included so that a physical reasonable self-consistent potential can be obtained, we systematically study the relation between RTD ECM parameters and bias, temperature, phonon scattering , etc. Conductance, capacitance, and inductance values are extracted from the simulation results as functions of bias. This paper is organized as follows. In Section II, we describe the numerical technique used in this paper. Section III discusses how to extract device parameters of RTDs from the simulation results. Numerical calculation results and the influence of structure parameters on RTD device parameters are given in Section IV. Physical explanations for the influence of structure parameters on RTD device parameters are also presented in this Section. The conclusion of this paper is given in the last section.
II. NUMERICAL TECHNIQUE The Wigner function formulation of quantum mechanics has many useful characteristics for the simulation of quantum-effect electronic devices, including the natural ability to handle small-signal or transient conditions in self-consistent, dissipate and open-boundary systems. Wigner function equation may be derived in one of several ways [13]. Since Wigner function may be defined by nonequilibrium Green’s functions, the Wigner function equation may be derived from the equation of motion of the nonequilibrium Green’s function [14], [17]. In deriving Wigner function equation, the effective mass model of the band structure has been employed. The effective mass approximation to band structure is efficient in computing. It is also a good approximation to the energy band of a microstructure if the feature size of the structure is greater than 50 Å. With the lowest order approximation to scattering , in terms of the spatial variable , wave vector and time , we have the equation of motion of the Wigner function
Fig. 1.
Equivalent circuit model of resonant tunneling diodes.
scattering , the collision terms in the above equation may be written as [14]
(2) where is the relaxation time and is the equilibrium Wigner function. It should be noted that electron–phonon interaction does not change the spin of electrons in the devices. Thus relaxation time approximation keeps the statistics of electron system in the device unchanged. The boundary conditions are (for a de) vice bounded in the region
(3)
(4) Equation (1) should be self-consistently solved with the Poisson equation (PE) (5) where permittivity; electrical potential energy; electronic charge; concentration of ionized dopants; density of electrons; given by the expression
(1) (6) where Planck’s constant;
The current density may be written as
electron effective mass; conductance-band-edge. In the present work, we consider steady transport only. If fol, and we will suppress explicit appearlows that, ance of time . In terms of the relaxation time approximation to
(7) To solve the WFE-PE system, we must discretize the these two equations over the simulation zone. The details of this process have been well described elsewhere [2], and only a summary of
616
IEEE TRANSACTIONS ON ELECTRON DEVICES, VOL. 48, NO. 4, APRIL 2001
the results is given here. Assuming that the simulation zone is and , the Wigner distribution function between may be discretized as follows
Discretizing this equation by employing the central difference scheme, we obtain (20)
(8) where (9) (10)
(21)
and are the number of and points on a grid in where phase space. Using a second-order upwind difference scheme to discrete the position derivative, we have
(22) and
(11) (12) (23) (13)
(14) and
In our simulation, we first approximate the conduction band from (1) and (6). profile by a square well potential and get The density of electrons is substituted into Poisson equation and then the new conduction band profile is obtained, where is the offset of the band edge. Using this new conduction band profile, Wigner function equation is solved again. This iteration continues until self-consistency is achieved by a simultaneous solution of (1) and (5).
(15) We consider only steady-state device parameters. Thus, the discretized static WFE is (16) is the boundary condition matrix defined by (3) and where (4). The discretized density of electrons and current density may be written, respectively, as
III. EQUIVALENT CIRCUIT PARAMETERS A. Conductance The equivalent circuit model given by [9] includes a conductance, , a capacitance, , and an inductance, . For small signal, the conductance is defined as (24) which is the differential conductance per unit area. It may be extracted, in terms of numerical derivative technique, from the computed – curve as
(17) (25) and B. Capacitance
(18)
The capacitance of the device is associated with the change in stored charge in the device due to changing bias voltage. In the literature, there are mainly two ways to extract quantum device capacitance. Sun et al. [11] used the following formula to calculate the device capacitance
For PE, we are interested in getting the potential change at each iterative calculation. Thus, by writing the potential as , where is the solution of Poisson equation at the previous iteration, (5) may be written as
(26)
.
(19)
where (27)
ZHAO et al.: RESONANT TUNNELING DIODES
617
Here is the net charge on the right hand side of the wellbarrier region. The effects of the charges in the well on the total capacitance is deemed minute, and is neglected. Huang et al. employed a different way to extract the capacitance of devices [12]. In their treatment on extracting device capacitance, these authors defined the device capacitance by using the following formula (28) is the differential change in charge per unit area where between the emitter and collector regions associated with the change in bias, (29) and are obtained at each bias The charges point by integrating the total charge density on the collector and emitter, respectively. The charges on the collector and emitter may be extracted from the electron density at each bias point since the doping density is known. These two methods for extracting device capacitance are quite different. In terms of (26), the zero-bias capacitance, which is the capacitance of a parallel plate capacitor, is automatically involved in this equation. In terms of Huang et al.’s method the contribution of a parallel plate capacitor must be added separately. Strictly speaking, the charges in the emitter, the collector, and the well-barrier region, and the geometry of the RTD all contribute to the capacitance of the RTD. Since the contribution from the charges in the well-barrier region is very small [11] and the main aim of this paper is to consider the effect of the structure parameters on the capacitance, we consider only the capacitance contributed by charges in the emitter and collector regions. It is easy to get the total capacitance of the device. In a crude approximation, the zero-bias capacitance, the capacitance of a parallel plate capac, where is the surface area of the itor, is simply interface, is the dielectric constant of the material, and is the width of the quantum well. C. Inductance That the current lags voltage in time is the basic characteristic of an inductive circuit. The inductance of an inductor is generally defined in terms of magnetic flux and current. According to the conventional definition of the inductance, it depends only on the geometry of the device, if no iron or similar materials are nearby. However, for RTDs, the equivalent inductance arises from charge storage in the well, which is essentially the result of finite quasibound state lifetime in the well. The latter depends not only on the geometry of the device, but also on scattering in the system, since scattering in the system will lead to the change of the conduction band profile and in turn the lifetime of the quasibound state. The quantum inductance of RTD may be expressed in terms of the lifetime of the quasibound state in the well as (30)
where is the lifetime of the charge in the well and conductance. In our simulation, is estimated by is the total charge in the well. where
is the ,
IV. NUMERICAL CALCULATION AND ANALYSIS OF RESULTS To extract device model parameters from the computed I–V curve, we need to obtain the I–V curve and the charge distribution as a function of bias first. In our simulation, we have endeavored to simulate a RTD with properties similar to or identical to those of experimental RTDs. The device structure we have used in our simulation has been extensively used by other researchers [14], [15]. The structure parameters used are: a computational box of 550 Å; well and barrier sizes of 50 and 30 Å, respectively; the self-consistent calculations assumed that the doping was constant up to 30 Å from the first barrier and after 30 Å from the second barrier with magnitude equal to the electron cm ) and the quantum well density in the boundaries ( region is undoped; the barrier height is assumed to be 0.3 eV and is merely added on to the bias potential profile. This device structure has been shown to exhibit hysteresis and plateau-like behavior of the I–V characteristics of a RTD and is first simulated by Jensen and Buot [2]. We have recently presented a resonant tunneling theory which offers a complete explanation of the origin of the hysteresis and plateau-like behavior of the I–V characteristic of RTD for the first time [18]. In this section, the effects of RTD structure parameters on the equivalent circuit parameters will be discussed. It should be noted that it is not easy to isolate the effects of well width or barrier width on device parameters since the length of the simulation box is fixed. In our simulation, we have kept other parameters unchanged except the doping regions when we change the well width or the barrier width. The effects of the length of doping regions on simulation results have been discussed in our recent paper [18]. Since the explanation of the relationship between device parameters and bias voltage is based on our resonant tunneling theory, we briefly describe our theory here for the convenience to the readers of this paper. A. Effects of Barrier Width Fig. 2 shows the effects of the width of the barriers on device parameters. In this figure, the width of the barriers is varied and the other structure parameters are kept unchanged. Fig. 2(a) shows the I–V characteristic of these RTSs. It clearly shows the experimental feature of the I–V curve, the plateau-like structure. Based on our resonant tunneling theory, the strength of interference between the injected and the reflected electron wave increases dramatically after the bias passes the resonant bias. This sudden increase in interference strength will leads to the depletion of electrons in front of the emitter barrier and a relatively positive charge background in the emitter. Thus, an emitter quantum well (EQW) is created. Separated calculation shows that there is a discrete energy level in the EQW. The coupling between the energy levels in the EQW and the main quantum well (MQW) lifts the energy level in the MQW. On the other hand, the bias voltage has the tendency of pushing the energy level in the MQW down. Once the two factors that affect the position of energy level in the MQW reach a
618
IEEE TRANSACTIONS ON ELECTRON DEVICES, VOL. 48, NO. 4, APRIL 2001
(a)
(c)
(b)
(d)
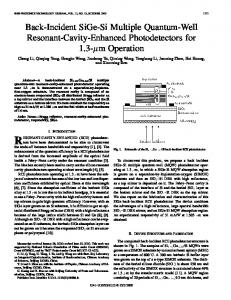
Fig. 2. Variations of device parameters with the barrier widths. (a) Current density, (b) capacitance, (c) conductance, and (d) inductance. The capacitance involves only the contribution of the charges in emitters and collectors. To get the total capacitance of the devices, one has to add the capacitance of a parallel plate capacitor to the capacitance given by the figure.
balance state, the plateau-like structure in the I–V curve is created. Further increasing the bias voltage to a special value will lead to the upside down of the relative position of the two above stated energy level. Then, the coupling between the energy levels push the energy level in the MQW down. This process destroys the EQW and ends the plateau-like structures in the I–V curves. Detailed explanations on the curves and the influence of structure parameters on the curves can be found in our recent paper [18]. Fig. 2(b) shows the relation between the capacitance and bias with the width of the barriers as parameters. The capacitance increases linearly with the bias until the bias enters the negative differential conductance region (NDCR). After passing the NDCR, the capacitance increase linearly again. From the definition of capacitance, we know that the capacitance is proportion to the net charge in the emitter and the collector of devices. With the increase
of bias, more and more electrons are accumulated in front of the emitter barrier. Meanwhile, more and more electrons in the collector are extracted, resulting in a surplus of positive charge in back of the collector barrier. Thus the net charge increases, so does the capacitance. When the bias enters the NDCR, the interference between the injected and the reflected electron wave leads to the depletion of negative charges in front of the emitter and the formation of the emitter quantum well (EQW) [18]. Compared with the change of electron density in the emitter, the electron density in the collector does not change too much [18]. Thus, the depletion of negative charge causes the reduction of the net charge in the emitter and collector thereby leading to the decrease of the capacitance. Fig. 2(b) also reflects the effects of the barrier widths. In the NDCR, the EQW is created. The coupling between the energy level in the main QW and that in the EQW creates the plateau-like
ZHAO et al.: RESONANT TUNNELING DIODES
structure of the I–V curves of the RTSs. The depth of the EQW depends on the strength of the interference between the injected and the reflected electron waves. Since the width of the quantum well and that of the simulation box do not change, the variation of the width of the barriers will change the length of the emitters and the collectors thereby the mount of positive charges. In terms of the resonant tunneling structure (RTS) with barrier width 30 Å as the reference, increasing (decreasing) the width of the barriers will decrease (increase) the length of the emitters and the collectors thereby decreasing (increasing) the mount of the positive background charge. Another factor causing the variation of the negative charge is the bias. Bias will drive the electrons toward the emitter. Impeded by the barrier-well system, some electrons will accumulate in front of the barriers. The thicker the barrier-well system, the more electrons are stopped in front of the emitter barrier. The mount of accumulated electrons in front of the emitter barrier, before the bias enters NDCR, is determined by the position of the energy level in the main QW. The above-stated two factors jointly influence the net charges in the emitters and collectors. For the structure with 27 Å barrier width, the energy level in the main QW is higher than that with 35 Å barrier width. Thus the capacitance of RTS with the 27 Å barrier width is greater than that with the 35 Å barrier width outside of the NDCR, even though widths of the emitter and collector of the RTS with the 27 Å barrier width are greater than that with the 35 Å barrier width. The same reasoning can be used to explain the relationship between the capacitance of the RTSs with 30 Å and 35 Å. It is important to note that the amount of the negative charges accumulated in front of the emitter barrier dominate the behavior of the capacitance via bias voltage (see Figs. 3b, 6b, and 9b in [18]). Thus, the capacitance via bias voltage shows the behavior given be Fig. 2(b). All capacitance–voltage (C–V) curves for the three RTSs exhibit valleys in NDCR. This valley is caused by the interference of the injected and the reflected electron waves and thereby the depletion of negative charges. The depth of the valley is also determined by the above-stated factors. For the RTS with the 27 Å barrier width, the depletion of negative charges in front of the emitter barrier is much greater than the rest of the RTSs. This causes the deeper valley in the C–V curve. Fig. 2(c) shows the conductance of the RTSs. For each RTS, there are two negative conductance valleys in NDCR. Outside the NDCR, the change of the conductance of RTS is not significant. The double-valley behavior of the conductance–voltage characteristic of RTSs is caused by the plateau-like behavior of the I–V characteristic of RTS. Thus, basically, it is the result of the interference between the injected and the reflected electron-waves and the coupling between the energy level in the EQW and that in the main QW. In the NDCR, in terms of the RTS with the barrier width 30 Å as reference, the positions of the bottoms of the valleys shift to higher voltage with the change of the barrier widths. For the left valleys, with the increase of the barrier width, the depth of the valley decrease. For the right valleys, however, the depth of the valley will increase when the widths of barriers are changed. Mathematically, the conductance is the derivative of the current density with respect to the bias. It reflects the rate
619
of the change of current with respect to the bias. The first valley corresponds to the slope of the I–V curve after the bias passes the resonant point and the second is related to that after the bias pass the plateau-like structure. Physically, the depths of the two valleys reflect the strength of the coupling between the energy level in the EQW and that in the main QW. The relation between the depth of the first valleys shows that the coupling between the energy level in the EQW and that in the main QW is weaker for the RTS with wider barrier. Since the depth of the EQW increases with the reduction of the width of barriers, the distance between the energy level in the EQW and that in the main QW will increase. This leads to the decrease of the coupling strength between the energy levels. After the bias passes the plateau-like structure, the coupling between these two energy levels will push the energy level in the main QW downward. This mechanism tends to reduce the current when the bias increases. For RTS’ with the barrier width 30 Å and 35 Å, the figure shows the tendency clearly. For RTS with the barrier width 27 Å, since the EQW is much deeper than those of RTS’s with the barrier width 30 Å and 35 Å, the coupling between energy levels may lead to a small resonant peak in the I–V curve. This feature means that just after the energy level in the main QW passes that in the EQW and before the EQW disappears, the separation between these two energy levels is small. Thus, the coupling between the energy levels is stronger than those with the barrier width 30 Å and 35 Å. This leads to the second valley of the conductance–voltage characteristic of RTS. As expected, the RTS with the barrier width 27 Å has the deepest second valley among all the RTS’s considered here. Fig. 2(d) shows the inductance–voltage characteristic of the RTSs. The basic features of these curves show that outside of the NDCR, the inductance of the RTS is nearly zero. In the NDCR, there are several valleys and a peak in the curves. The inductance of the devices is related to the time needed for the carriers to pass the devices and the conductance of the devices. Since the inductance is defined by (30), a small conductance and a large lifetime of the electron in the main QW would lead to a large inductance of the device. The negative sign of the inductance is passed on directly from the conductance of the devices. Thus, the sign of the inductance have the same meaning as that of the conductance. Physically, in the NDCR, the velocity of the electrons when bias is in the plateau-like structure region is very low since the conduction state in the system comes from the coupling between the state in the EQW and that in the main QW, both being localized states. Thus, a valley of conductance in this region results. This is the reason for the creation of the valleys at lower bias (for RTS with the barrier width 27 Å). At higher biases, the valleys of inductance–voltage curves are due to the lifetime of electrons which in the quasibound state in the main QW is the longest (the current of the state is the lowest). For a RTS with wider barriers (for example 30 Å or 35 Å), the first valleys are too small to be discernible from this figure. The existence of the valleys shows that the velocity of the electrons in the NDCR is lower than the electron velocity outside the NDCR. It is important to note that there are two valleys in the curves’ corresponding precisely to the two peaks in the C–V curve. This feature may be useful in making voltage-
620
IEEE TRANSACTIONS ON ELECTRON DEVICES, VOL. 48, NO. 4, APRIL 2001
(a)
(c)
(b)
(d)
Fig. 3. Variation of device parameters with the main quantum well widths. (a) Current density, (b) capacitance, (c) conductance, and (d) inductance. The capacitance involves only the contribution of the charges in emitters and collectors.
switched dual-frequency oscillators. This is corresponding to the number of the piece of the curves with NDC in the NDCR in the current–voltage characteristic of RTS. According to this feature, maximum frequency changeable RTD concept may be provided. Fig. 2(d) also shows that the inductance of the RTS with the 27 Å barrier width is much smaller than that of those with wider barriers. B. Effects of Well Width Fig. 3 shows the effects of the main QW width on device parameters. In this subsection, the main QW width is varied to see the effects of well width on device parameters. The rest of the structure parameters are unchanged. Fig. 3(a) gives I–V characteristics of the RTS’. The explanation of this figure can be found
in [18]. Fig. 3(b) shows the capacitance–voltage characteristic of the RTSs. The increase of well width has two important ramifications. The first is the reduction of the length of the doping region that provides the positive charge background. The second is the lowing of the energy level in the main QW. The latter may cause the reduction of the accumulated charges in front of the emitter barrier. This explains the capacitance–voltage characteristics before the bias enters the NDCR. Another feature of the curves is that the bottom of the valleys of the curves shift to lower bias with the increase of the well width. This feature is related to the creation of the EQW. The wider of the main QW, the less the bias needed for the current to pass the peak of the I–V curve. Thus, the EQW will be formed at a smaller bias for a wider main QW. This explains the feature of the C–V
ZHAO et al.: RESONANT TUNNELING DIODES
curve stated above. In the NDCR, since the EQW is deeper for a narrow well, the EQW is difficult to be filled with the increase of the bias. Thus, the narrower the width of the main QW, the deeper the valley of the capacitance–voltage curve. After the bias gets out of the NDCR, the capacitance increases again. Fig. 3(c) shows the characteristic of the conductance–voltage curve for three different well widths. The bottom of the first valleys of the curves shift left with the increase of the well width. This is caused by the lowering of the energy level in the main QW while the well width is increased. For a certain RTS, the distance between the two bottoms of the valleys of the conductance–voltage curve reflects the width of the plateau-like structure of the I–V curve, thereby the coupling strength between the energy level in the EQW and that in the main QW. For the RTS with the well width 60 Å, the position of the first energy level in the main QW is lower than those of the RTSs with well width 40 Å and 50 Å. Thus, the coupling between the energy level in the EQW and that in the main QW is not strong enough, so that the slope of the plateau-like structure of the I–V curve is negative. Hence, the conductance–voltage curve for the RTS with well width 60 Å has just one valley. Comparing Fig. 3(c) to (a), it is easy to understand the two valley feature of the conductance–voltage curves for RTSs with well width 40 Å and 50 Å. Fig. 3(d) shows the variation of inductance of the device with respect to voltage. There are two peaks and one valley in each of the curves. We have explained the formation of the peaks or valleys in the curves in the first subsection of this section. Fig. 3(d) shows that for RTD with larger well width, the conductance is much smaller than those with smaller well width. For understanding this feature, it is helpful to remember that the inductance is determined jointly by and . On the one hand, from Fig. 3(c) we may see that the conductance of the RTD with well width 60 Å is less than that with well width 40 Å but greater than that with well width 50 Å. On the other hand, for the RTD with a larger well width, the position of the quasibound state in the main QW is lower than that with a smaller well width at a certain bias voltage. Thus, the lifetime of the quasibound state in the main QW is greater for the RTD with a larger well width. Fig. 3(d) shows that the nonlinear relation between the inductance and the well width is caused by the relation between the conductance and the well width. C. Effects of Barrier Height In this subsection, the height of barrier is varied to see its effects on device parameters. The rest of the structure parameters are unchanged. Fig. 4(a) gives I–V characteristics of the RTS’. The explanation of this figure can be found in [18]. Fig. 4(b) shows the capacitance of the devices varying with respect to the height of the barriers and the bias. Outside of the NDCR, the capacitance of devices shows an interesting feature. There is a minimum vales of capacitance with respect to the variation of barrier height. With the increase of the height of barriers, the energy level in the main QW lowers. The charges accumulated in front of the emitter barriers will decrease. The height of barriers will also affect the current flow through the device region assisted by the tunneling process. The higher the barriers, the lower the current. Thus, these two factors jointly determine the accumulation of charges in front of the emitter barriers, hence
621
the variation of capacitance outside the NDCR. In the NDCR, the EQW is formed. The net charges are also determined by the strength of the interference of the injected and reflected electron waves, hence the depth of the EQW. We have explained that the EQW is deeper for a RTS with lower barriers. This explains the variation of the capacitance of RTSs in the NDCR. Fig. 4(c) shows the influence of barrier heights on conductance. The basic features of the figure are: Outside the NDCR, the conductance of these RTSs are almost unchanged and the RTS with the lower barrier height has the higher conductance. In the NDCR, the curves have two valleys. The first valleys of the curves are almost coincide with one another. However, the position of the second valleys move right with the decrease of the barrier heights. This may be explained by the fact that the energy level in the main QW lowers while the height of barriers is increased. Fig. 4(d) shows the variation of inductance of the devices with respecttobarrierheightsandbiases.Theinductanceisalmostzero outside of the NDCR. The inductance of the device with the lower height of barriers is much smaller than those with higher height of barriers. The inductance–voltage characteristic have two valleys. The first ones in the low voltage side are very shallow. For RTD with a lower height of barriers, the quasibound state in the main QW will be higher than that with higher barriers. The wavefunction tail will extend more into the barrier region. Thus, the electron may easily pass the well-barrier region of the RTD with lower barrier height hence the lifetime of the quasibound state in the main QW is lower and the inductance is lower. D. Effects of Spacer Width The accumulation of electrons in front of the emitter barrier, or the notch region, greatly affects the function of the RTDs. To find out how the region affects the function of RTDs, the width of the spacer is varied here to study its effects on device parameters. Except the width of spacer, the rest of the structure parameters are unchanged. Fig. 5(a) shows the I–V characteristic of the RTSs. Fig. 5(b) gives the information on how capacitance of the device changes with respect to bias and the width of the spacer. Outside the NDCR, the capacitance of the structures increase linearly. There is a capacitance depression in the NDCR in the capacitance–voltage curves. Since the width of the spacer measures the distance between the doping area and the front edge of the emitter barrier, the greater the width of the spacer, the less the influence of the interference between the injected and the reflected electron waves on the doping region. Thus the net charge in the emitter and collector decreases with the decrease of the width of the spacer, leading to a decrease of the capacitance. Fig. 5(c) shows how the conductance of the device varies with the change of bias and the width of the spacer. Before the bias enters the NDCR, the conductance slowly increase and then decreases. After the bias passes the NDCR, the conductance increases almost linearly. In the NDCR, the curve has two valleys for smaller width of spacers. However, for an RTS with greater width of the spacer, there is only one valley. Since all other structure parameters except the width of the spacer are kept constant, the increase of the width of the spacer would decrease the length of the doping region. Thus, more voltage would be added on the barrier-well region. This sharply lowers the energy level of the QW of the RTS, more so with the smaller spacer than that with
622
IEEE TRANSACTIONS ON ELECTRON DEVICES, VOL. 48, NO. 4, APRIL 2001
(a)
(c)
(b)
(d)
Fig. 4. Variation of device parameters with the barrier height. (a) Current density, (b) capacitance, (c) conductance, and (d) inductance. The capacitance involves only the contribution of the charges in emitters and collectors.
larger width of the spacer. This factor leads, when the width of spacers is reduced, to the left shift of the resonant peak of the I–V curves, hence the left shift of the positions of the valleys of the conductance–voltage characteristic of RTSs. The second valleys of the conductance–voltage curves reflect the changing rate of the current with respect to voltage for the second negative slope part of the curve for smaller width of spacers. The position of the bottoms of the second valleys are determined by the strength of the coupling between the energy level in the EQW and that in the main QW and the depth of the EQW for the RTSs with smaller width of spacers. For the RTS with 40 Å spacer, the spacer is too wide for the interference between the injected and reflected electron waves to be effective since the screening changes the characteristic of the sudden increase of the reflected electron wave after the bias passes the resonant point. Thus, there is only one valley in the conductance–voltage curve of the RTS. The
coincidence of the second valleys for RTSs with smaller width of the spacers and the valley for RTS with larger width of the spacer is the result of keeping all structure parameters (except the spacer width) unchanged. Fig. 5(d) shows the relation between the inductance and the bias and the spacer width. It is easy to see that the inductance of the RTD with smaller width of spacer is lower than those with larger width of spacer. Physically, the spacer provides a notch, or quasiwell, geometry in front of the emitter barrier. Coulomb screening is established when the notch is filled by electrons which end up in the notch due to inelastic scattering by phonons. The thinner the spacer, the fewer electrons are needed to fill the quasiwell. So, under the same external condition, the thinner the spacer, the less effective the screening of the electrons to the applied field. Thus, the position of the energy level in the main QW will be higher for RTD with wider spacer than the RTD with
ZHAO et al.: RESONANT TUNNELING DIODES
623
(a)
(c)
(b)
(d)
Fig. 5. Variation of device parameters with the spacer width. (a) Current density, (b) capacitance, (c) conductance, and (d) inductance. The capacitance involves only the contribution of the charges in emitters and collectors.
smaller width of spacer. The lower energy level in the main QW means that the dwell time of the electron in the main QW is greater. Since the conductance of the RTDs do not vary significantly for different RTDs, the less of the lifetime of the energy level in the main QW, the less of the inductance of the RTDs. The valleys of the curves are related to the negative slope part of the I–V curves. From this figure we may see that the velocity of electron in the bias region of the plateau-like structure of the I–V curve is lower. The lowest value of the velocity of electrons obtains in the bias region just after the current passes the second negative slope part of the I–V curve. E. Effects of Device Temperature Although device temperature is not a structure parameter, it affects the device performance in several important ways. For
example, it can change the coherence of transport and affects the scattering rate. Thus, by studying temperature effects, we may get insight into the effects of scattering on device parameters. Fig. 6(a) shows the current density of device changing with respect to bias and temperatures. Fig. 6(b) shows capacitance of devices varying with respect to bias and temperatures. Outside the NDCR, the capacitance of devices is greater at higher temperatures than that at lower temperatures. At a low temperature and low bias, the capacitance of devices is almost unchanged with respect to temperature. This feature reflects the effects of scattering. Phonon scattering affect the relation between capacitance and bias. Since phonon scattering lead to the dissipation of the electron’s energy and cause electrons in the propagating states entering from the reservoir to fall into the lower-energy notch states. The accumulation of negative charge in the notch
624
IEEE TRANSACTIONS ON ELECTRON DEVICES, VOL. 48, NO. 4, APRIL 2001
(a)
(c)
(b)
(d)
Fig. 6. Variation of device parameters with temperature. (a) Current density, (b) capacitance, (c) conductance, and (d) inductance, with the device temperature as a parameter. The capacitance involves only the contribution of the charges in emitters and collectors.
states screen the electric field in the devices. Thus, the phonon scattering affect the net charge in the devices. The more the negative charges accumulated in the notch states, the less the net charges. That is the way that scattering affect the device capacitance. In the NDCR, the EQW is formed. The rise of the device temperatures may increase the scattering rate, thereby increases the rate of filling the EQW, since the scattering between electrons and phonons tends to dissipate electrons into the EQW. The curves in the NDCR clearly shows the action of scattering. For example, the valley of the capacitance–voltage of RTS at 300 K has become a depression. Fig. 6(c) gives the information on how the conductance of device varies with the changing of temperature and bias. Before the bias enters the NDCR, the curve shows a peak at low temperature. The height of the peak is reduced with the increase of temperature. This feature reflects the effect of electron–phonon
interaction. At a low temperature, the electron–phonon interaction is weak. The number of electrons passing through the device will increase with the increase of bias accompanied by the lowering of the energy level in the main QW. The rapid increase of the current with respect to voltage leads to the peak in the curve. With the increase of device temperature, the electron–phonon interaction will dissipate more and more electrons into the lower-energy notch states. The accumulation of negative charge in the notch states screens the electric field in the devices, slowing down the increase of current with respect to the bias. Thus, the height of the peak is reduced. After the bias passes the NDCR, the conductance increases linearly. In the NDCR, the conductance of the device has two valleys at lower temperature (60 K and 77 K) and just one valley at higher temperature (300 K). The bottoms of the valleys are correlated to the negative-slope part of theI–V curves [see Fig. 6(a)]. The position of
ZHAO et al.: RESONANT TUNNELING DIODES
the bottom of the valley of the conductance–voltage characteristic of the RTS shifts to the right at lower temperatures. The bottoms of the first valleys are related to the first negative-slope part of the curves after the bias passes the resonant point. Since the electron–phonon interaction changes the number of electron in the notch states substantially when the temperature changes from 60 K to 77 K, the resonant bias shifts to the right only slightly. Thus, this figure cannot reflect the difference of the bias value of the bottoms of the first valleys. Since the length of the plateau-like structure of the I–V curve of RTS is related to the depth of the EQW and the strength of the coupling between the energy level in the EQW and that in the main QW, the slower rate of filling the EQW by dissipating electrons into the EQW, accomplished by the electron–phonon interaction, leads to a longer length of the plateau-like structure of the I–V curve at 60 K than that at 77 K. This process shifts the position of the bottom of the second valley of the conductance–voltage curve at 60 K to the right. At higher temperatures, for example, 300 K, the strong electron–phonon interaction fills the EQW quickly once the EQW is created. Thus, the conductance–voltage curve at 300 K has just one sallow valley. Fig. 6(d) shows the variation of inductance of the device at different temperatures. From this figure we may see that the inductance of the device remains almost unchanged outside the NDCR and is almost zero at low temperatures. With the increase of temperature, the inductance of the RTD also increases. At a higher temperature (300K), the amplitude of the inductance of the RTD is almost ten times greater than that at a lower temperature (60K). In the NDCR, the curves have peaks and valleys. The height of the peaks decreases with the increase of temperature and the depths of the valleys increase with the increase of the temperature. Outside the NDCR, increasing the device temperature causes the increase of the number of electrons in the notch of the emitter. This process tends to weaken the effect of the applied field. Thus, the position of the energy level in the main QW is higher at higher temperature than that at a lower temperature. The higher the position of the energy level in the main QW, the shorter its lifetime. With the increase of temperature, conductance of the device becomes smaller and smaller. The dwell time of electron in main QW does not change too much with respect to temperature. That means the conductance of RTD dominates the inductance of the devices. In the NDCR, the decrease of the peak value of inductance with the increase of temperature is caused by the same reason stated above. The increasing of the inductance values of the valleys is caused by the lengthening of the dwell time of electron in the main QW, and the small value of the conductance of RTD at high temperature. V. SUMMARY Based on our numerical simulation results of RTDs, the equivalent circuit parameters of the RTDs have been extracted. The manner in which the structure parameters influence device parameters and its physical reason are systematically discussed. With the variation of structure parameter and device temperature, the variation of the device parameters change according to the
625
following. With the variation of the barrier width, the capacitance of RTDs does not change linearly. The capacitance of RTDs is dominated by the positive charges in the doping regions and the negative charges in the emitter and collector, especially the negative charges accumulated in front of the emitter barrier. There is a valley of C–V characteristic of RTDs with respect to bias. If the width of barrier is less than a certain value (for example, 27 Å) the interference of the injected and reflected electron waves will greatly reduce the negative charge in front of the emitter barrier, hence the capacitance of the RTDs. This provides a mechanism for reducing device capacitance hence increasing the maximum oscillation frequency of RTD oscillators. For a typical RTD, there is a two-valley structure in the conductance–voltage characteristic. These two valleys are related to the two negative-slope parts of the I–V curve of RTSs. Changing the barrier width with respect to the width of barrier 30 Å, the valleys of the curves will shift right. The effects of well width on capacitance of RTDs are mainly exhibited in the NDCR. For less well width, the capacitance of the device decreases greatly in the NDCR. The minimum value of capacitance is about two to four time less than that outside of the NDCR. The two-valley feature of the conductance–voltage characteristic of RTD may be changed by changing the well width of the RTD. Reducing the well width may increase the separation between the two valleys. This is the result of the increase of the coupling strength between the energy level in the EQW and that in the main QW. The inductance of the device is determined by the dwell time of the electrons in the main QW and the conductance of device. Basically, the narrower the well, the shorter the dwell time of electrons in the main QW. However, the conductance of the device changes in a different way inside NDCR from outside NDCR. Thus, the relation among inductance, bias, and the well width should be determined individually. The barrier heights do not affect the one valley nature of the C–V characteristic of RTDs. In NDCR, the lower the barrier height, the smaller the capacitance of the RTDs. This provides another way to decrease the capacitance of RTDs and increase the maximum frequency of RTD oscillators. Barrier height does not affect the two-valley nature of the conductance–voltage characteristic of RTDs. However, the position of the valleys at higher bias and the depth of the valleys may be changed by varying the barrier heights. The lower height of barrier may shift the valley to the right and increase the depth of the valley. The spacer provides a quasiwell structure in front of the emitter barrier. Some of the electrons injected from the reservoir will fill this well and screen the applied field. This effects do not influence the capacitance of the RTD’s significantly outside the NDCR. In the NDCR, the number of electrons in front of the emitter is determined by the interference between the injected and the reflected electron waves. The narrower the spacer, the stronger the influence of the interference, which leads to fewer accumulated negative charges in front of the emitter barrier. Thus, the capacitance of the RTD with a thinner spacer is greater than that with a thicker spacer. The width of the spacer does change the two-valley nature of the conductance–voltage characteristic of the RTS. For wider spacer,
626
IEEE TRANSACTIONS ON ELECTRON DEVICES, VOL. 48, NO. 4, APRIL 2001
there is only one valley. With the increase of the width of the spacer, the separation between the bottoms of the valleys in bias decrease. These features of the curves can be contributed to the positive charges in the doping region, since there are more positive charges in the doping region being affected by the interference between the injected and the reflected electron waves. The inductance increase with the increase of the width of spacer. This is the result of the enhanced screening of the electrons in front of the emitter barrier. Temperature greatly influences the device parameters. At room temperature, the valley in the curve becomes a mere depression. Temperature will increase the capacitance of RTD and adversely affect the oscillation characteristics of the device. At room temperature, the two-valley feature of the conductance–voltage characteristic of RTDs disappears. Device temperature will decrease the voltage interval between the two valleys of the conductance–voltage characteristic of RTDs. A higher device temperature will lead to more electrons to lose energy and be dissipated in front of the emitter barrier. The dissipated electrons accumulate in front of the emitter barrier and screen the external field. As a result, the energy level in the main QW at higher temperature is higher than that at lower temperature and the rate of current density vs bias voltage is lower than that at lower temperature. The lifetime of a higher energy level is shorter than that of a lower energy level. Thus, the inductance of the RTD at a higher temperature is higher than that at a low temperature even in the NDCR. Capacitance of a RTD is a key factor for determining the maximum oscillation frequency of the device. The above discussion shows that to optimize the device to achieve a minimum capacitance of the RTD, the barriers, the main QW, and the spacer of the device should be as narrow as possible and the height of the barriers should be as low as possible.
[10] W. R. Frensley, “Quantum transport calculation of the small-signal response of a resonant tunneling diode,” Appl. Phys. Lett., vol. 51, pp. 448–450, 1987. [11] J. P. Sun et al., “C –V and I –V characteristics of quantum well varactors,” J. Appl. Phys., vol. 72, pp. 2340–2346, 1992. [12] K. Huang et al., “Numerical generated resonant tunneling diode equivalent circuit parameters,” J. Appl. Phys., vol. 76, pp. 3850–3857, 1994. [13] D. K. Ferry and H. L. Grubin, “Modeling of quantum transport in semiconductor devices,” Solid State Phys., vol. 49, pp. 283–448, 1995. [14] F. A. Buot and K. L. Jensen, “Lattice Wely–Winger formation of exact many-body quantum transport theory and applications to novel solid state quantum-based devices,” Phys. Rev. B, vol. 42, pp. 9429–9457, 1990. [15] B. A. Biegel and J. D. Plummer, “Comparison of self-consistent iteration for the Wigner function method of quantum device simulation,” Phys. Rev. B, vol. 54, pp. 8070–8082, 1996. [16] V. J. Goldman, D. C. Tusi, and J. E. Cunningham, “Observation of intrinsic bistability in resonant tunneling structures,” Phys. Rev. Lett., vol. 58, p. 1256, 1987. [17] P. Zhao, N. Horing, and H. L. Cui, “Quantum transport equations for single- and multi-band semiconductors—I: Formulation,” Philos. Mag., vol. 80, p. 1359, 2000, to be published. [18] P. Zhao et al., “Numerical simulation of resonant tunneling structures: Origin of hysteresis and plateau-like structure and dependence of the intrinsic bistability and structural parameters,” J. Appl. Phys., vol. 87, pp. 1337–1349, 2000. [19] F. A. Buot and A. K. Rajagopal, “Theory of novel nonlinear quantum transport effects in resonant tunneling structures,” Mat. Sci. Eng., vol. B35, pp. 303–317, 1995.
Peiji Zhao, photograph and biography not available at the time of publication.
Hong Liang Cui (M’91), photograph and biography not available at the time of publication.
Dwight L. Woolard (S’91–M’92–SM’99), photograph and biography not available at the time of publication.
REFERENCES [1] L. Chang, L. Esaki, and R. Tsu, “Resonant tunneling in semiconductor double barriers,” Appl. Phys. Lett., vol. 24, no. 12, pp. 593–595, 1974. [2] K. L. Jensen and F. A. Buot, “Numerical simulation of intrinsic bistability and high-frequency current oscillations in resonant tunneling structures,” Phys. Rev. Lett., vol. 66, pp. 1078–1083, 1991. [3] W. R. Frensley, “Boundary conditions for open quantum systems driven from equilibrium,” Rev. Mod. Phys., vol. 62, pp. 745–791, 1990. [4] N. C. Kluksdahl, A. M. Kriman, D. K. Ferry, and C. Ringhofer, “Selfconsistent study of the resonant tunneling diode,” Phys. Rev. B, vol. 39, pp. 7720–7735, 1989. [5] T. C. L. G. Sollner et al., “Resonant tunneling through quantum wells at frequencies up to 2.5THz,” Appl. Phys. Lett., vol. 43, pp. 588–590, 1983. [6] J. M. Gering et al., “A small-signal equivalent-circuit model for GaAs–Al Ga As resonant tunneling heterostructures at microwave frequencies,” J. Appl. Phys., vol. 61, pp. 271–276, 1987. [7] E. R. Brown, C. D. Parker, and T. C. L. G. Sollner, “Effect of quasibound-state lifetime in the oscillation power of resonant tunneling diodes,” Appl. Phys. Lett., vol. 54, pp. 934–936, 1989. [8] F. A. Buot and K. L. Jensen, “Intrinsic high-frequency oscillation and equivalent circuit model in the negative differential resistance region of resonant tunneling devices,” Int. J. Comput. Math. Electr. Electron Eng., vol. 10, no. 4, pp. 241–253, 1991. [9] R. K. Mains and G. I. Haddad, “Time-dependent modeling of resonanttunneling diodes from direct solution of Schrödinger equation,” J. Appl. Phys., vol. 64, pp. 3564–3573, 1988.
Kevin L. Jensen (M’88) was born in Salt Lake City, UT, in 1959. He received the B.S. degree in applied physics from Columbia University, New York, in 1981, and the M.S. and Ph.D. degrees in physics from New York University in 1984 and 1987, respectively, where he worked on Monte Carlo lattice gauge theories and (for his doctorate) statistical mechanics of fermions with hard-sphere interactions. In 1987, he joined the Naval Research Laboratory as an NRC Post-Doctoral Researcher, and in 1989 as an ONR post-doc in the Semiconductors Branch of the Electronics Science and Technology Division (ESTD), for work on quantum transport in resonant tunneling diodes. In 1990, he joined the Theory Section of the Vacuum Electronics Branch in ESTD, for work on field emission, emission properties of electron sources (in particular, field emitter arrays), and analyses of emission-gated amplifiers. He served as Program Manager for Vacuum Microelectronics from 1994 to 1997 and for the Advanced Emitter Technology Program since 1997, and worked on the physics and application of novel cathodes for power tube amplifiers. He has a patent, a publication award, and over 45 refereed publications. His research interests are in field and thermionic emission, quantum transport, and electron device physics. Dr. Jensen is a member of the American Physical Society, the New York Academy of Sciences, and the Materials Research Society.
ZHAO et al.: RESONANT TUNNELING DIODES
F. A. Buot (SM’84) received the M.S.E.E. degree from Stanford University, Stanford, CA, and the Ph.D. degree in theoretical solid-state physics from the University of Oregon, Eugene. He has been awarded several postdoctoral fellowships and research associateships in major institutions in Europe, Canada, and the U.S. He is a Research Physicist at the U.S. Naval Research Laboratory (NRL), Washington, DC. He has about 200 research publications and conference presentations. He is a member of the Editorial Board of Transport Theory and Statistical Physics (New York: Basel) and the Philippine Journal of Science (Manila). Dr. Buot has served in the Technical Program Committees of the IEEE International Electron Devices Meetings. He has been serving as member of the International Advisory Committee of the International Workshop on Computational Electronics: IWCE-7, Glasgow, U.K., May 22–25, 2000; IWCE-6, Osaka, Japan, Oct. 19–21, 1998; IWCE-5, Notre Dame, IN; May 28–30, 1997; IWCE-3, Portland, OR, May 18–20, 1994; IWCE-2, University of Leeds, UK, Aug. 11–13, 1993; IWCE-1, Beckman Institute, Urbana, IL, May 28–30, 1992. He is a member of the Executive Committee, American Society for Engineering Education (ASEE), Washington, DC, and on the Technical Advisory Committee, MURI Program, U.S. Army Research Office. He was a Plenary Speaker, First International Conference on Low Dimensional Structures and Devices, Singapore, May 8–10, 1995, and a Course Lecturer, Workshop on Computational Electronics, Beckman Institute, Urbana, IL, May 21–24, 1990. He served as a UNDP Consultant (1993 and 1996) at the University of the Philippines. He was the President of the Philippine–American Academy of Science and Engineering, Inc. (PAASE) and currently serving as a member of the PAASE Board of Directors. He has been awarded NRL Alan Berman Research Publication Awards, March 1991 and March 1995. He was elected Fellow of the Washington Academy of Sciences.
627