Multi-Baseline Polarimetric SAR data Classification using the Complex Wishart Distribution and Principal Component Analysis L. Ferro-Famil (1), A. Reigber (1), E. Pottier (1), W. M. Boerner (2) (1) The University of Rennes, A. R. T. Laboratory, FRE CNRS 2272, Radar Polarimetry Division Campus de Beaulieu - Bat 22, 263 Avenue General Leclerc, CS 74205, 35042 Rennes Cedex, France Ph/Fax : (+33) 2 99 28 67 09 / (+33) 2 99 28 69 63 E-mail :
[email protected] (2) UIC-EECS Communications, Sensing & Navigation Laboratory 900 W. Taylor St., SEL (607)W-4210, M/C 154, CHICAGO IL/USA-60607-7018 Ph & Fax: (+1) 312 996 5480 Email:
[email protected] Abstract - In this paper is introduced a classification approach for multi-baseline polarimetric interferometric SAR data sets, based on a principal component analysis of coherent scattering vectors. From the Wishart probability density function of a restricted data set, is defined a maximum likelihood decision rule to perform an iterative adaptive classification.
I. INTRODUCTION Recently, the introduction of polarimetric techniques in interferometric applications has shown to improve significantly the performance of conventional SAR interferometry [1]. Since several different scattering effects from different heights are mixed in a resolution cell, a reliable inversion is not always possible, even using multifrequency and polarimetric data. The capability of SAR tomography to resolve the back-scattering contributions coming from different heights can be used to improve the inversion of geo-physical parameters in SAR imaging [2]. In this paper is presented an approach to multi-baseline polarimetric interferometric SAR data classification. This classification process consists of two major steps. A principal component analysis procedure aiming to define an efficient feature vector is introduced in section II. This vector has to present a moderate number of elements, while highlighting the main part of the data set information. The polarimetric information associated to a pixel in several interferometric images is represented under the form of a 3N element target vector , ks, obtained by stacking the target vectors of the N SAR images. A Minimum Description Length (MDL) criterion permits, using an eigenvalueeigenvector decomposition of the (3N×3N) coherency matrix of ks, TGs, to define in an unsupervised way a (R×3N) transformation matrix, P, leading to the definition of a reduced size target vector kr with R elements. This vector describes the scene in a more efficient way and permits us to use an iterative unsupervised classification procedure. Section III deals with the classification of the reduced data set in order to segment in an unsupervised way the observed scene. The reduced target vector kr is known to follow a complex multivariate normal probability density function
involving that its coherency matrix, Tr, posseses a complex Wishart probability density function. The transformed polarimetric multi-baseline interferometric images are classified using an unsupervised approach relying on a maximum likelihood decision rules based on the complex Wishart probability density function of the coherency matrix Tr [3-6]. Pixels are iteratively segmented using a k-mean algorithm in order to separate clusters according to the joint coherent information contained in the several multi-baseline images. The classification scheme is applied to multi-baseline full polarimetric interferometric SAR (POL-In-SAR) data acquired by DLR ESAR airborne sensor at L band over the Oberpfaffenhofen site (Germany). II. PRINCIPAL COMPONENT ANALYSIS OF POL-In-SAR DATA The polarimetric coherent information may be represented for each pixel of an image under the form of a 3 element complex target vector, k. The global multi-baseline polarimetric coherent information is contained in a 3N complex element target vector, ks, obtained by stacking the different image target vectors and leads to the definition of a (3N × 3N ) coherency matrix, Ts, as follows:
Ts = k s k †s
[
with k s = k 1T , L , k TN
]
T
(1)
where k1 and kN represent the target vectors from respectively image 1 an N. The global coherency matrix TGs is obtained by performing an averaging over the whole observed scene. An eigenvectoreigenvalue decomposition of TGs permits to define a set of 3N orthogonal complex unitary vectors oriented accordingly to the polarimetric data distribution over the 3N image data set. TGs = U Gs Σ Gs U †Gs with Σ Gs = diag(λ 1 , L , λ 3 N ) λ 1 ≥ L ≥ λ 3 N (2) The eigenvalues represent the power associated to the related eigenvector or multi-baseline scattering mechanism. In [7] is presented a Minimum Description Length (MDL) criterion which permits to decrease the dimensionality of the data set by defining the minimum number of eigenvalues required
0-7803-7033-3/01/$17.00 (C) 2001 IEEE
to preserve the main part of the radar image information. This criterion relies on the ratio of the eigenvalue geometrical and arithmetic means and has the following form [7] : 1 ö æ 3N ç ∏ λ (3N −r ) ÷ i ÷ ç MDL(r ) = − logç i = r +1 3 N ÷ (3) 1 ç (3 N − r ) å λ i ÷ ÷ ç i = r +1 ø è This criterion assumes that the less important eigenvalues possess close numerical values. The geometrical and arithmetic means are then very similar and lead to a minimal value for the MDL variable. A study of the variation of the MDL with respect to r permits to find the minimum number of eigenvalues, R, which efficiently describe the whole data set information. This restricted information may then be represented under the form of a R complex element target vector, kr, obtained from a projection of ks on a transformation matrix P : k r = P k s with P = [u 1 , K , u R ] T (4) The (R × 3N) transformation matrix P is composed of the R first column vectors of Us.
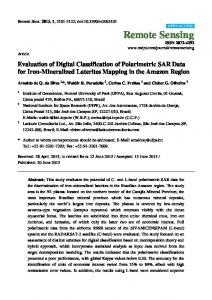
algorithm using the maximum likelihood decision rule defined in (6). We propose to initialize the class distribution using the results of the unsupervised H-A-α Wishart classification into 16 classes [3] applied to one of the separate images. This classification combines a single image unsupervised Wishart classifier and the polarimetric anisotropy information to give a high number of classes depicting the different types of natural medium. IV. APPLICATION TO POL-In-SAR DATA The Principal Component Analysis and the unsupervised classification are applied to multi-baseline POL-In-SAR data sets acquired at L band by the DLR ESAR airborne sensor over Oberpfaffenhofen (Germany) with a baseline varying from 7 m up to 30 m. The MDL criterion defined in (3) gives on these particular data sets a restricted space relevant dimension equal to 6. In fig.1 is shown a color coded image of the Oberpfaffenhofen test site obtained from the diagonal elements of the coherency matrix of one of the images in the horizontal vertical polarization basis. The scene contains various types of media such as high and short forests, agricultural fields, grassland, urban areas and an airport runway.
III. UNSUPERVISED CLASSIFICATION SCHEME A. Restricted coherency matrix statistics It has been verified that when the radar illuminates a random surface area of many elementary scatterers, the coherent scattering vector, ks, can be modeled as having a zero mean multivariate complex Gaussian probability density function N C (0, Σ) , with Σ the covariance matrix of ks . The n-look coherency matrix, Ts, follows a complex Wishart probability density function, WC (n, Σ Ts ) , with n degrees of freedom and
covariance matrix Σ Ts = Σ / n , defined by :
p(Ts ) =
Ts
n −3 N
exp(− tr ( Σ −Ts1 Ts )
K (n,3N) Σ Ts
(5)
n
where K (n,3N) is a constant term. It can be shown that the restricted target vector (R × R ) coherency matrix, Tr also follows a complex Wishart probability density function with R degrees of freedom, WC (R , PΣ Ts P † ) . From this probability density function, it is possible to define a Bayes maximum likelihood classifier [3-6] which assigns the coherency matrix of a pixel of the SAR image to the class Χ m if d 1 (Tr , Χ m ) ≤ d 1 (Tr , Χ j ) ∀j ≠ m with : d 1 (Tr , Χ m ) = ln Σ m + tr ( Σ m−1 Tr )
(6)
where Σm is the mean covariance matrix for the class Χ m . B. Maximum likelihood classification procedure The classification of the interferometric SAR data set is realized by the way of an iterative k-mean clustering
Fig. 1. Color coded image of the Oberpfaffenhofen test site in the H-V polarization basis (top), in the restricted space basis (bottom)
0-7803-7033-3/01/$17.00 (C) 2001 IEEE
The equivalent images built with the first three and the last three diagonal elements of the restricted coherency matrix, Tr are shown at the bottom of Fig. 1. Substantial differences may be observed. The restricted data set images present an higher contrast between their different channels. Agricultural areas look more homogeneous and point scatterers or human made targets can be easily discriminated.
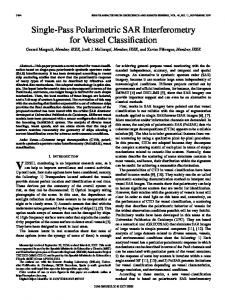
In fig. 2. are represented the results of the unsupervised H-Aα Wishart and maximum likelihood classifications. It can be observed that the first classification method which was applied to a single image provides a good segmentation of the site. Nevertheless, the second technique, based on the use of several images performs significantly better results. The different characteristics of the observed scene are segmented into compact classes, the accuracy in the scene description is increased. The Principal Component Analysis technique permits to retrieve some important features. V. CONCLUSION In this paper is presented a classification schemes for several polarimetric SAR images that can be used in the multi-baseline case. A Principal Component Analysis provides a restricted data set which contains the main part of the global polarimetric information. A statistical classification method is presented based on a maximum likelihood decision rule derived from the data Wishart probability density. The classification results show a neat improvement in the segmentation accuracy and scene description. An application of this method to the case of multi-squint images will be presented during the symposium. REFERENCES
C1
C2
C3
C4
C5
C6
C7
C8
C9
C10
C11
C12
C13
C14 C15
C16
[1] S. R. Cloude, K. P. Papathanassiou "Polarimetric SAR Interferometry", IEEE Trans. Geosc. Rem. Sen., vol. 36, 5, 1998. [2] A. Reigber, A. Moreira, "First Demonstration of Airborne SAR Tomography using Multi-baseline L-Band Data", IEEE Trans. Geosc. Rem. Sen. , vol. 38, 5, 2000 [3] E. Pottier, J.S. Lee"Unsupervised classification scheme based on the complex Wishart Distrtribution and the H-Aalpha polarimetric decomposition theorem", EUSAR, Munich, germany, 2000 [4] L. Ferro-Famil, "Multi-temporal and multi-frequential remote sensing of natural environments using polarimetric SAR data", Ph. D Thesis, Univ. Nantes, France, 2000. [5] L. Ferro-Famil, E.Pottier, "Dual frequency polarimetric SAR data classification and analysis" Progr. In Electromag. Research, PIER 14, pp.251-276, 2001. [6] L. Ferro-Famil, E. Pottier, J. S. Lee, "Unsupervised Classification of Multi-frequency and fully Polarimetric SAR Image based on The H/A/alpha - Wishart Classifier", IEEE IGARSS'00, Hawaii USA, July 2000. [7] Wax, Ziskird, "Detection of the number of signals by MDL principle", IEEE Trans. ASSP, vol. 37, 8, 1989.
Fig. 2. Wishart H-A-α classification results (top) Maximum likelihood classified image (bottom)
0-7803-7033-3/01/$17.00 (C) 2001 IEEE