I NTERNATIONAL J OURNAL OF C HEMICAL R EACTOR E NGINEERING Volume 7
2009
Article A3
Experiment and CFD Simulation on Gas Holdup Characteristics in an Internal Loop Reactor with External Liquid Circulation Chunxi Lu∗
Nana Qi†
Jiaqi Jin∗∗
∗
Kai Zhang‡
Hu Zhang††
China University of Petroleum,
[email protected] China University of Petroleum,
[email protected] ‡ China University of Petroleum,
[email protected] ∗∗ China University of Petroleum,
[email protected] †† Keele University,
[email protected] ISSN 1542-6580 c Copyright 2009 The Berkeley Electronic Press. All rights reserved. †
Experiment and CFD Simulation on Gas Holdup Characteristics in an Internal Loop Reactor with External Liquid Circulation∗ Chunxi Lu, Nana Qi, Kai Zhang, Jiaqi Jin, and Hu Zhang
Abstract An external liquid circulation is introduced into a traditional internal loop reactor in order to improve liquid circulation and increase the interface between gas and liquid phases. The effects of superficial gas velocity and external liquid circulation velocity on local and overall gas holdups are explored experimentally and numerically in the loop section of a combined gas-liquid contactor, which consists of a liquid spray, sieve plates and an internal loop with external liquid circulation. Local gas holdup is measured experimentally by a double-sensor conductivity probe. Numerical simulations are conducted in the platform of a commercial software package, ANSYS CFX 10.0. Gas holdup and other information are obtained by solving the governing equations of mass and momentum balances for gas and liquid phases in a hybrid mesh system. Both measured and simulated results indicate that local, section-averaged, and overall gas holdups increase with an increase of the superficial gas velocity. The downcomer tube for circulating external liquid has a significant influence in the gas-distributor and the downcomer-tube action regions rather than in the upper draft-tube and the gas-liquid separation regions. Good agreement between measured and predicted data suggests that CFD simulation together with experimental investigation can be employed to develop novel gas-liquid contactors with a complex geometrical configuration. KEYWORDS: internal loop reactor, external liquid circulation, gas holdup, experimental investigation, CFD simulation
∗
Correspondence for this article may be sent to Kai Zhang, Tel: 0086 10 89733939, E-mail:
[email protected]. Financial support from the Major State Basic Research Development Program of China (973 Program, 2005CB221205), National Natural Science Foundation of China (No.20676147) and 111 Project of the Ministry of Education is gratefully acknowledged.
Lu et al.: Experiment and CFD Simulation
1
1. INTRODUCTION Internal loop reactors have been widely used in chemical and other related processes because of their excellent mass transfer and easy operation. Gas-phase properties, such as local gas holdup, overall gas holdup and bubble movement characteristics, strongly affect heat and mass transfer and reaction rates. Therefore, gas holdup was investigated experimentally in the traditional internal loop reactors by many researchers (Merchuk et al., 1981; Dhaouadi et al., 1996; Letzel et al., 1999; Freitas et al., 1999, 2000). To meet the requirement of slow chemical reaction, such as Fischer-Tropsch and methanol syntheses, several modified configurations of loop contactors were proposed (Lo et al., 2003; Zhang et al., 2003; Sun et al., 2006; Zhang and Zhao, 2006; Zhao et al., 2007). A novel combined reactor was developed in our laboratory, which includes a liquid spray section in the upper part, sieve plates section in the middle part, and an internal loop section in the lower part (Lu et al., 2004). Liquid is dispersed by the spray and then rearranged in the sieve plates section, which increases greatly the interface between the gas and liquid phases. External liquid circulation is introduced by a downcomer tube, which enhances the drive force arising from the pressure difference between the riser and the annular regions and prolongs gas residence time for slow reaction. Even up to now, the design practice for the gas-liquid reactor is still closer to technology than science after more than half century of research because of the complexity of fluid mechanics. However, significant improvements of design capability and reliability of the hydrodynamics in gas-liquid system were expected from advances in computational fluid dynamics (CFD) simulation techniques (Krishna et al., 1999; Blažej et al., 2004; Chen et al., 2005; Dhotre and Joshi, 2007). The aim of this study is to investigate local, section-averaged and overall gas holdups in the loop section of this combined reactor by using experimental measurements accompanied with CFD simulations.
2. EXPERIMENTAL SET-UP The experimental apparatus is schematically shown in Fig. 1. This combined reactor made of Plexiglas is 3.000 m in height and 0.286 m in inner diameter (I.D.), which consists of three sections, i.e., spray section, sieve plates section, and loop section. A draft tube of 0.186 m I.D. with a height of 1.000 m and a downcomer tube of 0.042 m I.D. are installed in the center of the reactor. The distance between the bottom of the downcomer tube and the top of the draft tube is 0.480 m. An annulus gas distributor is installed centrally at 0.130 m above the bottom of the draft tube. Air and tap water are used as the gas and liquid phase, respectively. The amount of water filled in the reactor is maintained at a height of 0.100 m
Published by The Berkeley Electronic Press, 2009
2
International Journal of Chemical Reactor Engineering
Vol. 7 [2009], Article A3
above the top of the draft tube. Air is fed into the loop section through the gas distributor and the gas volume flux is controlled by a gas rotameter. Liquid is circulated by a pump and the liquid volume flow rate is measured by a liquid rotameter. The superficial gas velocity varies from 0.0059 m/s to 0.1895 m/s, and the external liquid circulation velocity is set at 0.03 m/s or 0.05 m/s. Both the superficial gas velocity and the liquid circulation velocity are calculated from the volume flow rate through the cross-sectional area of the draft tube. A double-sensor conductivity probe is employed to measure the local gas holdup in the loop section. This probe can move flexibly so that gas bubble properties can be characterized at different axial and radial positions.
Fig.1 Schematic diagram of the experimental apparatus
3. SIGNAL PROCESSING Local gas holdup can be calculated from signals obtained at the up-stream tip of the double-sensor conductivity probe, which is shown in Fig.2. When a bubble rises through the probe as shown in Fig. 2a, the up-steam tip penetrates the bubble surface and a sharp rise of the signal is generated (Fig. 2b) due to a change in the
http://www.bepress.com/ijcre/vol7/A3
Lu et al.: Experiment and CFD Simulation
3
electrical conductivity as the bubble replaces water on the tip. The local holdup is defined as the ratio of the duration time of the probe in a gas bubble to the total sampling time. Since the original signals generated by the probe are not in an ideally rectangular shape (Fig. 2b), a dual-threshold method is used to transform the measured signals to a standard rectangular shape in Fig. 2c, which is based on a rate of signal change with time as follows:
V lth = V li + α (V hi − V li )
(1)
V hth = V li + (1 − α )(V hi − V li )
(2)
Fig.2 Schematic diagram of the dual thresholds method
where, Vlth stands for the low threshold and Vhth for the high threshold. Vli and Vhi are the lowest voltage and highest voltage of the ith bubble signals from the up-steam probe, respectively. α is an adjustable parameter, which is set as 0.1 according to the suggestion by Wang et al. (2001). Therefore, local gas holdup can be calculated from Fig. 2c by:
εg = ∑ τ
ti
(3)
where, ti is the residence time of the ith bubble passing through up-steam tip of the probe, and τ is the sampling period. The section-averaged gas holdup is thus given by:
Published by The Berkeley Electronic Press, 2009
International Journal of Chemical Reactor Engineering
4
n
ε g,A =
∑ε i =1
g, j
⋅ Aj (4)
n
∑A i =1
Vol. 7 [2009], Article A3
i
where, A is the cross sectional area. The overall gas holdup in the loop section is as below: n
ε g ,V =
∑ε i =1
g, j
⋅ Voli (5)
n
∑Vol i =1
i
where, Vol stands for the volume.
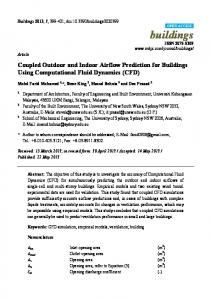
4. NUMERICAL METHOD 4.1 Physical model and mesh topology Fig.3 shows the physical configuration and mesh topology of the loop section of the experimental set-up. Two kinds of mesh topologies, i.e., unstructured mesh and structured mesh, are used for the numerical simulation. Generally, the unstructured mesh system is relatively easy to be implemented in the CFX 10.0. However, numerical dispersion and computer resource must be taken into consideration for dealing with complex geometrical configuration. Although fewer meshing cells required for the structured mesh than the unstructured mesh can decrease numerical dispersion and increase calculation speed, the structured mesh is quite difficult to capture the details of complex geometry, such as the distributor with many small holes, which possibly results in unreal information for engineering designs. Accordingly, a hybrid mesh technique shown in Fig.3b is employed in this study. The unstructured mesh is used to manage the lower part of the reactor with complicated configuration of the gas distributor, while the structured mesh for the rest. Both meshes are merged at the interface as shown in Fig. 3d. For the structured mesh, a heterogeneous grid size is chosen to capture the effects of equipment design in detail: finer mesh within and near the draft tube as well as near the walls while coarser mesh for other zones in the loop section (Figs. 3b and 3c).
http://www.bepress.com/ijcre/vol7/A3
Lu et al.: Experiment and CFD Simulation
5
gas outlet
downcomer tube
draft c. enlarged local meshes interfa liquid
gas
d. enlarged local meshes in the interface
liquid a.
physical
b. mesh topology
Fig.3 Schematic diagram of physical model and mesh topology
4.2 Mathematical models In the present work, an Eulerian-Eulerian two-fluid model is employed, where gas and liquid phases are treated as continua, interpenetrating and interacting with each other in the computational domain. The pressure field is assumed to be shared by both two phases, in proportion to their volume fraction. The motion of each phase is governed by corresponding mass and momentum conservation equations.
Published by The Berkeley Electronic Press, 2009
International Journal of Chemical Reactor Engineering
6
Vol. 7 [2009], Article A3
Continuity equation: r ∂ (φi ρi ) + ∇ ⋅ (φi ρiui ) = 0 ∂t
(6)
r where φ , ρ and u stand for the volume fraction, density and velocity vector, respectively. The subscript i stands for gas or liquid phase. Momentum equation: r r rr r r r ∂ (φi ρ i ui ) + ∇ ⋅ (φi ρ i ui ui ) = −φi ∇Pi + ∇ ⋅ (φi μi (∇ui + (∇ui )T )) + Fi + φi ρ i g ∂t
(7)
where P, μ, and g are the pressure, viscosity and gravity acceleration, respectively. Fi is the interfacial force acting on phase i due to the presentce of the other phase, j. Virtual mass and lift forces could be ignored in comparison with drag, buoyancy and turbulent dispersion forces (Wiemann et al., 2005; Bothe et al., 2007; Bartrand et al., 2008; Panneerselvam et al., 2008). Accordingly, the interfacial forces of great significance are assumed to be drag force and interphase turbulent dispersion force in this study:
r r r Fi = Fi D + Fi T
(8)
r r where Fi D is the interfacial force due to drag, and Fi T is the interfacial force due to turbulent dispersion. The drag component of the interfacial force term is given by: r r r r r C Fi D = D Aij ρ i u j − ui (u j − ui ) 8
(9)
where CD is a drag force coefficient, Aij is the net interfacial area between the two phases. The Grace relation is chosen for the drag force coefficient because bubbles are observed to be elliptical and dispersed. The drag force coefficient (Clift et al., 1978; ANSYS Inc., 2005) is:
http://www.bepress.com/ijcre/vol7/A3
Lu et al.: Experiment and CFD Simulation
CD =
7
4 gd b Δρ 3 uT2 ρl
(10)
where db stands for the mean bubble diameter, Δρ is the difference in density between the liquid and gas phases, and uT is the bubble terminal rise velocity, it can be calculated by:
uT =
μl M −0.149 ( J − 0.857) ρl db
(11)
In the bubble terminal velocity expression, M is the Morton number (a fluid property) given by:
M=
μ l4gΔρ ρl 2σ 3
(12)
where σ is surface tension and J is given by: J = 0.94 H 0.751 J = 3.42 H 0.441
2<H≤59.3
(13)
H>59.3
(14)
In Eqs.(13 ) and (14), H is calculated by:
H=
μ 4 Eo M − 0.149 ( l ) − 0.14 3 μref
(15)
where, μref is the molecular viscosity of tap water under a reference temperature and pressure (ANSYS Inc., 2005). Eo stands for Eotvos number as below: Eo =
gΔρd b2
σ
(16)
r The turbulent dispersion force, Fi T , is calcuated by the model of Lopez de Bertodano (1991):
Published by The Berkeley Electronic Press, 2009
International Journal of Chemical Reactor Engineering
8
r ν ∇φ ∇φ Fi T = CTD CD tl ( g − l )
σ tl
φg
φl
Vol. 7 [2009], Article A3
(17)
where, CTD is the momentum transfer coefficient for the interphase drag force, CD stands for drag force coefficient (described above), ν tl for turbulent viscosity, and σ tl for liquid turbulent Schmidt number. φ g and φl are the gas and liquid phase volume fraction, respectively. The standard k–ε model is chosen for simulating liquid phase, which can be obtained as follows:
⎡ ⎤ r ∂ μ (φl ρl kl ) + ∇ ⋅ (φl ρl ul kl ) = ∇ ⋅ ⎢φl ( μl + tl )∇kl ⎥ + α l Pl − α l ρl ε l ∂t σk ⎣ ⎦
(18)
⎡ ⎤ r ∂ μ ε ( ρlφl ε l ) + ∇ ⋅ (φl ρl ulε l ) = ∇ ⋅ ⎢φl ( μl + tl )∇ε l ⎥ + α l l (Cε 1 pl − Cε 2 ρlε l ) (19) ∂t σε kl ⎣ ⎦ where, Cε1, Cε2, Cμ, σk, and σε are parameters in the standard k–ε model and the following values are selected: Cε1 = 1.45, Cε2 = 1.9, Cμ= 0.09, σk = 1.0, and σε= 1.3. The liquid phase turbulent viscosity is modeled using the Sato enhanced turbulence model (Sato and Sadatomi, 1981), given in the following equation:
μtl = μtl , s + μtl ,b
(20)
where μ tl , s is the conventional shear-induced turbulent viscosity, which is obtained by the standard k–ε model as:
μtl , s = Cμ ρl
k2
(21)
ε
μ tl b ,is a bubble-induced component of turbulent viscosity given by: r
r
μ tl ,b = C μ ,b ρ l φ g d b u g − u l
(22)
The gas phase turbulence is modeled using a zero equation model in which gas turbulent viscosity is proportional to liquid phase turbulent viscosity (ANSYS Inc., 2005; Bartrand et al., 2008):
http://www.bepress.com/ijcre/vol7/A3
Lu et al.: Experiment and CFD Simulation
μ tg =
ρ g μ tl ρl σ t
9
(23)
where σt is a turbulent Prandtl number relating the dispersed phase kinematic eddy viscosity μ tg to the continuous phase kinematic eddy viscosity μtl . 4.3 Solution method Boundary conditions, initial conditions and iteration scheme are set for the numerical simulations in the ANSYS CFX 10.0 software package. At the gas and liquid inlets, gas and liquid velocities are set according to the experimental input. At the liquid outlet, liquid velocity is equal to the experimental data. At the gas outlet, the degassing condition in the CFX 10.0 is used for the gas phase. Along the walls, gas and liquid are treated as free-slip and no-slip, respectively. Initially, the reactor is filled with liquid, whose velocity vector is set as zero. The implicit first order upwind scheme is selected as the iteration scheme.
5. RESULTS AND DISCUSSION 5.1 Flow regions Flow characteristics of liquid phase shows great difference in certain regions of the loop section. Airlift loop reactor is generally divided into an external loop (or annular region), an internal loop and a gas-liquid separation region. Recently, Liu et al. (2005) subdivided the loop section into a bottom region, a gas-distributor action region, a downcomer-tube action region, and an upper draft-tube region based on the geometrical configuration and flow characteristics in each region (see Fig. 4). As a typical example, Fig.5 presents the simulated sectional profile of liquid phase velocity when the superficial gas velocity is 0.00671 m/s and the external liquid circulation velocity is 0.05 m/s. It is clear that liquid moves down in the downcomer tube with high velocity and in the annular region with relatively low velocity, whilst it flows up in the upper draft-tube action region and the gas-distributor action region. Local or overall liquid circulations appear in the downcomer-tube action and the gas-liquid separation regions.
Published by The Berkeley Electronic Press, 2009
10
International Journal of Chemical Reactor Engineering
Vol. 7 [2009], Article A3
Fig.4 Schematic diagram of regions and axial positions for measurement in the loop section
Fig.5 Sectional profiles of the liquid phase velocity vectors
http://www.bepress.com/ijcre/vol7/A3
Lu et al.: Experiment and CFD Simulation
11
5.2 Radial distribution of local gas holdup The radial distribution of local gas holdup is affected by the operating conditions including the superficial gas velocity and the external liquid circulation velocity. Fig. 6 shows experimental and numerical radial distributions of local gas holdup in six regions at different superficial gas velocities, while keeping an external liquid circulation velocity of 0.03 m/s. Solid and dotted lines denote experimental data and simulated predictions, respectively. As shown in Fig 6a to Fig 6e, all gas holdups increase at any radial position of six different regions when the superficial gas velocity is increased. However, some variation can be found in different regions. Therefore, they are discussed in six regions separately. In the bottom region (Fig. 6a), the gas holdup is mainly contributed from gas bubbles brought by circulation water from the external loop to the internal loop, but it is much lower than that in the external loop (Figs. 6b to 6e) under the same superficial gas velocity. This indicates a majority of bubbles in the external loop escape from the gas-liquid separation region located at the top of the loop section, and only few gas bubbles return to the internal loop leading to lower gas holdup in the bottom region. In the gas-distributor action region (Fig. 6b), the gas holdup at around r/R from 0.3 to 0.5, located above the gas jet zone, is much higher than that in the other positions. The observation suggests the size of the gas jet zone is greatly affected by the gas distributor design. In the downcomer-tube action region (Fig.6c), the distribution of radial gas holdup indicates that the mixing between gas and liquid is greatly improved by installing a downcomer tube inside the traditional internal loop reactor. In the upper draft-tube region, the influence of either the distributor or the downcomer tube becomes much weak (Figs. 6d and 6e). The gas holdup in the center is higher than that near wall, which is similar as that in a traditional bubble column (Zhang and Zhao, 2006). In the gas-liquid separation region (Fig. 6f), the gas holdup above the internal loop is higher than that above the external loop because most gas bubbles directly move out of the loop section through the gas-liquid separation region. In the annular region (external loop), gas holdup decreases with a decrease in axial height from Fig. 6e to Fig. 6b. Furthermore, at the same axial height, it is much lower than that in the corresponding sections of the internal loop (Figs. 6b to 6e). Even no bubble can be detected by the double-sensor conductivity probe in this region when the superficial gas velocity is low.
Published by The Berkeley Electronic Press, 2009
International Journal of Chemical Reactor Engineering
12
0 .0 0 8
g as en try tu b e
H1
d raft tu be
0 .0 0 6
εg
0 .0 0 4
0 .0 0 2
0 .0 0 0 0 .0
0 .2
0 .4
0 .6
0 .8
1 .0
r/R c (-)
(a) 0 .2 5
d raft tube
H2
0 .2 0
εg
0 .1 5
0 .1 0
0 .0 5
0 .0 0 0 .0
0 .2
0 .4
0 .6
0 .8
1 .0
r/R c (-)
(b) 0 .3 5
0 .3 0
draft tube H3
0 .2 5
εg
0 .2 0
0 .1 5
0 .1 0
0 .0 5
0 .0 0 0 .0
0 .2
0 .4
0 .6
0 .8
r/ R c (-) (c)
http://www.bepress.com/ijcre/vol7/A3
1 .0
Vol. 7 [2009], Article A3
Lu et al.: Experiment and CFD Simulation
13
0 .2 5
H4 0 .2 0
d o w n co m er d raft tu be tu b e
εg
0 .1 5
0 .1 0
0 .0 5
0 .0 0 0 .0
0 .2
0 .4
0 .6
0 .8
1 .0
0 .6
0 .8
1 .0
0.6
0.8
1.0
r/R c (-)
(d) 0 .2 5
H5 0 .2 0
dow ncom er tu b e
d ra ft tu b e
εg
0 .1 5
0 .1 0
0 .0 5
0 .0 0 0 .0
0 .2
0 .4
r / R c (-)
(e) 0.25
H6 0.20
dow ncom er tube
εg
0.15
0.10
0.05
0.00 0.0
0.2
0.4
r/ R c (-) (f) Fig.6 The radial distributions of gas holdup at the different axial positions, Ucir =0.03m/s ■0.0059 ●0.0310 ▲0.0671 ▼0.1895; Experimental Ug (m/s): Simulated
Ug (m/s):
□0.0059
○0.0310
△0.0671 ▽0.1895
Published by The Berkeley Electronic Press, 2009
International Journal of Chemical Reactor Engineering
14
Vol. 7 [2009], Article A3
Numerical predictions of radial distribution of gas holdup obtained from the same operational conditions as experimental measurements are found to be in good agreement with experimental data in all six regions as shown in Fig. 6a to Fig. 6f, although variation between numerical and experimental results can be seen in the gas-distributor and the downcomer-tube action regions (see Figs 6b and 6c). In general, the multiphase model assuming turbulent flow for both gas and liquid phases can be used for predicting the local gas holdup in gas-liquid loop reactor. 5.3 Axial distribution of the section-averaged gas holdup (SAGH) The homogeneity of sectional gas holdups along the axial direction is one of important parameters for estimating the flow pattern in gas-liquid contactors. The influences of the external liquid circulation velocity and the superficial gas velocity on the axial section- averaged gas holdup (SAGH) distributions in both the internal and external loops are investigated as below. Fig 7 presents . the experimental and numerical SAGH distributions in the internal loop at an external liquid circulation velocity of 0.03 m/s. It can be seen that all SAGHs increase with an increase in the superficial gas velocity. However, individual characteristics can be found in different regions: the SAGH 0.16 0.14
I
III
II
IV
0.12
εg, A
0.10 0.08 0.06 0.04 0.02 0.00 0.10
0.15
0.20
0.25
0.30
0.35
0.40
0.45
h/H (-)
Fig.7 The axial distribution of SAGH in the internal loop I: bottom region, II: gas-distributor action region, III: downcomer-tube action region, IV: upper draft-tube region Experimental Ug (m/s): ■0.0059 ●0.0310 ▲0.0671 ▼0.1439 Simulated Ug (m/s): 0.0059 0.0310 0.0671 0.1439
http://www.bepress.com/ijcre/vol7/A3
Lu et al.: Experiment and CFD Simulation
15
is far lower in the bottom region (I) than in the other regions, starts to increase dramatically from the bottom region (I) to the gas-distributor action region(II), and increase slightly to the downcomer-tube action region(III), finally maintains a relatively steady state in the upper draft-tube region(IV). Moreover, Fig. 8 exhibits axial SAGH distributions obtained experimentally when external liquid circulation velocities are 0.03m/s and 0.05 m/s. Similar to the gas superficial gas velocity, the external liquid circulation velocity has an obvious influence on the axial SAGH in the gas-distributor action region (II) and the downcomer-tube action (III), whilst it can be ignored in the bottom region (I) and the upper draft-tube region (IV). This influence, however, is insignificant in comparison with the superficial gas velocity. The above result indicates that draft tube can increase the gas holdup only in the lower part rather than in the upper part of the internal loop. In the external loop, SAGH increases with an increase in the superficial gas velocity (see Fig. 9) while keeping an external liquid circulation velocity of 0.03 m/s. It decreases from the top to the bottom in the annular region, which implies that small bubbles start to coalesce when they move downward in the external loop, and these merged bigger bubbles subjected to larger buoyancy force change to move upward and return to the top of the external loop. SAGHs in the external loop (see Fig. 9) are found to be far lower than those in the 0.16 0.14
I
IV
III
II
0.12
εg,A
0.10 0.08 0.06 0.04 0.02 0.00 0.10
0.15
0.20
0.25
0.30
0.35
0.40
0.45
h/H(-)
Fig.8 The experimental axial distribution of section-averaged gas holdup in internal loop I: bottom region, II: gas-distributor action region, III: downcomer-tube action region, IV: upper draft-tube region Ug (m/s): ○0.0310 △0.0671 ▽0.1439 at Ucir =0.03m/s ●0.0310 ▲0.0671 ▼0.1439 at Ucir =0.05m/s U (m/s): g
Published by The Berkeley Electronic Press, 2009
International Journal of Chemical Reactor Engineering
Vol. 7 [2009], Article A3
corresponding sections in the internal loop (see Fig. 7). The maximum SAGH is about 0.05 in the external loop while it is about 0.12 in the internal loop. Moreover, Fig. 10 shows the effects of the superficial gas velocity and the external liquid circulation velocity on the axial SAGH distributions in the external loop. Similar to that in the internal loop (see Fig. 8), SAGHs increase with an increase in the superficial gas velocity. However, a slight increase of SAGH is seen when the external liquid circulation velocities is increased from 0.03 to 0.05 m/s. 0.05
0.04
εg,A
0.03
0.02
0.01
0.00 0.10
0.15
0.20
0.25
0.30
0.35
0.40
0.45
h/H (-)
Fig.9 The axial distribution of SAGH in the external loop ■0.0059 ●0.0310 ▲0.0671 ▼0.1895 Experimental Ug (m/s): 0.0059 0.0310 0.0671 0.1895 Simulated g U (m/s): 0.05
0.04
0.03
εg,A
16
0.02
0.01
0.00 0.10
0.15
0.20
0.25
0.30
0.35
0.40
0.45
h/H (-)
Fig.10 The experimental axial distribution of SAGH in the external loop Ug (m/s): □0.0059 ○0.0310 △0.0671 ▽0.1895 at Ucir =0.03m/s ■0.0059 ●0.0310 ▲0.0671 ▼0.1895 at Ucir =0.05m/s Ug (m/s):
http://www.bepress.com/ijcre/vol7/A3
Lu et al.: Experiment and CFD Simulation
17
5.4 Overall gas holdup in the loop section It is well know that overall gas holdup is one of the most important parameters for designing and scaling up the gas-liquid contactor. Fig. 11 shows the effects the superficial gas velocity and the external liquid circulation velocity on the overall gas holdup in the loop section of this combined reactor. Similar to the SAGH stated in the section 5.3, the overall gas holdups in the loop section increase with an increase of superficial gas velocity, and have a slight increase when the external liquid circulation velocity is increased from 0.03 m/s to 0.05 m/s. 0.10
0.08
εg, v
0.06
Ucir =0.03m/s (Exp.) (Sim.) Ucir =0.05m/s
0.04
(Exp.) (Sim.)
0.02
0.00 0.00
0.05
0.10
0.15
0.20
0.25
Ug (m/s)
Fig.11 The distribution of overall gas holdup in the loop section vs. superficial gas velocity
6. CONCLUSIONS Local and overall gas holdups are investigated in a three-dimensional gas-liquid internal loop section with an external liquid circulation by combining experimental measurements with CFD simulations. A double-sensor conductivity probe is employed to measure gas holdup at different locations in the reactor. For numerical simulations, the multiphase model assumes turbulent characteristics for both gas and liquid phases, and the interfacial force considers the drag force and the turbulent dispersion force. Local and section-averaged gas holdups are found to be quite unique in six regions. The gas holdups in the internal loop are greatly affected by the geometrical configuration of the loop section, and are far higher than those in the corresponding sections of the external loop. The section-averaged gas holdup in
Published by The Berkeley Electronic Press, 2009
International Journal of Chemical Reactor Engineering
18
Vol. 7 [2009], Article A3
the bottom region is much lower than that in the other regions, but increases dramatically in the gas-distributor and the downcomer-tube action regions, and maintains relatively steady in the upper draft-tube region. Operational conditions including the superficial gas velocity and the external liquid circulation velocity have an impact on local and overall gas holdups in the loop section of this two-phase reactor. The local gas holdups in all regions, the section-averaged gas holdups in the internal loop and the external loop, and the overall gas holdup in the loop section increase with an increase of the superficial gas velocity. The effects of the external liquid circulation velocity from 0.03 m/s to 0.05 m/s on the section-averaged gas holdup and the overall gas holdup are insignificant compared to the superficial gas velocity. Good agreement between numerical and measured data suggests that the strategy by a combination of experimental measurements with multiphase CFD simulations is an effective tool to develop new gas-liquid reactors. As computational results are strongly dependent on the hydrodynamic model and the mesh topology, experimental verification is of vital importance. However, CFD simulations can provide more detailed local information on the fluid dynamics than experimental investigations.
NOTATION A Aij CD CTD Cε1 Cε2 Cμ db Eo r Fi r Fi D r Fi T r g h H k M P
cross sectional area, m2 net interfacial area between the phases, m 2 drag force coefficient, dimensionless momentum transfer coefficient for interface drag force, dimensionless k-ε turbulence model constant, dimensionless k-ε turbulence model constant, dimensionless k-ε turbulence model constant, dimensionless mean bubble diameter, m Eotvos number, dimensionless total interfacial force , N interfacial force due to drag, N interfacial force due to turbulent dispersion, N acceleration due to gravity, m/s2 axial height of the reactor, m total height of the reactor, m turbulence kinetic energy per unit mass, m 2/s2 Morton number, dimensionless pressure, Pa
http://www.bepress.com/ijcre/vol7/A3
Lu et al.: Experiment and CFD Simulation
r Rc t uT r u Ucir Ug V Vol
19
radial position of the loop reactor, m radius of the loop reactor, m time,s the terminal velocity of bubble, m/s velocity vector, m/s external liquid circulation velocity, m/s superficial gas velocity, m/s voltage, V volume, m3
Greek Letters α ρ Δρ μ
an adjustable parameter, dimensionless density, kg/m3 difference in density between the liquid and gas phases, kg/m3 viscosity, kg /m·s2 molecular viscosity of water under a reference temperature and pressure, kg/(m·s) gas phase kinematic eddy viscosity, m2/s
μref μ tg
μtl μ tl ,b μ tl , s
liquid phase kinematic eddy viscosity, m2/s bubble-induced component of turbulent viscosity, kg/(m·s)
ε
turbulence dissipation rate, m2/s3; volume fraction, dimensionless local gas holdup, dimensionless section-averaged gas holdup, dimensionless
φ εg ε g,A
ε g,V σ σt σ tl σk σε τ
conventional shear-induced turbulent viscosity, kg/(m·s)
overall gas holdup, dimensionless surface tension, N/m turbulent Prandtl number, dimensionless liquid turbulent Schmidt number, dimensionless turbulence model constant for the k equation, dimensionless k-ε turbulence model constant, dimensionless the measuring period, s
Subscripts b
bubble
g
gas phase
l
liquid phase
Published by The Berkeley Electronic Press, 2009
20
International Journal of Chemical Reactor Engineering
Vol. 7 [2009], Article A3
REFERENCES ANSYS Incorporated, ANSYS CFX-solver release 10.0, 2005. Bartrand T. A., Farouk B., Haas C. N., “Countercurrent gas/liquid flow and mixing: Implications for water disinfection”, Int. J. Multiple Flow, 2009, 35, 2, 171-184. Blažej M., Cartland Glover G. M., Generalis S. C., Markoš J., “Gas–liquid simulation of an airlift bubble column reactor”, Chem. Eng. and Proc., 2004, 43, 137-144. Bothe D., Shirzadi H.,Warnecke H. J., “Evaluations of euler-euler simulations of bubble columns based on numerical tracer experiments”, Trans IChemE, Part A, 2007, 85, A11, 1491-1496. Chen P., Sanyal J., Dudukovic M. P., “Numerical simulation of bubble columns flows: effect of different breakup and coalescence closures”, Chem. Eng. Sci., 2005, 60, 4, 1085-1101. Clift R., Grace J.R., Weber M.E., “Bubbles, Drops and Particles”, 1978, Academic Press, New York. Dhaouadi H., Poncin S., Hornut J. M., Wild G., Oinas P., “Hydrodynamics of an airlift reactor: Experiments and modeling”, Chem. Eng. Sci., 1996, 51, 11, 2625-2630. Dhotre M. T., Joshi J.B., “Design of a gas distributor: three-dimensional CFD simulation of a coupled system consisting of a gas chamber and a bubble column”, Chem. Eng. J., 2007, 125, 3, 149-163. Freitas C., FialováM., Zahradnik J., Teixeria J. A., “Hydrodynamic model for three-phase internal- and external-loop airlift reactors”, Chem. Eng. Sci., 1999, 54, 21, 5253-5258. Freitas C., FialováM., Zahradnik J., Teixeria J. A., “Hydrodynamic model for three-phase external-loop airlift bioreactors”, Chem. Eng. Sci., 2000, 55, 21, 4961-4972.
http://www.bepress.com/ijcre/vol7/A3
Lu et al.: Experiment and CFD Simulation
21
Krishna R., Urseanu M. I., van Baten J.M., Ellenberger J., “Influence of scale on the hydrodynamics of bubble columns operating in the churn-turbulent regime: experiments vs. Eulerian simulations”, Chem. Eng. Sci., 1999, 54, 21, 4903-4911. Letzel M., Stankiewicz A., “Gas hold-up and mass transfer in gas-lift reactors operated at elevated pressures” ,Chem. Eng. Sci., 1999, 54, 21, 5153-5157. Liu M. X., Lu C. X., Chu L., Shi M. X., “Experimental Study on local gas holdup in a novel three-Phase air loop reactor”, J. of Chem. Eng. of Chinese Univ., 2005, 19, 1, 36-41 (in Chinese). Lo C. S. and Hwang S. J., “Local hydrodynamic properties of gas phase in an internal-loop airlift reactor”, Chem. Eng. J., 2003, 91, 1, 3-22. Lopez de Bertodano M., “Turbulent Bubbly Flow in a Triangular Duct” Ph. D. Thesis, 1991, Rensselaer Polytechnic Institute, Troy New York. Lu C. X., Liu M. X., Shi M. X., “A gas-liquid-solid compound reactor”, 2004, China patent, CN1640536, (in Chinese). Lu W. J., Hwang S. J., “Liquid velocity and gas holdup in three-phase internal loop airlift reactors with low-density particles”, Chem. Eng. Sci., 1995, 50, 8, 1301-1310. Merchuk J. C., and Stein Y., “Local hold-up and liquid velocity in airlift reactors”, AIChE J., 1981, 27, 377-388. Panneerselvam R., Savithri S., Surender G. D., “CFD modeling of gas–liquid–solid mechanically agitated contactor”, Chem. Eng. Res. Des., 2008, 86, 12, 1331-1344. Sato Y., Sadatomi M., “Momentum and heat transfer in two-phase bubble flow-I.”, Int. J. Multiple Flow, 1981, 7, 2, 167-177. Sun S. l., Liu C. J., Wei W. S. and Bao X. J., “Hydrodynamics of an annulus airlift reactor”, Powder Tech., 2006, 162, 3, 201-207. Wang T. F., Wang J. F., Yang W. G., Jin Y., “Experimental study on bubble size distribution in three-phase circulating fluidized beds”, J. of Chem. Ind. & Eng., 2001, 52, 3, 197-203(in Chinese).
Published by The Berkeley Electronic Press, 2009
22
International Journal of Chemical Reactor Engineering
Vol. 7 [2009], Article A3
Wiemann D., Mewes D., “Calculation of flow fields in two and three-phase bubble columns considering mass transfer”, Chem. Eng. Sci., 2005, 60, 22, 6085 6093. Zhang K., Song H. S., Sun D. K., Li S. F., Yang, X. G., Zhao Y. L., Huang Z., Wu Y. T., “Low-temperature methanol synthesis in a circulating slurry bubble Reactor”, Fuel, 2003, 82 , 2, 233-237. Zhang K., Zhao Y. L., “A scale-up strategy for low-temperature methanol synthesis in a circulating slurry bubble reactor”, Chem. Eng. Sci., 2006, 61, 5, 1459-1469. Zhao Y. L., Huang Z., Zhang K., Li S. F., “Investigation of low-temperature methanol synthesis in a bubble column slurry reactor with a flash column”, Fuel Processing Tech., 2007, 88, 2, 137-142.
http://www.bepress.com/ijcre/vol7/A3