71
Experimental Validation of a New Method for Symmetry Line Detection Luca Di Angelo1, Paolo Di Stefano2 and Maria G. Vinciguerra3 1 University of L’Aquila,
[email protected] University of L’Aquila,
[email protected] 3 University of L’Aquila,
[email protected] 2
ABSTRACT In this work a new method for symmetry line recognition, from 3D scanned data of a subject’s back, is presented. The new method is validated by comparison with traditional techniques based on cutaneous marking. For this purpose, the upright standing and sitting postures of a sample of 75 subjects, who usually perform different sports activities, are analysed. Error in symmetry line detection is measured as the distance between the estimated symmetry line and the position of the markers. The proposed method is compared with another one described in literature which has been validated in clinical field. Results are analysed and critically discussed. Keywords: back shape analysis, symmetry line, posture prediction. DOI: 10.3722/cadaps.2011.71-86 1
INTRODUCTION
Every individual assumes a posture when interacting with the surrounding workplace. This adaptability is possible thanks to the complex anatomy of the musculoskeletal system that has a number of degrees of freedom. Thus, a person may assume alternative postures for the same workplace arrangement. However, not all of them are necessarily correct postures. When an incorrect posture is adopted for a long period of time it causes musculoskeletal injury. In fact, extreme or incorrect postures are considered one of the greater risks for musculoskeletal lesions and they are the most prevalent work-related reason for work absence in many industries. Studies, described in published literature, demonstrate that the curvature of the spine is one of the most important characteristics for determining posture, intervertebral disc loads and stresses [12]. Such considerations have led ergonomics researchers to pay particular attention to the posture analysis and prediction for different workers' typologies [13]. Nowadays the traditional techniques for posture and vertebral column detection, based on cutaneous marking [2], [14], [17], can be replaced with modern techniques based on 3D scanner [4], [5], [7], [8], [9], [11]. These techniques offer new detection and diagnostic capacities: 3D scanners are not invasive, give accurate measurements with acceptable costs and prevent posture detection from being conditioned by the instrument. Similarly to the traditional estimative-experimental techniques, the limitations are due to the fact that the evaluations are included in those ones referring to what can be analysed from the outside. Computer-Aided Design & Applications, 8(1), 2011, 71-86 © 2011 CAD Solutions, LLC
72
The geometric data relating to a subject’s back, as those obtained by means of a 3D geometric scanning (point cloud), cannot be directly used for posture analysis. Data processing becomes, therefore, necessary in order to recognise the characteristic elements of the back, that is to say, those elements identifying the spatial configuration of the vertebral column. This configuration, based on external detection, is given by the position of the vertebral apophyses (symmetry line); from the symmetry line and taking into account the thickness of the soft parts, which cover the vertebra, the spinal midline could be determined [6]. Bergeron et al. [1] and Jaremko et al. [10] developed interesting methods to relate spinal deformities to a set of reliable indexes computed from the external geometry of the trunk. In this work, a new technique for symmetry line detection, based on an original symmetry index, is presented. The symmetry index identifies the line which divides the back into two mirror-image parts. The proposed technique is validated when inspecting the postures of 75 subjects. The subjects have been analysed in two different postures: standing and sitting. The proposed method for postural analysis is also compared with a method validated in clinical field [7], using, as a reference, the traditional techniques based on cutaneous marking. 2
RELATED WORKS
Symmetry line detection is a very important task which is preliminary to any procedure for spine identification [9], [21]. Symmetry line, defined in the form of a three dimensional curve, furnishes the possibility for a quantitative evaluation of the spine morphology. In order to detect symmetry line, Turner-Smith [20] proposed an approach which consists in measuring the positions of markers appointed in correspondence to the vertebral apophyses. Vertebral apophysis is identified by means of a traditional manual palpation. The symmetry line is detected as the broken line which joins the barycentre of each marker. A similar approach was used by Sodoca et al. [18], which approximated the scanned location of the vertebral apophyses by means of a polynomial curve, making a 3D parametric description of the symmetry line. The main limitation of all these methods is the need to manually identify the apophyses and apply markers. A different approach consists in acquiring the surface of the subject’s back in its full extent, by a 3D scanner, and therefore recognising, from the cloud of measured points, the line which identifies the spinal column. The acquisition of the back surface can provide other useful information regarding posture evaluation such as the trunk torsion at each level of the column. Santiesteban et al. [16] proposed an approach where spine detection is based on the estimation of the principal curvatures’ directions and on the joining of “valley points”, recognised in horizontal sections, along these directions. Theriault et al. [19] automatically detected the “back valley” on a scoliotic human trunk defined in the form of a tessellated surface. This approach is based on curvature estimation. At each vertex of the mesh and using a quadric fitting method, the points associated to the back valley are identified as those characterized by a strong negative mean curvature. It is important to notice that the spinal column cannot be associated to valley points (or back valley) in any case: usually in the cervical tract the spine is associated to points characterised by a strong positive mean curvature. In normal subjects, the symmetry line is the line that divides the back into two mirror-image parts. From a geometric point of view, each part can be considered the involutory orthogonal transformation of the other. The symmetry of the spine can be distorted by some ailments such as scoliosis, kyphosis or lordosis, which produce a deviation of the spine from the sagittal plane or torsions. Even in the presence of these anomalies the spine’s location can be identified in a local symmetry property. In a healthy subject this symmetry can be recognised in the profile obtained by sectioning the back surface with a horizontal plane. Symmetry (or asymmetry) can be associated to any point of a plane section of the subject’s back, where a function, properly designed to identify symmetry, has the maximum (or minimum) value. Drerup and Hierholzer [7] proposed a methodology (henceforth DR method) which is based on the analysis of the symmetry properties of the horizontal sections of the subject’s back. A fixed coordinate system is associated to the subject’s back, with the vertical axis defined by the prominence of the seventh cervical vertebra and the sacrum. The back surface is sliced by planes perpendicular to the vertical axis. For each slice curve Γ, the point representing the position of the spine is associated to Computer-Aided Design & Applications, 8(1), 2011, 71-86 © 2011 CAD Solutions, LLC
73
the minimum value of the lateral asymmetry function A defined as follows. Let p be a point belonging to a slice curve of the back; the lateral curvature asymmetry A, with respect to p(ξ), is defined as: A(p)
1 L0
L0 / 2
a(u)u
(2.1)
u 0
L0 is the length of reference, that is, the measure of a neighbour of p explored to check symmetry. The partial contributions a(u) are calculated at the points of each slice lying symmetrically to the left (sub-index l) and to the right (sub-index r) of p, according to: a(u ) H l H r 2
G
2
l
2Gl Gr cos2 Gr 2
2
where: -
H = Mean curvature; Hl=H(ξ-u); Hr=H(ξ+u)
-
G = Gaussian curvature; Gl=G(ξ-u); Gr=G(ξ+u)
-
is the curvilinear abscissa of the point p;
l r is the difference between the angular orientation of the principal direction in l and r (k1,l and k1,r). The function A(p, L0) has value 0 for those points of the curve having a perfectly specular neighbourhood. The value of the length of reference L0 has an important role, especially if compared with the dimensions of the symmetric portion of the back. Varying the value of L0 involves different values of symmetry index, since it analyses symmetry in a wide and narrow range of the zone investigated. The minimum value of A(p, L0) identifies the point that best represents the symmetry of the curve and, therefore, the position of the spine. Since the method is based on surface curvatures calculation (derivatives of second degree), it is particularly sensitive to noises deriving from the acquisition process. These noises cannot be removed with a pre-smoothing of the data without strongly modifying the scanned geometry. -
3
THE PROPOSED METHOD
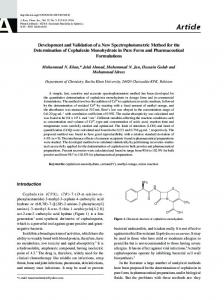
This paper proposes a symmetry index which is based on the analysis of the symmetry in the orientation of the normal vectors of the surface (see Fig. 1). The normal to the vertexes of a tessellated geometric model is less sensitive to noise than those geometric evidences that require the estimation of second-degree differential terms. The proposed method performs the intersection of the surface of the subject’s back with a set of horizontal planes. On each of the slice curves i obtained, the asymmetry function S( ,L0) is evaluated. The asymmetry function verifies the hypothesis that a onedimensional parametric curve i( ) is symmetric at p( ), by comparing the orientations of the normal vectors at opposite points of the curve (p( +u) and p( -u)), which lie symmetrically with respect to the point p( ). If p( ) is a symmetric point, then, the sum of the normal versors, at p( +u) and p( -u), is a versor that has an invariant direction for any value of u: N( , u )
n ( u ) n ( u ) n ( u ) n ( u )
In order to evaluate how invariant the versor N( , u) is in the investigation zone having length L0, the standard deviation of N( , u) is calculated. Normal vectors are described by their components in the slicing plane (nx(u) and ny(u)) and the vector N( , u) by its components Nx( , u) and Ny( , u). The mean values of Nx and Ny in the investigation zone are as follows: N x , L0
1 L0
L0 / 2
N x ( , u )du
u 0
N y , L0
1 L0
L0 / 2
N
y ( , u ) du
u 0
Computer-Aided Design & Applications, 8(1), 2011, 71-86 © 2011 CAD Solutions, LLC
74
The standard deviations of each component of the vector N( , u) are: 1 Nx , L0 L0
L0 / 2
N ( , u) N
2
x
x
u 0
du
0.5
1 Ny , L0 L0
L0 / 2
N
y ( , u )
u 0
Ny
2
du
0.5
The asymmetry function S( , L0), at the point p( ), is defined as: S , L0 Nx Ny 2
2
(3.1)
The function S( ,L0) has value 0 for those points of the curve having a perfectly specular neighbourhood. Since real backs are not perfectly symmetric, the function S( ,L0) is never 0. Its minimum value identifies the point that best represents the symmetry of i( ) and, therefore, the most probable position of the symmetry line. The point where the symmetry function assumes the minimal value is defined as symmetric point and it is denoted by pS( i). Γi+1
Γi
L0 p (ξ)
Γi-1
n(ξ-u)
Z n(ξ+u)
N(ξ, u)
Fig. 1: Definition of the symmetry index S( ,L0). 4
THE PROCEDURE OF COMPARISON
The new method for symmetry line detection (henceforth AQ method) has been compared with that one proposed in Drerup and Hierholzer [7] by evaluating 75 real subjects; for each of them two different postures have been analysed: standing and sitting postures. For this purpose, a specific procedure has been implemented, which consists of the following steps: - in order to identify a reference evaluation of the symmetry line, markers are positioned in correspondence to the vertebral apophyses, using a traditional approach for posture analysis; - the back of each subject is acquired in upright standing and sitting postures by a 3D scanner; - the cloud of measured points is tessellated and transformed into a Eulerian geometric model; - the tessellated geometric model of the back is sliced by intersecting it with horizontal planes; - for each slicing curve the symmetric point is evaluated by using the AQ and DR methods; - the symmetric points are interpolated by a 3D parametric curve; the curves obtained by the two analysed methods are compared with the location of the manually appointed markers.
Computer-Aided Design & Applications, 8(1), 2011, 71-86 © 2011 CAD Solutions, LLC
75
4.1
Data Acquisition
The geometry of the back has been acquired using a 3D geometric scanner based on structured light. The device used allows us to acquire the whole back of the subject with just one scanning. For each subject analysed, the symmetry line has been previously identified through a traditional approach, based on tactile detection, which consists in fixing appropriate markers (white adhesive disk with a diameter of 10mm) in correspondence to the vertebral apophyses. In some cases, due to the presence of thick adipose tissue, the tactile individualization does not yield reliable results. In these cases, the markers have not been fixed. Anyway, the most important anatomic references for the spinal column (Fig. 2) have been detected in each subject analysed. This phase has been repeated before the acquisition of each posture in every subject, so as to avoid those errors caused when the markers no longer identify the apophyses due to the skin gliding movements. For each subject analysed two postures are acquired: standing (Fig. 3) and sitting (Fig. 4) posture.
Z
Z Y
Fig. 2: Anatomic references: A) the first cervical vertebra, B) the seventh cervical vertebra, C) the third thoracic vertebra, D) the seventh thoracic vertebra, E) the twelfth thoracic vertebra, F) the fourth lumbar vertebra.
Fig. 3: Standing posture with the superimposed z axis.
X
Fig. 4: Sitting posture with the superimposed local coordinate system.
In standing posture the subject puts their arms along their sides, the subject looks straight head in the Frankufurt plane and their legs slightly parted. As a reference for the orientation of the spinal column in a vertical direction, a stadiometer is acquired at the same time as the subject’s back. To acquire the sitting posture, a specifically designed stool has been used. This stool gives us the possibility to acquire, contemporaneously with the subject's back, a reference frame, which is oriented in accordance with the plane of the seat and the subject's legs (Fig. 4). Its main characteristics are: - it is height adjustable; - it has a horizontal sitting level to avoid eventual misalignment of the rachis coming from different height positions of the spinal iliac bone; a reference local coordinate system is associated to the stool. It is identified by a vertical and a horizontal pole mounted behind the stool. The reference sagittal plane is identified by means of a bar the knees of the analysed subject must touch; Computer-Aided Design & Applications, 8(1), 2011, 71-86 © 2011 CAD Solutions, LLC
76
The height of the stool is set to guarantee that the lower limbs (thigh-leg) form an angle of 90° with the sitting level. For each subject analysed the length of the trunk and other anthropometric parameters are measured. The back is acquired by sitting the person on the stool according to the following constraints: - the gluteus is in contact with the rear pole; - the subject looks straight head in the Frankufurt plane; - the lower limbs form an angle of 90° with the sitting level; - the knees hold the front bar of the stool; - the arms are relaxed and hands are placed on top of the knees; The back is maintained in a natural position, avoiding any forced posture. 4.2
Method’s Implementation
Each point cloud acquired is, firstly, transformed in order to align it to the local coordinate system associated to the subject. The acquired points are triangulated to obtain a Eulerian geometric model of the subject’s back (a tessellated surface, which consists of a set of adjacent triangles). The geometric model is sliced by uniformly spaced planes, chosen parallel to the X-Y reference plane. The vertexes of the tessellated model which are nearest to the slicing plane are projected onto it (Fig. 5). The implementation of the AQ and DR methods requires that each slicing curve be analysed. The normal versor and the curvatures are evaluated at slice discretization points. For this purpose, the normal versor and the curvatures at the points p( +u) and p( -u), which are at an equal distance from the evaluation point p( ), are estimated by linear interpolation from the values at the nearest points in the slice.
vk vj
vj
Fig. 5: Building of the slice i In order to estimate curvatures and normal versors, the back surface is locally approximated by a biquadric Bèzier surface analyzing, for each point of i, the 3-ring neighbourhood around p (Fig. 6). The normal versor n(p) and the curvatures (Mean and Gaussian) of the path locally approximating the surfaces are assigned to each point p( ) of the slicing curve i. The approximation with a Bèzier patch provides a local smoothing of the data. For each i the asymmetry functions A( , L0) and S( , L0) are estimated. The most symmetric point is characterized by the minimal values of these functions. In order to analyse symmetry, the asymmetry functions S and A are transformed into the symmetry indexes as follows: wA e A( , L0 ) ; wS e S ( , L0 ) (4.1) The domain of the definition of the symmetry index is w{0,1} and assumes the value 1 for a perfect symmetric point in i. Computer-Aided Design & Applications, 8(1), 2011, 71-86 © 2011 CAD Solutions, LLC
77
slice p
Fig. 6: 3-ring neighbourhood around the p point. 5
SYMMETRY LINE RECOGNITION AND APPROXIMATION
The line which is associated to the spinal column is obtained by a weighted approximation of the symmetry points (the weights are the respective wA and wS) with a parametric curve C(t)= {x(t), y(t), z(t)}. The mathematical functions used in this work have been verified in analogous applications in other works described in literature [1], [5], [16]. It is as follows: x
3
i 0
3
ai t i ; y
b cos kt c sin kt ; z t i
(5.1)
i
i 0
Coefficient ai, bi and ci are calculated by a weighted least square method. For each slice i there is a point qS,i (AQ method) or qA,i (DR method) where the symmetry index is maximum. Under the hypothesis that the maximum values of wA and wS identify the symmetry line, the curves of the form (5.1) (CA(t) and CS(t)) that best fit the set of points SS{qS,i }and SA{qA,i }are two interpretations of the spinal column. Hereafter, these curves will be the first tentative symmetry lines and the method will be the first tentative method. In Table 1 the curves CA(t) and CS(t), estimated in 75 real cases (acquired in standing and sitting postures), are compared with the positions of the markers manually appointed on the spinal column (Table 1). The results of this analysis show that the AQ method yields better results than the DR method in every case. lumbar Posture Standing Sitting
Method AQ method DR method AQ method DR method
overall 4.2 5.1 4.4 5.6
thoracic
cervical
mean
max
mean
max
mean
max
3.6 4.0 3.2 4.9
9.8 12.3 10.9 14.6
3.9 4.6 3.9 5.1
11.7 11.3 16.6 15.8
5.1 5.4 5.6 6.3
14.9 18.7 21.2 18.0
Tab. 1: Mean values of the deviation errors (mm) of the curves CA(t) and CS(t) from the position of vertebral apophyses obtained by the first tentative methods. Computer-Aided Design & Applications, 8(1), 2011, 71-86 © 2011 CAD Solutions, LLC
78
In Fig. 7 a sitting posture and a standing posture are compared. In both cases analysed the maps of the normalised symmetry indexes, wA and wS, are reported. It is possible to verify that the AQ method is less affected by noise than the DR Method and, therefore, it is able to discriminate symmetric points with fewer uncertainties. For this reason, the first tentative solution of the symmetry line is more realistic for the AQ method than for the DR method. The errors in symmetry line identification strictly depend on the uncertainty in identifying the most realistic symmetric point in each slice of the back. For this purpose, it is important to notice that, depending on the back morphology, in some cases it is not possible to recognise just one point identifying the symmetry line for each slice. In some cases, there could be an entire wide zone in i where the symmetry index has a quite constant value (Fig. 8) or has more than one maximum (Fig. 9). In these cases, the position of the symmetry line could be associated to relative and not to absolute maximum values of the symmetric index. In order to find an appropriate sequence of symmetry points, all the possible combinations of the sequences of candidate points (in each slice) are approximated by C(t) and, then, analysed. The number of combinations (M: MAQ or MDR ) to be analysed is: n slice
M
m
(5.2)
,i
ì 1
Where mξ,i is the number of maxima of the symmetry index in the slice i. From all the symmetry line candidates, the most promising curve is that one which minimises the sum of its distances from the approximated points: estimated symmetry line. Under the hypothesis that the equation (5.1) is a representative form of the spinal column, this approach for symmetry line detection implicitly selects the set of the most representative points (one for each slice) to be fitted because they are autocorrelated in a 3D form of an actual spine. In Fig. 10 a typical case of a subject’s back is depicted and the points where the symmetry index has its maximum value are marked with a red point. The recognised symmetry line is depicted as a green line. It is possible to verify that, in some slices, the best interpretation for the symmetry line requires a point characterised by a relative maximum of w (black point indicated with arrows) and not a point characterised by an absolute maximum (red point): one for the AQ method and three for the DR method. In all the cases analysed, the criterion used to approximate the symmetry line showed good performances, being the recognised curve the nearest to the real spine configuration. AQ method
DR method
Case ID 15: Female, age 21, height 162,6 cm, weight 55 kg. Standing posture Diagnostic classification and identification in conformity with indicative models of sagittal spinal deformity [15]: Type B (thoracic hyperkyphosis ). Clinical observation: kyphosis with reduction of lumbar plexus.
AQ method
DR method
Case ID25: Male, age 21, height
Computer-Aided Design & Applications, 8(1), 2011, 71-86 © 2011 CAD Solutions, LLC
79
172 cm, weight 71.4 kg. Sitting posture. Diagnostic classification and identification in conformity with indicative models of sagittal spinal deformity [15]: Type A (physiological aspect of human body trunk). Clinical observation: moderate kyphosis and normal lordosis.
y [mm]
Fig. 7: The map of the normalised symmetry indexes obtained by the presented method (AQ) and by the Drerup method (DR). 32 30 28 26 24 22
-30
-20
-10
0
10 x [mm]
0
10 x [mm]
20
30
40
50
symmetry index
1 0.999 0.998 0.997 0.996 0.995 -40
-30
-20
-10
20
30
40
50
60
Fig. 8: Slice of the subject’s back and its symmetry index characterised by constant value. 6
EXPERIMENTAL RESULTS
The two methods, for symmetry line estimation (AQ and DR), have been implemented in an original software. The AQ and DR methods have been compared by analysing standing and sitting postures of a sample of 75 subjects (university students, males and females, aged 20 to 22). In order to characterise the performances of the two methods, the recognised symmetry line has been compared with a traditional way of identification based on manual palpation and cutaneous marking. The recognised vertebral column is analysed by dividing it into three tracts: lumbar, thoracic and cervical. In each of these tracts any deviations of the evaluated symmetry line from the appointed markers are analysed. These deviations are calculated as the minimal distance between the barycentre of the markers and the symmetry line. In Fig. 11, Fig. 12, Fig. 13 and Fig. 14 the histograms of the Computer-Aided Design & Applications, 8(1), 2011, 71-86 © 2011 CAD Solutions, LLC
80
relative frequency and the cumulative probability of errors are shown for each method and for each posture analysed.
y [mm]
65
60
55
50 -80
-60
-40
-20
0
20
40
60
0
20
40
60
x [mm]
symmetry index
1 0.99 0.98 0.97 0.96 0.95 -80
-60
-40
-20 x [mm]
Fig. 9: Slice of the subject’s back and its symmetry index characterised by more than one maximum.
a)
AQ method
Slice Absolute Relative Symmetry line Selected relative maximum
b)
DR method
Fig. 10: Maximum of symmetry function wS (a) and wA (b) in some slices of the back. Computer-Aided Design & Applications, 8(1), 2011, 71-86 © 2011 CAD Solutions, LLC
81
0.35
1 0.9
0.3 0.8 0.7 lumbar thoracic cervical
0.2
0.15
probability
relativefrequency
0.25
0.6 lumbar thoracic cervical
0.5 0.4 0.3
0.1
0.2 0.05 0.1 0
2.0
4.0
6.0 error [mm]
8.0
0
>=10.0