ABSTRACT. In this paper, a novel feature extraction method is pro- posed; Genetic Programming (GP) is used to discover fea- tures, while the Fisher criterion is ...
FEATURE GENERATION USING GENETIC PROGRAMMING BASED ON FISHER CRITERION Hong Guo, Qing Zhang and Asoke K. Nandi Signal Processing and Communications Group, Department of Electrical Engineering and Electronics, The University of Liverpool, Brownlow Hill, Liverpool, L69 3GJ,U.K. phone: +(44) 151 7944525, fax:+(44) 151 7944540, email: {Hong.Guo, john3000, a.nandi}@liverpool.ac.uk
ABSTRACT In this paper, a novel feature extraction method is proposed; Genetic Programming (GP) is used to discover features, while the Fisher criterion is employed to provide fitness values. This produces nonlinear features for both two-class and multi-class recognition problems by revealing the discriminating information between classes. The proposed approach is experimentally compared to conventional nonlinear feature extraction methods, including kernel generalised discriminant analysis (KGDA), kernel principal component analysis (KPCA). Results demonstrate the capability of the proposed approach to transform information from the high dimensional feature space into a single dimensional space by automatically discovering the relationships among data. 1. INTRODUCTION Feature extraction is one of the most important tasks for dimensionality reduction in pattern recognition problems. It is required to have the capability to map the original features into a smaller number of features for reducing the dimensionality of data presented to the classifier and hence to improve the classification efficiency. FLDA (Fisher linear discriminant analysis) and PCA (principal component analysis) are linear feature extraction methods. Reducing dimensionality of features is one of the advantage of linear feature extraction algorithms. However, the limitation of these methods comes from the difficulty to capture a nonlinear relationship within the data which are not linearly-separable. To overcome the weakness of those linear feature extraction methods, nonlinear versions of PCA and FDA have been developed in the kernel space [1, 2, 3]. In recent year, applications of machine learning algorithm have become popular for the feature extraction problems. GP was first introduced by Koza [4] and has been proposed as a machine learning method in pattern recognition problems. The feasibility of applying GP to multi-class pattern classification problem has been studied in [5]. In this paper, a novel method is presented using GP to extract nonlinear features and reduce the dimensionality based on Fisher criterion. This approach provides a solution which obtains a single tree/feature by only a single run of GP. Compared with the framework presented in [6], the number of features is reduced significantly for improving the classification results. In further, the proposed approach is experimentally compared with Kernel Generalised Discriminant Analysis (KGDA) and Kernel Principal Component Analysis (KPCA).
©2007 EURASIP
2. GENETIC PROGRAMMING BASED FEATURE EXTRACTION 2.1 Process of Genetic Programming Genetic Programming, as an extension of GA (genetic algorithm), not only inherits the feature selection capability of GA, but also has the ability to generate new features. In this paper, Fisher criterion measures are employed as the fitness function of GP in order to evaluate the effectiveness of each feature. The procedure of a GP-based feature generation is described as follow: Firstly, an initial population is generated with a fixed number of individuals/features based on a random basis in the starting generation. A fitness value is associated with each individual by the fitness function, which evaluates the discrimination information of each individual for classification. The fitness function is one of most important components of GP to evaluate the effectiveness of each individual (see section 2.2). The individual with the highest fitness value survives from the current generation as the basic member for next generation. This evolutionary approach guarantees the performance of next generation will never drop below that of the current generation. At the beginning of the next generation, three operations (crossover, mutation and reproduction) are conducted based upon survivors to produce new members, which will form a new population for the next generation. Finally, the best solution is generated as a result of this evolutionary process when the stopping criterion is met. 2.2 The Fitness Function As one of the most important components of GP, the fitness function determines the performance of the system. A good fitness measure guarantees the improvement of solutions by rating the performance of each member and giving the stronger ones a better chance of surviving. There have been some attempts [7, 8] to use GP to generate features, using classification success as the fitness values for multi-category classification problems. As these belong to a wrapper type approach, the computational demands are much higher in training a classifier for each individual. In addition, the classification success partially depends on the discrimination ability of the classifier. In order to avoid such weakness, the well known Fisher criterion is utilised for the fitness evaluation by testing the between-class scatter over the within-class scatter. For any two classes (i and j), the Fisher criterion can be
1867
Symbol No. of Inputs Description +, − 2 Addition, Subtraction ×, ÷ 2 Multiplication, Division square, sqrt 1 Square, Square Root sin, cos 1 Trigonometric functions asin, acos 1 Trigonometric functions tan, tanh 1 Trigonometric functions reciprocal, log 1 Reciprocal, Logarithm abs, negator 1 Absolute, Negative Value
defined by |µi − µ j | fi, j = √ , νi + ν j
(1)
where µi is the mean of ith class, µi = N1 ∑Nk=1 xk , νi is the 1 variance of the ith class, νi = N−1 ∑Nk=1 (xk − µi )2 , xk is the kth observation in the class i, 1 ≤ k ≤ N and N is the number of observations. The numerator of fi, j denotes the distance between-class i and j, while the denominator denotes the range of variance within-classes i and j. Given a set of individuals of GP {I1 , I2 , . . . , I p , . . . , In }, where n is the number of individuals/trees in each generation and I p is the pth individual/tree with N p samples with assigned class label, a corresponding fitness value Fp is assigned to pth individual/tree. The fitness function identifies the individual that can progress to the next generation. For a two class problem, a threshold (T ) is set to control the termination of running. The fitness function is defined by 1. Fp = max{ f1,2 |Ik , k = 1, . . . , n} 2. If Fp < T , I p is put into the next generation. Else, GP is terminated. Fp is the fitness value for individual I p , which has the largest fitness value among n individuals. It is well known that the Fisher criterion measures the distribution of between-class scatter over the within-class scatter. The individual having a high fitness value indicates that difference between any two classes is large since the magnitude of Fisher criterion value determines the degree of separation of two classes. During the evolutionary process looking for larger value of fitness, the between-class scatter is maximised and at the same time the within-class scatter is minimised. The fitness function for c-class (c > 2) can be defined in following steps: 1. Loop k = 1, 2, . . . , n (a) For individual Ik , calculate the mean of samples from each class. µ1 , µ2 , . . . , µc are obtained. (b) Sort mean values in descending/ascending order to obtain sorted index i = 1, 2 . . . , c. (c) Calculate fi,(i+1) (1 ≤ i ≤ (c − 1)) for each adjacent pair of classes based on Equation (1). (d) Set Fk = 0; (e) Loop i = 1, 2, . . . , (c − 1); i. If fi,(i+1) > T , Fk = Fk + 1; Else Fk = Fk + fi,(i+1) /T ; End Loop i End Loop k 2. Fp = max{Fk , k = 1, . . . , n} 3. If Fp < (c − 1), I p is put into the next generation. Else if Fp == (c − 1), GP is terminated. This fitness function shows the procedure for evaluating the fitness of each individual and looks for the best individuals during the learning process of GP. The advantage of the fitness function is that only (c − 1) two-class Fisher criteria value fi,(i+1) are required in the calculation. The fitness function is a measure of separation, designed in such a way that the contribution of the Fisher criterion value fi,(i+1) is the same once it is bigger than the threshold T .
©2007 EURASIP
Table 1: Operator set
2.3 Primitive Terminator sets and Operator sets GP collects the relevant information of classification from the experiments through the terminator sets. In this paper, the full terminator set includes experimental data (see Section 5.1) and some numerical values, which are randomly generated at the construction cycle of the new individuals. These numerical values could be either integer or floating point numbers, both ranging from 1 to 100. Operator sets as one of the main building blocks of GP is used to connect the different terminators to generate new features. A stack of mathematical functions are stored as operator sets, which perform mathematical functions on one or more terminators/operators. This constitutes a tree structure for each population member. Table 1 lists the mathematical functions of function sets used in this paper. 2.4 Primitive Operations Genetic programming evolves tree individuals representing possible solutions to the problem at hand. The new generation of individuals are randomly created based on performing the three genetic operations: • Crossover: GP carries out a crossover operation to create new individuals with a probability Pc , which controls the occurrence of the crossover throughout generations. Two new individuals are generated by selecting compatible nodes randomly from each parent and swapping them, as illustrated in Fig. 1(a). • Mutation: The mutation operation is performed by the creation of a subtree at a randomly selected node with the probability Pm . First, for a given parent, there is an index assigned to each node for identification. A random index number is generated to indicate the place where mutation will happen. The node is located, then the tree downstream from this node is deleted and a new subtree is generated from this node (see Fig. 1(b)), exactly in the same way as growing initial population. • Reproduction: The reproduction operation is performed by copying individuals to the next population without any change in terms of a certain probability Pr . All these three operations happen within one generation based on the three probabilities Pc + Pm + Pr = 1
(2)
2.5 The Representation of Each Individual In this paper, tree presentation is used to evolve programs. Each individual can be written as a mathematical
1868
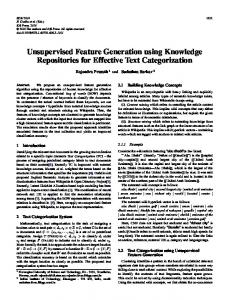
TRoot
tanh
feature1
(a) A example of crossover operation
feature2
Figure 2: Tree Representation Table 2: The Datasets used in the experiment No. of No. of No. of examples Dataset classes features total test training Balance 3 4 625 312 313 Iris 3 4 150 75 75 Lense 3 4 24 13 11 Lung cancer 3 56 32 17 15 Zoo 7 16 101 52 49
(b) A example of mutation operation
Figure 1: Examples of Primitive Operation formula that transforms useful information from the original feature set into a new feature. The formula T Root = tanh( f eature1) + f eature2 mathematically explains the individual generated by GP in Figure 2.
is often rather successful [11]. 1-NN is used as the classifier to examine the performance of features in this paper. MDC is the simplest supervised classification criterion. Basically, the method finds centres of classes and measures distances between these centres and the test data. 5. EXPERIMENTS AND RESULTS
3. KERNEL FEATURE EXTRACTION METHODS
5.1 Experimental Data
Kernel Principal Component Analysis (KPCA) and Kernel Generalised Discriminant Analysis (KGDA) are two independent nonlinear feature extraction/selection methods, both of which performs the mapping into the feature space F with kernel functions and uses a linear analysis algorithm to discover patterns in the nonlinear kernel-defined space. Kernel PCA is a non-linear extension of the PCA in a kernel-defined feature space making use of the dual representation.[9] KGDA is derived from a linear version of the discriminant analysis, namely, Fisher linear discriminant analysis (FLDA). FLDA is a supervised method and is designed optimally with its ability to maximise the ratio of within-class scatter and between-class scatter of projected features. The idea of KGDA is to solve the problem of FLDA in a kernel feature space, thereby yielding a nonlinear discriminant in the input space [10]. 4. CLASSIFIER K-Nearest Neighbour (KNN) and Minimum Distance Classifier (MDC) are employed in this paper to evaluate the discriminating ability of features generated by GP and other feature extraction methods presented previously. KNN is to classify a test object based on majority of Knearest neighbour category. Given that the version of k = 1
©2007 EURASIP
In order to examine the capability and efficiency of this proposed approach for the feature extraction task, a series of experiments are conducted on five data sets(see Table 2). Five datasets used in the pattern recognition field are employed in this paper to evaluate the proposed method in terms of the classification accuracy. Table 2 lists the number of classes, original features, training examples and test examples of five data sets. Those five data sets are chosen from the UCI repository of machine learning data sets [12]. 5.2 Classification Results In this paper, KNN and MDC classifiers are utilised to examine the ability of different features generated by GP and other two kernel-based feature extraction methods (KPCA and KGDA). The best classification results of KNN and MDC using the GP generated features on five data sets are compared with that of the original features and features extracted by KPCA and KGDA. Gaussian kernel k(x, y) = exp(−kx − yk2 /2σ 2 ) is employed in KPCA and KGDA respectively to extract c − 1 features based on each set of original features. Table 3 presents the best classification accuracy obtained by different feature sets generated by GP and KPCA and KGDA methods using the KNN classifier. It can be seen from Table 3 that single GP feature as the input to the KNN
1869
Table 3: The best classification accuracy (%) using original features, c − 1 KPCA-extracted features, c − 1 KGDAextracted features and one GP-generated features respectively, with a KNN classifier on all the experimental data sets. Data set Original features KPCA GDA GP Balance 65.71 71.47 77.88 97.44 Iris 94.67 96.00 94.67 97.33 Lense 38.46 46.15 69.23 90.91 Lung cancer 52.94 58.82 47.06 60.00 zoo 94.23 88.46 94.23 98.08 Table 4: The best classification accuracy (%) using original features, c − 1 KPCA-extracted features, c − 1 GDAextracted features and one GP-generated features respectively, with a MDC classifier on all the experimental data sets. Data set Original features KPCA GDA GP Balance 84.25 72.12 67.63 93.27 Iris 97.33 89.33 94.67 97.33 Lense 72.73 46.15 69.23 84.62 Lung cancer 47.06 58.82 47.06 66.67 zoo 84.62 80.77 94.23 98.08
gle GP-generated feature are the most accurate and reliable in all experiments. From the results of five pattern recognition problems, GP is not only capable of reducing the dimensionality, but also achieving a significant improvement in the classification accuracy. Using the single feature generated by GP, a significant improvement in classification accuracy and robustness is achieved, compared to other sets of features extracted by KPCA and KGDA. From the different types of experiments presented in this paper, it is demonstrated that the proposed GP framework performs either the best or equally best. As demonstrated in the simulation results, the classification accuracy in these datasets are the highest among all the approaches tested. The more important aspect of this approach is the significant reduction of dimensionality required to describe the problem compared to other three classical feature extraction/selection methods. It is a highly efficient learning tool by combining different non-linear functions to transform useful information into one a dimensional space, in which the characteristic of each class is given a prominence. Compared with other GP-based methods which need c GP-trees [5, 13, 6] to solve a c-class (c > 2) pattern recognition problem, the approach proposed here requires only a single GP run to produce a single tree representative. This appears to be a promising start. Acknowledgment
achieves the best classification accuracy compared to other pattern recognition methods on all of the datasets. The original feature with KNN gives the lowest results for Balance dataset and Lense dataset among all pattern recognition problems. The same best classification result of using original features with KNN reaches 94% success, same as using and KGDA generated features with KNN for Iris dataset. For Lung cancer dataset, when KGDA generated features as the input to a KNN, the best classification result is just 47.06% success, the lowest among all pattern recognition systems. For the animal classification problem (zoo dataset), KPCA/KNN does not achieve any improvement even compared to that using the original feature sets with KNN. To further examine the powerful dimensionality reduction capability of the proposed method, MDC as the simplest classifier is employed for five different classification problems. In these experiments, the same group of feature sets prepared by different feature extraction algorithms (KPCA, KGDA and GP) are used as the input to the MDC respectively. Table 4 demonstrates the best classification results of MDC using original features, KPCA extracted features, KGDA extracted features and a single GP-generated feature. From Table 4 it can be seen that the best classification accuracy using the features extracted by KPCA and KGDA with MDC is lower than that using original feature sets with MDC in most datasets, except zoo data sets. For the zoo data, KGDA features outperform the original features with the MDC. Moreover, the GP generated feature with MDC achieves the best among those using other methods generated features with MDC for five different classification problems. 6. DISCUSSION Summarising all the results obtained from different approaches for pattern recognition problem based on five different data sets, it can be said that performances from a sin-
©2007 EURASIP
H. Guo would like to acknowledge the financial support of the Overseas Research Studentship Committee, UK, the University of Liverpool and the University of Liverpool Graduates Association (HK). REFERENCES [1] S. Mika and G. Ratsch and J. Weston and B. Scholkopf and A. Smola and K. Muller, “Nonlinear component analysis as a kernel eigenvalus problem,” Neural Computation, vol. 10, pp. 1299-1309, 1998. [2] T. Cooke, “Two variations on Fisher’s Linear Discriminant for Pattern Recognition,” IEEE Trans. on Pattern Analysis and Machine Intelligence, vol. 24, pp. 268-273, 2002. [3] S. Mika and G. Ratsch and J. Weston and B. Scholkopf and A. Smola and K. Muller, “Constructing Descriptive and Discriminative Nonlinear Features: Rayleigh Coefficients in Kernel Feature Spaces,” IEEE Trans. on Pattern Analysis and Machine Intelligence, vol. 25, pp. 623-628, Jan. 2003. [4] J. R. Koza, Genetic Programming: On the Programming of Computers by Means of Natural Selection. Cambridge: MIT Press, 1992. [5] J. K. Kishore and L. M. Patnaik and V. Mani and V. K. Arawal, “Application of Genetic Programming for Multicategory Pattern Classification,” IEEE Trans. on Evolutionary Computation, vol. 4, pp. 242-258, 2000. [6] H. Guo and L. B. Jack and A. K. Nandi, “Feature generation using genetic programming with application to fault classification,” IEEE Trans. on syst., Man and Cybern Part B, vol. 35, pp. 89-99, Feb. 2005. [7] J. R. Sherrah and R. E. Bogner and A. Bouzerdoum, “The evolutionary pre-processor: Automatic feature extraction for supervised classification using genetic pro-
1870
gramming,” in Proc. 2nd Int. Conf. Genetic Programming (GP-97), 1997, pp. 304-312. [8] M. Kotani and S. Ozawa and M. Nasak and K. Akazawa, “Emergence of feature extraction function using genetic programming,” in Knowledge-Based Intelligent Information Engineering Systems, Third International Conference, 1997, pp. 149-152. [9] J. Shawe-Taylor and N. Cristianini, Kernel Methods for Pattern Analysis. Cambridge University Press, 2004. [10] K. R. Muller and S. Mika and G. Ratsch and K. Tsuda and B. Scholkopf, “An introduction to Kernel-based Learning Algorithms,” IEEE Trans. on Neural Networks, vol. 12, pp. 181-201, March 2001. [11] B. D. Ripley, Pattern Recognition and Neural Networks. Boston: Cambridge University Press, 2004. [12] C. J. Merz and P. M. Murphy, “UCI repository of machine learning databases [13] M. Brameier and W. Banzhaf, “A Comparison of Linear Genetic Programming and Neural Networks in Medical Data Mining,” IEEE Trans. on Evolutionary Computation, vol. 5, pp. 17-26, 2001.
©2007 EURASIP
1871