FINGERPRINT REGISTRATION USING GENETIC ALGORITHMS Hany H. Ammar, and Yongyi Tao Department of Computer Sciences and Electrical Engineering, West Virginia University, Morgantown, WV 26506 Emails:
[email protected],
[email protected]
ABSTRACT In automated fingerprint identification systems, an efficient and accurate alignment algorithm in the preprocessing stage plays a crucial role in the performance of the whole system. In this paper, we explore the use of genetic algorithms for optimizing the alignment of a pair of fingerprint images. To test its performance, we compare the implemented genetic algorithm with two other algorithms, namely, a 2D and 3D algorithms. Based upon our experiment on 250 pairs of fingerprint images, we find that: 1) genetic algorithms run ten times faster that 3D algorithm with similar alignment accuracy, and 2) genetic algorithms are 13% more accurate than 2D algorithm, with same running time. The conclusion drawn from this study is that a genetic algorithm approach is an efficient and effective approach for fingerprint image registration. 1. INTRODUCTION Fingerprint Image Comparison (FIC) is one of the specified functions included in the functional requirements document of the FBI Integrated Automated Fingerprint Identification System (IAFIS). Given a pair of fingerprint images, the purpose of FIC is to decide either they are identical, where the two images are matched, or they are nonidentical, where the two images are not matched.
1
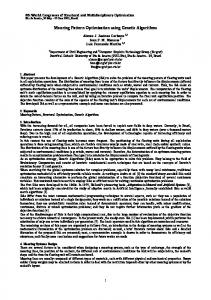
There are two stages involved in FIC: preprocessing stage and decision stage [Ammar et al, 1998]. The purpose of the preprocessing stage is to align two regions of interest (ROIs) extracted from each of the two original fingerprints. After the two ROIs are well registered, they are submitted to the decision-making stage, which in turn determines whether the two images are identical or non-identical. A neural network is often employed to make this decision after it is trained using sample data set. In our previous study [Ammar, et al, 1998], we concluded that the accuracy of registration in the preprocessing stage played a crucial role in determining the accuracy of the whole system. Most of the false rejection and false acceptance errors were resulting of inaccurate registration of the fingerprint image pair. In order to find the optimal registration, we have to try each point in the whole search space. Given a pair of images (Fn, Fm) that have a dimension of N X N and M X M (N>M) respectively, we use point (x0, y0) to denote the left-bottom corner coordinate of Fm and angle T to denote the rotation degree (see Figure 1). Both x0 and y0 can have a value within range of 0 to N (N is the size of larger image). Suppose the range of T is -D to +D, then the search space can be represented by a 3-D cube shown in Figure 2.
T +D
N
Fn N
M
Fm
X0
N
N
X0
-D
T Y0
Y0
Figure 1. Meanings of X0, Y0 and T
2
Figure 2. The Graphic Representation of Search Space in Fingerprint Registration
The total number of possible trial (T) within this search space is T = N2*(2D) Suppose N = 144 and D = 10o, then T = 414720. This is the total number of trials if brute force random search algorithm is used. For each single trial, the magnitude of computation for calculating correlation between the two images is roughly 2*M2, since we have to scan both image once. Then the total amount of computation for finding optimal alignment using random search algorithm is 414720* M2*2, which is overwhelming. Obviously, we have to use alternative algorithm for this optimization purpose. This is where genetic algorithm gets into play.
2. RELATED RESEARCH ON GENETIC ALGORITHMS AND IMAGE REGISTRATION
Genetic algorithms (GAs) are global search and optimization methods simulating natural evolution and natural genetics [Holland, 1975; Goldberg, 1989]. GAs have been initially developed by John Holland, his colleagues, and his students at the University of Michigan. GAs start with a whole randomly initialized population of feasible solutions. Each individual solution in the population is referred to as chromosomes.
These
chromosomes compete to reproduce offspring based on the Darwinian principle of survival of the fittest. In each generation, "the best get more copies, the average stay even, and the worst die off" [Goldberg, 1989 PP 16]. Hopefully, after a number of generations of evolutions, the chromosomes remaining in the group are the optimal solutions.
3
Genetic algorithms has become an efficient tool for search, optimization and machine learning [Goldberg, 1989]. Even in the pre-GA era, concepts of GAs had been applied in game playing [Bagley, 1967], pattern recognition [Cavicchio, 1972], biological cell simulation [Rosenberg, 1970] and complex function optimization [Hollstien, 1971]. After Holland (1975) published his influential book, Adaptation in Natural and Artificial Systems, and in that same year De Jong completed his important and pivotal dissertation, “Analysis of the Behavior of a Class of Genetic Adaptive Systems”, the application of Genetic algorithm started to proliferate. From then on, GAs has been widely employed in many fields, including traveling salesman problem (TSP) [Brady, 1985; Grefenstette, 1985; Suh and Van Gucht, 1987], VLSI circuit layout design [Davis and Smith, 1985; Fourman, 1985], optimization of gas pipeline layout [Goldberg, 1983], function optimization [De, Jong, 1975], genetic-based machine learning (GBML) system [Bickel et al, 1987], genetic-based classifier system [Riolo, 1986, Zhou, 1985 Wilson, 1986], and many other instances. Despite this broad area of application, using genetic algorithm for image registration is rather rare in the huge volume of literature on GA. The only example was medical image registration [Fitzpatrick, Grefenstette, and Van Gucht, 1984; Grefenstette and Fitzpatrick, 1985]. In their system, Fitzpatrick, Grefenstette, and Van Gucht used a simple genetic algorithm to perform image registration as part of a larger digital subtraction angiography (DAS) system. In DAS a doctor attempts to examine the interior of a suspect artery by comparing two x-ray images, one taken prior to the injection of dye into the artery and one taken following the injection. The two images are digitized and subtracted pixel by
4
pixel with the desired end result being a difference image that clearly outlines the interior of the subject artery. If the only difference between the two images is the addition of the dye, image subtraction should leave only the dye-coated region. Unfortunately, this is a big if. Slight movements of the patient can cause the two images to go out of alignment, thereby disturbing the difference image. As a result, the images must be aligned or registered prior to calculation of the difference image. This is where Fitzpatrick et al. used a genetic algorithm. In their procedure, the pre-injection image was transformed by a bilinear mapping x’ = a0 + a1x +a2y + a3xy and y’ = b0 + b1x + b2y + b3xy to a transformed image. Although the mathematical form of the transformation was fixed, the coefficients of the transformation were considered to be unknowns. A GA was used to search for coefficients that minimized the difference between pre-injection and post-injection images on the basis of mean absolute image difference. To do this, the x and y coordinates of each of the four image corners were coded as eight-bit sub-strings and each was mapped linearly between –8 and +8 pixels displacement (the full image was discretized on a 100 X 100 grid). The eight coefficients of the x and y bilinear mappings were then uniquely determined by image displacement vectors at the four corners of the image. The 64-bit concatenated strings were then used in a genetic algorithm search for good transformations. Numerical experiments with both artificial images and real x-rays were successful. Ammar, Zeng and Miao [Ammar at al ,1998] in their Fingerprint Image Comparison system, used another approach for fingerprint image alignment. They used the 2D search algorithm, which tries every possible location in the target image. Correlation coefficient was used as measurement of goodness of alignment.
5
This
approach would create optimal alignment if no rotation transformation is present. But because it did not consider the rotation transformation in its search algorithm, its performance is injured when such transformation is actually present.
This study is
intended to improve the performance of this alignment algorithm by taking rotation into account and through the use of genetic algorithm for more efficient search. 3. GENETIC ALGORITHMS IN FINGERPRINT REGISTRATION The real number coding is used to represent a single solution, the chromosome. Each chromosome consists of three pieces (genes): x0, y0, T (Figure 1). Given the corner location (X0,Y0) and rotation angle T of the smaller image, the new coordinate of each pixel in the smaller image can be obtained through three transformation operations: translation, rotation and concatenation Translation: X' = x + X0 y' = y + Y0 Rotation: X' = xcosT + ysinT y' = -xsinT + ycosT Concatenation: X' = xcosT + ysinT + X0 y' = -xsinT + ycosT + Y0 These three operations are called for each chromosome (containing x0, y0, and T) in a generation to calculate the correlation coefficient between the smaller image and larger image. The correlation coefficient is then used as the measure of fitness for this particular chromosome. The correlation coefficient is computed as following: [¦(X -X)(Y-Y)]/N
r= SxSy
Where: r = correlation coefficient, N = number of pixels in overlapping part of the images, X, Y = pixel value in images, X, Y = mean of the images, Sx, Sy = standard deviation of the images.
6
This objective function is implemented as C function with a return type float. In each generation, GA calls this function to get the fitness of each alignment candidate in the population and a rank of fitness is then assigned based upon the population statistics. One important consideration in this work is the computational cost of performing a single objective function evaluation. On a 100 X 100 image this function requires something like 10,000 calculations to get the correlation coefficient. This is extremely time-consuming. To make GA work efficiently when objective function is computationintensive, a special type of genetic algorithm, called steady state GA is used. This genetic algorithm is similar to the algorithms described by De Jong. It uses overlapping populations with a user-specifiable amount of overlap.
The algorithm
creates a population of individuals by cloning the genome or population that you pass when you create it. Each generation the algorithm creates a temporary population of individuals, adds these to the previous population, then removes the worst individuals in order to return the population to its original size. Steady state GA guarantees good performance with fewer calls of the objective function. After the type of genetic algorithm is set, other parameters need to be determined accordingly. Table 1 lists the parameters we used in this particular application. In Table 1, the population size in each generation should be proportional to size of searching space. We tried different population size ranging from 50 to 1000, and found that 500 was the best in term of balance between accuracy and computation time. Previous studies indicated that the probability of crossover should usually be high (0.6-0.8) and the probability of mutation should be low (0.02-0.1).
7
Population Size in Each Generation
500
Probability of Crossover
0.8
Probability of Mutation
0.2
Percentage of Replacement
0.9
Convergence Measure
0.99
Minimum # of Generations
50
Table 1. Parameters of Genetic Algorithm
4. ANALYSIS OF RESULTS The fingerprints used in the system are from the NIST Fingerprint Database, which contains 8-bit gray scale images of randomly selected fingerprints. The CD-ROM database contains 4000 (2000 pairs, two different rollings of the same finger) fingerprints stored in NIST’s Ihead raster data format and compressed using a modified JPEG lossless compression algorithm. In this study, the NIST Ihead images are first converted into sun raster files with an extension “.ras”.
The fingerprints are stored with filenames
containing one letter, four digits, an underscore then two digits, and a “.pct” extension (e.g. f_0001_01.pct, s_0001_01.pct). The first character in the filename is always an “f” or “s” indicating the first or second rolling of the same fingerprint. The next four characters represent the print sequence number, and the final two digits indicate the finger number in the same order as on the fingerprint card (see table 2). The fingerprints are classified into one of the five categories (left loop, right loop, whirl, tented arch and arch). The classification information is stored in the file header. Each print is 512 X 512 with 32 rows of white space at the bottom of the print. In this study, a region of interest (ROI) is extracted from the fingerprint.
8
In this experiment, we used only the first 250 pairs, which have names ranging from 0001 to 0250. 01: R. Thumb
02: R. Index
03: R. Middle
04: R. Ring
05: R. Little
06: L. Thumb
07: L. Index
08: L. Middle
09: L. Ring
10: L. Little
Table 2. Layout of Fingerprint Card Numbers
To test the performance of genetic algorithm in fingerprint registration, we compare it with two other algorithms: the 2D search algorithm described in Ammar et al, 1998 and the 3D brute-force algorithm, both of which are essentially random search algorithms. The difference between the two is that the former ignores the rotation transformation in registration.
Because the 3D brute-force algorithm tries every
possibility, it always finds the best correlation. By comparing with 2D search algorithm, we would like to see how the registration accuracy is improved using genetic algorithm. By comparing with 3D bruteforce algorithm, we want to know how often genetic algorithm finds the optimal solution and how well it performs in average. The correlation coefficient is used as the measure of registration accuracy. We try two ROI (Region of Interest) sizes in this experiment. In the first case, the larger ROI has a dimension of 144 by 144, and the smaller ROI has a dimension of 64 by 64. In the second case, the smaller ROI keeps the same, but the larger ROI is enlarged to 196 by 196. By enlarging the target ROI, we essentially increase the search space of genetic algorithm. This enables us to track how well genetic algorithm works in different search space sizes.
9
The three algorithms are run on the 250 pairs of fingerprints (the first and second rolling) for both ROI sizes. For ease of description, the results of first 10 pairs are included in this result comparison section. Table 3 lists the results for 2D search and genetic algorithm, when window size of 144X144 (larger window) and 64X64 (smaller window) are used. Table 4 lists the same result when window size of 196X196 (larger window) and 64X64 (smaller window) are used. First Rolling File
Second Rolling File
File size 144X144
File size 64X64
2D search Algorithm Correl.
sub_f0001_01.ras sub_s0001_01.ras
Time (M) 1.27
x0
y0
0.5
30
30
sub_f0002_05.ras sub_s0002_05.ras
1.27
0.45
29
79
Sub_f0003_10.ras sub_s0003_10.ras
1.18
0.23
71
Sub_f0004_05.ras sub_s0004_05.ras
1.18
0.42
38
Sub_f0005_03.ras sub_s0005_03.ras
1.18
0.38
78
Sub_f0006_09.ras sub_s0006_09.ras
1.23
0.77
Sub_f0007_09.ras sub_s0007_09.ras
1.17
0.33
Sub_f0008_10.ras sub_s0008_10.ras
1.25
Sub_f0009_08.ras sub_s0009_08.ras
1.13
Sub_f0010_01.ras sub_s0010_01.ras
1.13
Genetic Algorithm Angle
Correl.
x0
y0
0
Time (M) 2.62
Angle
0.65
26
35
6
0
4.5
0.57
58
80
-10
1
0
2.13
0.29
79
6
5
51
0
2.35
0.46
37
57
6
34
0
2.52
0.45
80
47
-6
21
24
0
2.07
0.76
20
23
0
79
31
0
4.07
0.41
73
27
10
0.48
10
44
0
2.82
0.53
12
51
5
0.1
52
72
0
2.53
0.27
14
79
-10
0.35
25
65
0
2.17
0.37
24
70
5
Table 3. Results for 144X144 and 64X64 Window Size: 2D search and Genetic Algorithm First Rolling File
Second Rolling File
File size 196X196
File size 64X64
Sub_f0001_01.ras sub_s0001_01.ras
2D search Algorithm Time Correl. (M) 3.48 0.5
x0
y0
Genetic Algorithm Angle
Time Correl. (M) 3.4 0.64
x0
y0
Angle
56
56
0
50
63
8
62
116
0
2.78
0.72
82
109
-10
0.31
87
131
0
1.63
0.32
86
132
-1
0.43
64
77
0
2.57
0.47
62
83
6
0.41
115
78
0
2.77
0.5
131
124
-5
0.77
47
50
0
3.6
0.77
47
50
0
0.53
124
49
0
2.82
0.63
120
47
6
0.49
36
70
0
2.35
0.55
38
77
5
0.16
86
0
0
2.98
0.37
0
7
-10
51
91
0
3.6
0.36
49
97
7
Sub_f0002_05.ras sub_s0002_05.ras
3.18
0.53
Sub_f0003_10.ras sub_s0003_10.ras
3.12
Sub_f0004_05.ras sub_s0004_05.ras
3.5
Sub_f0005_03.ras sub_s0005_03.ras
5.32
Sub_f0006_09.ras sub_s0006_09.ras
4.45
Sub_f0007_09.ras sub_s0007_09.ras
3.23
Sub_f0008_10.ras sub_s0008_10.ras
3.28
Sub_f0009_08.ras sub_s0009_08.ras
3.2
Sub_f0010_01.ras sub_s0010_01.ras
3.52
0.34
Table 4. Results for 196X196 and 64X64 Window Size: 2D and Genetic Algorithm
10
By comparing the “correlation” columns for the two algorithms, we can see that in both window sizes, the genetic algorithm performs better than random search algorithm. This can be better viewed using the graphical representation, as shown in Figure 3.
1
A c c u ra c y C o m p a ris o n o f th e T w o A lg o rith m s (w in d o w s iz e 1 4 4 a n d 6 4 )
0.9 Registration Accuracy
0.8 0.7 0.6 0.5 0.4
2 D a lgo rit h m
0.3
G en e t ic A lg o rit hm
0.2 0.1 0 1
2
3
4
5
6
7
8
9
10
Fin g e r p r in t P a ir s ( 1 - 1 0 )
Figure 3. Comparison of Two Algorithms at Two Window Size. In Figure 3, the registration accuracy is the ratio of correlation found by each algorithm against the best correlation found by bruteforce algorithm.
Comparing the running time of the two algorithms, we found that running time of genetic algorithm is not sensitive to the size of search space. For both ROI sizes, genetic algorithm converges at average period of 3 minutes. In contrast, the 2D search algorithm is more sensitive to ROI size. When size of ROI increases from 144 to 196, the running time of the algorithm changes from 1.4 minute (average) to 3.8 minute (average). Figure 4 shows the running time for both algorithms at different ROI sizes. Table 5 shows the results for genetic algorithm and the brute-force search algorithm. From Table 5, we can immediately see that the running time of brute-force algorithm is nearly ten times as much as that of genetic algorithm.
But the final
registration accuracy (correlation) of the two algorithms is very close for all the 10 pairs.
11
Some of them are exactly the same. Figure 5 is a graphical representation of how close the two algorithms are. First Rolling File
Second Rolling File
File size 144X144 File size 64X64
Genetic Algorithm Correl. x0
y0
Bruteforce algorithm Angle Time Correl x0 y0 Anlge (M) . 6 24.3 0.66 25 36 7
Sub_f0001_01.ras sub_s0001_01.ras
Time (M) 2.62
0.65
26
35
Sub_f0002_05.ras sub_s0002_05.ras
4.5
0.57
58
80
-10
25.1
0.58
58
80
-10
Sub_f0003_10.ras sub_s0003_10.ras
2.13
0.29
79
6
5
24.67
0.29
79
6
5
Sub_f0004_05.ras sub_s0004_05.ras
2.35
0.46
37
57
6
25.23
0.46
37
57
6
Sub_f0005_03.ras sub_s0005_03.ras
2.52
0.45
80
47
-6
24.42
0.46
79
34
-4
Sub_f0006_09.ras sub_s0006_09.ras
2.07
0.76
20
23
0
24.73
0.77
21
24
0
Sub_f0007_09.ras sub_s0007_09.ras
4.07
0.41
73
27
10
25.57
0.41
73
27
10
Sub_f0008_10.ras sub_s0008_10.ras
2.82
0.53
12
51
5
24.4
0.53
12
51
5
Sub_f0009_08.ras sub_s0009_08.ras
2.53
0.27
14
79
-10
24.15
0.32
15
78
-10
Sub_f0010_01.ras sub_s0010_01.ras
2.17
0.37
24
70
5
24.35
0.37
24
70
5
Table 5. Comparison of Genetic Alg. And Bruteforce Search Algorithm
R u n n in g T im e C o m p a r is io n o f T h e T w o A lg o r it h m 6 2 D s e a r c h A lg . ( 1 4 4 ) G e n e ti c A lg . ( 1 4 4 ) 2 D s e a r c h A lg . ( 1 9 6 ) G e n e ti c A lg . ( 1 9 6 )
Running Time (Min)
5
4
3
2
1 1
2
3
4
5
6
7
8
9
10
F in g e r p r in t P a ir s ( 1 - 1 0 )
Figure 4. Running Time of the Two Algorithms for two ROI Sizes (196 and 144)
5. CONCLUSIONS In this paper, genetic algorithm is used to register a pair of fingerprints, as required in the preprocessing stage of the fingerprint image comparison system. The purpose of registration is to align the two regions of interest extracted from the
12
fingerprint pair using translation and rotation operations. After being well aligned, the pair of ROIs will then be submitted to identification procedure in the next stage. Aligning two images is essentially optimization process, through which the correlation between the two images is optimized. To achieve this goal, genetic algorithm is used in this project.
Registration Accuracy
0.9
Accuracy Comparison of the Two Algorithms (window size 144 and 64)
0.8
Bruteforce Algorithm
0.7
Genetic Algorithm
0.6 0.5 0.4 0.3 0.2 0.1 0 1
2
3
4
5
6
7
8
9
10
Fingerprint Pairs (1-10)
Figure 5. The accuracy of genetic algorithm and bruteforce algorithm is very close. But genetic algorithm runs ten times faster (see Figure 6). In Figure 5, the registration accuracy is the actual correlation found by each algorithm
Running Time (Min)
Running Time Com parision of The Two Algorithm
26 21 16 11 6 1
Bruteforce Alg. (144) Genetic Alg. (144)
1
2
3
4
5
6
7
8
9
10
Fingerprint Pairs (1-10)
Figure 6. The running time of bruteforce algorithm is 10 time longer than genetic algorithm.
Comparisons of genetic algorithm with two other random search algorithms are made on aligning 250 pairs of fingerprint images. Two conclusions drawn from the experiment are
13
1) Genetic algorithm is a very efficient method for fingerprint image registration. To align a pair of images with size of 144x144 and 64x64 respectively, the genetic algorithm only takes 3 minutes.
In contrast, the random search
algorithm takes up to 30 minutes. When image size increases to 196x196, the running time of genetic algorithm keeps almost the same, but the random search algorithm takes more than one hour.
2) Genetic algorithm is an extremely effective approach for fingerprint image registration. It found the best correlation for 113 pairs out of the 250 pairs. Considering the fact that the chance for finding the best correlation is 1 out of 414720 (see the introduction section for reference to this number), the performance of genetic algorithm is really good. In addition, the overall average accuracy of genetic algorithm (against the best correlation found by brute-force algorithm) is 95.04%, while average accuracy of the 2D search algorithm is only 82.2%. So, genetic algorithm improved the registration accuracy (correlation) by 13%, with same running time. 6. REFERENCE Ammar, H. H., S. Zeng, and Z. Miao. 1998. Parallel Processing and Fingerprint Image Comparison, Int. J. Modeling and Simulation, Vol. 18, No. 2, pp 85-99. Bagley, J. D. 1967. The Behavior of Adaptive Systems which Employ Genetic and Correlation Algorithms. (Doctoral Dissertation, University of Michigan). Dissertation Abstracts International, 28(12), 5106B. Bickel, A. S., and Bickel, R. W. 1987. Tree Structured Rules in Genetic Algorithm. Genetic Algorithm and their applications: Proceedings of the Second International Conference on Genetic Algorithms, 77-81. Brady, R. M. 1985. Optimization Strategies Gleaned from Biological Evolution [letter to the editor]. Nature, 317, 804-806 Cavicchio, D. J. 1972. Reproductive Adaptive Plans. Proceedings of the ACM 1972 Annual Conference, 1-11.
14
Davis, L. and Smith, D. 1985. Adaptive Design for Layout Synthesis. (Texas Instruments Internal Report). Dallas: Texas Instruments. De Jong, K. A. 1975. An Analysis of the Behavior of a Class of Genetic Adaptive Systems. (Doctoral Dissertation, University of Michigan). Dissertation Abstracts International, 36(10), 5140B. Fitzpatrick, J. M. Grefenstette, J. J. and Van Gucht, D. 1984. Image Registration by Genetic Search. Proceedings of IEEE Southeast Conference, 460-464. Fourman, M. P. 1985. Compaction of Symbolic Layout Using Genetic Algorithms. Proceeding of an International Conference on Genetic Algorithms and Their Applications, 141-153. Goldberg, D. E. 1983. Computer-aided Gas Pipeline Operation Using Genetic Algorithm and Rule Learning (Doctoral Dissertation, University of Michigan). Dissertation Abstracts International, 44(10), 3174B. Goldberg, D. E. 1989. Genetic Algorithms in Search, Optimization, and Machine Learning, AddisonWesley Publishing Company, Massachusetts. Grefenstette, J. J. (Ed.). 1985. Proceedings of an International Conference on Genetic Algorithms and Their Applications. Hillsdale, NJ: Lawrence Erlbaum Associates. Holland, J. H. 1975. Adaptation in Natural and Artificial Systems, University of Michigan Press, Ann Arbor. Hollstien, R. B. 1971. Artificial Genetic Adaptation in Computer Control Systems. (Doctoral Dissertation, University of Michigan). Dissertation Abstracts International, 32(3), 1510B. Riolo, R. L. 1986. LETSEQ: An Implementation of the CFS-C Classifier System in a Task-Domain that Involves Learning to Predict Letter Sequences, (Technical Report). Ann Arbor: University of Michigan, Logic of Computers Group. Rosenberg, R. S. 1970. Simulation of Genetic Populations with Biochemical Properties: I. The model. Mathematical Biosciences, 7:223-257. Suh, J. Y. and Van Gucht, D. 1987. Incorporating Heuristic Information into Genetic Search. Genetic Algorithms and their applications: Proceedings of the Second International Conference on Genetic Algorithms, 100-107. Wilson, S, W. 1986. Classifier System Learning of a Boolean Function (Research Memo RIS-27r) Cambridge, MA: Rowland Institute for Science. Zhou, H. 1985. Classifier Systems with Long Term Memory. Proceedings of an International Conference on Genetic Algorithm and Their Applications, 178-182.
15