International Journal of Uncertainty, Fuzziness and Knowledge-Based Systems Vol. 21, No. 1 (2013) 103−126 © World Scientific Publishing Company DOI: 10.1142/S0218488513500062
FORMATION OF FUZZY IF-THEN RULES AND MEMBERSHIP FUNCTION USING ENHANCED PARTICLE SWARM OPTIMIZATION P. GANESHKUMAR*,‡, C. RANI*,†,§ and S. N. DEEPA† * Department of Information Technology, Anna University of Technology Coimbatore, Coimbatore-641047, Tamil Nadu, India † Department of Electrical and Electronics Engineering, Anna University of Technology Coimbatore, Coimbatore-641047, Tamil Nadu, India ‡
[email protected] §
[email protected]
This paper proposes an Enhanced Particle Swarm Optimization (EPSO) for extracting optimal rule set and tuning membership function for fuzzy logic based classifier model. The standard PSO is more sensitive to premature convergence due to lack of diversity in the swarm and can easily get trapped into local minima when it is used for data classification. To overcome this issue, BLX-α crossover and Non-uniform mutation from Genetic Algorithm (GA) are incorporated in addition to standard velocity and position updating of PSO. The performance of the proposed approach is evaluated using ten publicly available bench mark data sets. From the simulation study, it is found that the proposed approach enhances the convergence and generates a comprehensible fuzzy classifier system with high classification accuracy for all the data sets. Statistical analysis of the test result shows the suitability of the proposed method over other approaches reported in the literature. Keywords: Fuzzy logic; If-Then rules; membership function; particle swarm optimization; genetic operation.
1. Introduction Data Mining1 has attracted a great deal of attention in the information technology industry due to wide availability of huge amounts of data and the imminent need for turning such data into useful knowledge. Classification is a popular data mining tasks that builds models describing the important data classes and provide a better understanding of data at large. A number of algorithms have been proposed for solving the classification problem. Statistical approaches like Fisher’s Linear Discriminant Analysis,2 Naïve Baye’s Approach,3 and K-Nearest Neighbor4 are memory resistant, deal with small sized data sets and are not scalable. Machine Learning Approaches like Artificial Neural Network5 and Support Vector Machine6 are theory rich approach for data classification but the results produced by them are very hard and difficult to interpret. Although rule based approaches like Decision Tree7 and Rule Induction8 produce interpretable results, they cannot completely bring out the hidden information in the data. Moreover they are lacking in robustness with respect to the noisy and missing values.
103
104 P. G. Kumar, C. Rani & S. N. Deepa
Fuzzy Rule Based Classification System (FRBCS)9 is a fuzzy logic based approach that uses a set of if-then rules and membership function for data classification. With the ability of fuzzy logic that deals with uncertainty, vagueness and ill defined boundaries among the class labels of data, FRBCS seems to be an appropriate approach for decision making after classification of data. Among the two type of FRBCS: Mamdani and Takagi-Sugeno-Kang, Mamdani-type FRBCS allows us to deal with the development of classification system by building a linguistic model which is naturally closer to interpretability for human beings. However, they can suffer a lack of system accuracy as a result of uncertainty inherent in the definition of the membership functions and limitation of the homogenous distribution of the linguistic labels. This is due to the inflexibility of the linguistic variable concept, which imposes hard restrictions to the fuzzy rule structure. In general, the success of FRBCS strongly depends on the quality of the acquired knowledge in the form of fuzzy if-then rules that are formed from the experience of the human experts. But, for classification problems with large number of input variables, the possible number of rules increases exponentially, which makes it difficult for experts to define a complete rule set. Data-driven approach10 has been proposed for developing the FRBCS from numerical data without the knowledge of domain experts. But this approach is very weak in self-learning and determining the required number of fuzzy if-then rules. Another way to solve this issue is incorporation of optimization techniques, which make the FRBCS as a self-learning system. This optimization based learning approach is responsible for generating rules and tuning membership function that are incorporated into an FRBCS. Genetic Fuzzy Rule Based Classification Systems (GFRBCS)11 are one approach in which a fuzzy rule based classification system is augmented by a learning process based on Genetic Algorithm (GA). The GFRBCS proposed in the literature fall into four categories: (i) Learning fuzzy rules with fixed fuzzy membership functions12 (ii) Learning fuzzy membership functions with fixed fuzzy rules13 (iii) Learning fuzzy rules and membership functions in stages14 and (iv) Learning fuzzy rules and membership functions simultaneously.15 Specifically, there exist two kinds of genetic fuzzy learning strategies: the Pittsburg and the Michigan approaches.16 The former obtains a population of rule bases where the best suited one is selected as the final rule base and the later encodes and evolves each rule as an individual, and a single rule base is evolved. The GA based approaches reported so far improve the accuracy of the FRBCS at the cost of their interpretability. Recently the existence of interpretability-accuracy tradeoff has been realized in the design of GFRBCS. Decision-tree-based initializations of FRBCS17 iteratively use the similarity driven rule reduction and genetic algorithm for obtaining compact and interpretable classifier model. Evolutionary scatter partition of feature space,18 Variable input spread inference training algorithm,19 new representation schemes for membership function and rule set,20 Modified Gath Geva and C4.5,21 and multi-objective approaches22,23 are proposed to design compact and interpretable FRBCS
Formation of Fuzzy If-Then Rules and Membership Function 105
using GA with comparable accuracy. Herrera24 presented a detailed taxonomy, current research trends and prospects of genetic fuzzy system. Particle Swarm Optimization (PSO)25 is another popular optimization technique that models the social behavior of bird flocking or fish schooling. PSO based learning for fuzzy system design has been used for nonlinear identification,26 power system stabilizers,27 and collective robotic search application.28 PSO29 is used to obtain antecedents, consequences and connectives of the fuzzy rules and tested the same for inverted pendulum problem and scheduling problem in grid computing. Moreover they failed to design the fuzzy system completely. Since in a fuzzy system, the membership function and rule set are co-dependent, they should be designed or evolved simultaneously. As far as the authors’ knowledge is concerned, PSO based FRBCS30 is proposed and tested using only two datasets: synthetic and iris data. Even though varieties of approaches are presented, more effort is still required to increase the efficiency of the learning of FRBCS. The standard PSO has been subjected to empirical and theoretical investigations by several researchers.31 In many occasions, the PSO converges rapidly during the initial stages of search and then slow down or stop resulting in premature convergence due to lack of swarm diversity. Further, the PSO can get easily trapped in the local optimization when it is applied for solving a complex data classification problem. Now a day, the research trend is to merge or combine the PSO with other techniques, especially the other evolutionary computation techniques. In this paper, an Enhanced Particle Swarm Optimization (EPSO) algorithm is proposed that incorporates BLX-α crossover operation and Non-uniform mutation from GA32 for optimal design of fuzzy classifier that can evolve the rule set along with the number of rules and the membership function simultaneously. The performance of the proposed EPSO approach has been tested using ten bench mark datasets available in the UCI machine learning repository.33 The rest of the paper is organized as follows. Section 2 briefly introduces the classifier model development and the structure of FRBCS. In Sec. 3, standard PSO algorithm is presented. Details of the proposed EPSO and its implementation issues are discussed in Secs. 4 and 5 respectively. Simulations conducted using ten benchmark data sets are discussed and the results are reported in Sec. 6. Concluding remarks are given in Sec. 7. 2. Preliminaries: Data Classification and Components of FRBCS One of the interesting features of human intelligence is its ability to recognize patterns effortlessly and take decisions efficiently based on the results of the recognition process. Recognition itself involves the ability to classify data into known categories. Most of the real world problems in science, engineering, medicine, and business involve data classification. Data classification34 is a supervised learning task that takes labeled data samples and generates a classifier model for classification of new data samples in different predefined groups or classes. Mathematically, this is stated as: given a set of data { (x1 , y1 ), ........ (x n , y n ) } the objective is to produce a classifier h : X → Y which
106 P. G. Kumar, C. Rani & S. N. Deepa
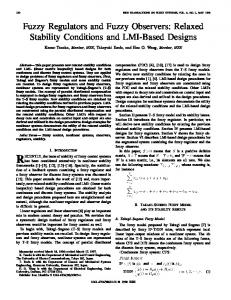
maps an object x∈ X to its classification label y∈Y . Thus the objective of any classifier model is to capture the implicit relation among the data of the same class, so that when a test pattern is given, the corresponding output class label is retrieved. A classifier model can be divided into two categories depending on their use: models that are supposed to work autonomously, and those that are used as a helping tool for the user in the decision processes. In the former, the basic characteristic of the design process is only the correct classification percentage where as the latter not only focus the classification accuracy but also the knowledge gained. Data Classification followed by knowledge extraction has lot of uncertainties since most of the real world data are vague in nature and are very hard to predict as the boundaries between the output class labels are not well defined. With the ability of fuzzy logic that deals with uncertain situation and vagueness, it seems to be an appropriate approach for classification using the knowledge extracted from data. The architecture of fuzzy rule based classifier model35 is shown in Fig. 1. KNOWLEDGE BASE Rule Base + Data Base
R1: IF X1 is A1 and X2 is B1 THEN Y is C1 R2: IF X2 is A2 and X2 is B2 THEN Y is C2 R3: IF X3 is A3 and X2 is B3 THEN Y is C3 R4: IF X4 is A4 and X2 is B4 THEN Y is C4
Dataset If-Then Rules
Membership Function
Fuzzyfication
Class Label Fuzzy Inference Engine
Fig. 1. Architecture of fuzzy rule based classifier system.
As shown in Fig.1, typical fuzzy classifiers consist of interpretable if-then rules with fuzzy antecedents and class labels in the consequent part as shown below: Rj : if xp1 is Aji and … and xpn is Ajn then class Cj
(1)
The antecedents (if-parts) of the rules partition the input space into a number of fuzzy regions by fuzzy sets, while the consequents (then-parts) described the output of the classifier in these regions. A collection of such rules (Rule Base) and membership function for each input variable (Data Base) are used as a Knowledge Base by the fuzzy classifier upon which qualitative reasoning using fuzzy inference system is performed to derive conclusion. Mamdani inference system with product t-norm and max t-conorm is used as they build the model with good interpretability by means of linguistics.
Formation of Fuzzy If-Then Rules and Membership Function 107
In general, the rules and the membership functions used by the fuzzy logic for data classification are formed from the experience of the human experts which is a difficult and time consuming task. In this paper, a hybrid Particle Swarm Optimization approach is proposed to extract knowledge in the form of if-then rules from the data and tuning of membership function for effective data classification. 3. Review of Particle Swarm Optimization Particle Swarm Optimization (PSO)25 is a generalized search and optimization technique inspired by the social behavior of bird flocking or fish schooling. PSO maintains a population of particle’s position that represents candidate solutions to the problem. Each position of particle in the population has an adaptable velocity, according to which the particle moves in the search space. Each position in the population is evaluated to give some measure of its fitness to the problem using the objective function. During each iteration, new population is created according to the following two equations:
vig +1 = wi vig + c1 rand × ( p best − s ig ) + c 2 rand × ( g best − s ig )
(2)
s ig +1 = s ig + v ig +1
(3)
where v ig = velocity of particle i at generation g, v ig +1 = velocity of particle i at generation g+1, sig = position of particle i at generation g, sig +1 = position of particle i at generation g+1, w = inertia weight, c1 = self confidence factor, c 2 = swarm confidence factor, pbest = particle’s individual best, g best = global best at generation g. Equation (2) updates the velocity and Eq. (3) updates the position of the respective particle at each iteration until the convergence criterion is satisfied. The velocity update equation in (2) comprises of three major components.36 The first component is called as “inertia,” or “momentum,” or “habit.” It models the tendency of the particle to continue in the same direction it has been traveling. It is scaled by linearly decreasing inertia weight ‘w’ (from 0.9 to 0.4 over the course of search) to balance the global and local search abilities. The second component is referred to as “memory,” or “self-knowledge,” or “nostalgia,” or “remembrance”. It is a linear attraction towards the best position ever found by the given particle ‘pi’ whose corresponding fitness value is called particle’s best ‘pbest’. The third component is called as “cooperation,” or “social knowledge,” or “group knowledge,” or “shared information”. It is a linear attraction towards the best position found by any particle ‘pg’ whose corresponding fitness value is called global best ‘gbest’. ‘c1’ and ‘c2’ are the acceleration constants reflecting the weighting of stochastic acceleration terms that pull each particle toward ‘pbest’ and ‘gbest’ positions, respectively. ‘rand’ is a random number generated with uniform distribution in the range of [0.0, 1.0]. According to the formulation above, the following procedure can be used for implementing the PSO algorithm.37 Step 1
Initialize the swarm by assigning a random position in the problem hyperspace to each particle.
108 P. G. Kumar, C. Rani & S. N. Deepa
Step 2 Step 3
Step 4 Step 5 Step 6
Evaluate the fitness function for each particle. For each individual particle, compare the particle’s fitness value with its pbest. If the current value is better than the pbest value, then set this value as the pbest and the current particle’s position, xi, as pi. Identify the particle that has the best fitness value. The value of its fitness function is identified as gbest and its position as pg. Update the velocities and positions of all the particles using (1) and (2). Repeat steps 2–5 until a stopping criterion (either maximum number of iterations or a sufficiently good fitness value) is met.
4. Enhanced Particle Swarm Optimization In the standard PSO, pbest and gbest play an important role in getting good or bad position and velocity. The fitness of the global best g best position is the best solution that the swarm has found so far. It is observed that sometimes, particles fail to communicate with each other, especially with the particle having better fitness ( g best ). As a result, the information cannot be shared in the swarm and they will be trapped into local optimum. If the best position ( g best ) is a local optimum, then the particles cannot explore over again in the search space and results in premature convergence phenomenon. To overcome this difficulty, the proposed PSO incorporates the concept of crossover and mutation from Genetic Algorithms. The various steps in applying the proposed enhanced particle swarm optimization for the design of fuzzy rule based classifier model is shown in Fig. 2. Initialize particle’s position and velocity randomly
For each particle’s position (p) evaluate fitness
Converged?
Yes
Best Position
No Update Velocity and Position
Stop Start
Apply BLX-α Crossover
Apply Non-uniform mutation
Update Pbest and Gbest Resulting new Position and velocity Fig. 2. Flowchart of enhanced PSO.
As shown in Fig. 2, the proposed PSO starts with the initialization of control parameters, velocity and position. Fitness of each swarm particle is evaluated. Until the fitness value represents the optimal value, the velocity and position of the particle is updated. At first the velocity and position is updated using Eqs. (2) and (3). Then in order to increase the diversity of the swarm particles and to prevent the particles to move too
Formation of Fuzzy If-Then Rules and Membership Function 109
close to each other and collide, BLX-α cross over operator and Non-uniform mutation are applied to update the velocity and position again which possibly avoids the local optima and accelerates the convergence speed of the PSO algorithm. The following subsection present the details of genetic operators used to enhance the performance of PSO. 4.1. BLX-α crossover operator The crossover is a method for sharing information between particles. Generally, it combines the feature of two parent particles to form two off springs, with the possibility that good particle may generate better ones. Among the variety of crossover operators used in the literature,38 the BLX-α crossover combines the innovation power of two point cross over with local search ability and enables the design of FRBCS to fit complex boundaries more accurately. This freedom provided by the BLX-α makes it to use for the design of FRBCS as they prevent over-fitting in complex domain.39 The BLX-α crossover operator finds out a new position y from the space [ e1 , e2 ] as follows: e + r × (e 2 − e1 ) : if u min ≤ y ≤ u max y = 1 (4) repeat sampling : otherwise where e1 = u1 − α × (u 2 − u1 ) (5)
e2 = u 2 + α × (u 2 − u1 )
(6)
r : Uniform random number ∈ [0,1] Figure 3 illustrates the BLX-α crossover operation for the one dimensional case.
I u min e2
e1 u1
u max
u2
Fig. 3. BLX-α crossover operator.
It is noted from Fig. 3 that e1 and e2 will lie between u min and u max , the variable’s lower and upper bound respectively. ‘α’ is a varying parameter that decides the degrees of exploration and exploitation associated with the crossover operation. All values of α ≤ 0 will show a tendency for the particle to converge toward values in the center of their ranges, producing low diversity levels in the population and inducing a possible premature convergence toward non-optimal solutions. All values of α ≤ 0.5 represents a balanced relationship between the convergence (exploitation) and divergence (exploration), since the probability that an offspring will lie outside its parents becomes
110 P. G. Kumar, C. Rani & S. N. Deepa
equal to the probability that it will lie between its parents. In this paper, the value of α is taken as 0.5. An important feature of this type of crossover is that it is a neighborhood based crossover operator that produces offspring through relaxed exploitation intervals. Another interesting feature is that the created point depends on the location of both parents. If both parents are close to each other, the new point will also be close to the parents. On the other hand, if parents are far from each other, the search is more like a random search. After applying this crossover, the fitness of the individual best position is compared with that of the two offspring, and the best one is taken as the new individual best position. Thus the crossover can help the particles jump out of the local optimization by sharing the others’ information and prevents trapping to a local optimal value. 4.2. Non-uniform mutation Mutation is a varying operator that randomly changes the values at one or more positions of the selected particle. In spite of the several existing mutation methodologies, Nonuniform mutation40,41 is used, since it has the higher probability of making far long jumps at the early stage and much better local fine-tuning ability at the later stage. For each particle X it = x1 , x2 ,..., xm in the swarm of t-th iteration, an offspring t +1 X i = x1' , x2' , ..., xm is produced using Non-uniform mutation operation as below:
{
}
{
}
x + ∆(t ,UB − xk ), if a random ξ is 0 xk' = k xk + ∆(t , xk − LB ), if a random ξ is1
(7)
where LB and UB are the lower and upper bounds of the variables xk. The function ∆ (t , y ) returns a value in the range [0,y] such that ∆ (t , y ) approaches zero as t increases. This property causes this operator to search the space uniformly initially (when t is small), and very locally at later stages. This strategy increases the probability of generating a new number close to its successor than a random choice. The function ∆ (t , y ) is evaluated as below: b t 1− T ∆(t , y ) = y .1 − r (8) where r is a random number from [0,1], T is the maximum iteration, b is a system parameter determining the degree of dependency on the iteration number. With the addition of the mutation method just described, the jumping steps are so long during the initial stage so that it almost covers the whole search space. Further the greedy idea and the idea of mutating a single component of the individual vector rather than modifying all the components incorporated into this operation avoids possible random jumps and ensures that the search always stays at the promising area. Thus the swarm may find new individual best and the global best which leads particle fly toward good direction and thus enhances the probability to find the good global best solution.
Formation of Fuzzy If-Then Rules and Membership Function 111
5. Enhanced PSO Implementation While designing an FRBCS using the Enhanced PSO; the following issues are to be addressed: • Representation • Fitness function formation 5.1. Representation The first important consideration in EPSO is the representation strategy to be followed. A fuzzy system is specified only when the rule set and the membership function associated with each fuzzy set are specified. A typical particle’s position in the swarm will be as shown in Fig. 4: 0 1 2... 3 1 1 1 3… 2 4 … 0 3 2… 3 2 R I1 I2 In O R I1 I2 In O R I1 I2 In O Rule 1 Rule 2 Rule MNR 5.6,6.1,7.0 2.6,3.2,3.8 2.4,3.9,5.4 … 0.3,0.6,0.9 1.2,1.5,1.8 2.4,2.7,3.1 L M H L M H Input 1
Input n
Fig. 4. Representation of single particle’s position in the swarm.
Membership Grade
As shown in Fig. 3, each rule in the rule set has three sections: rule selection (‘R’), representation for the input variables (antecedent – I1, I2… In) and the representation for the output classes (consequent – ‘O’). Rule selection may take either ‘1’ to select the rule otherwise ‘0’. Each antecedent part may take an integer value ranges from 1 to 3 such that ‘1’ represents “low”, ‘2’ represents “medium”, ‘3’ represents “high”. The output class is also represented by an integer value whose range depends on the number of class label. The term ‘MNR’ denotes maximum number of rules. To represent membership function, the range of each input variable is partitioned into three areas (Low, Medium and High) determined by fuzzy sets as shown in Fig. 5.
P1
P5
P2
P4
P3
P8
P7
P6
Variable Range
Fig. 5. Fuzzy space with 3 labels per variable.
P9
112 P. G. Kumar, C. Rani & S. N. Deepa
Membership grade
A total of nine membership points (P1, P2, P3, P4, P5, P6, P7, P8, P9) are required for representing each input variable as a fuzzy set. In that nine points, first and last points (P1 and P9) are fixed that are the minimum and maximum of the input variable. The remaining seven membership points are evolved between the dynamic range such that P2 has [P1,P9], P3 has [P2,P9], P4 has [P2,P3], P5 has [P4,P9], P6 has [P5,P9], P7 has [P5,P6] and P8 has [P7,P9] as limits.
P1
P2
P8
P5
P4
P3
P7
P6
P11
P10
P9
P14
P13
P15
P12
Variable Range
Fig. 6. Fuzzy space with 5 labels per variable.
As an extension of the above method if five fuzzy sets are used to represent each variable as shown in Fig. 6, then a total of fifteen membership points (P1, P2, P3, P4, P5, P6, P7, P8, P9, P10, P11, P12, P13, P14, P15) are required and has limits as discussed for the three fuzzy sets. This type of representation is simpler and can be extended to any number of fuzzy sets. 5.2. Fitness function The next important consideration following the representation is the choice of fitness function. Evaluation of the individuals in the population is accomplished by calculating the objective function value for the problem using the parameter set. The result of the objective function calculation is used to calculate the fitness value of the individual. In the classification problem under consideration, there are two objectives; one is to maximize the correctly classified data and the other one is to minimize the number of rules. These two objectives are conflicting objectives and it is impossible to simultaneously optimize these objectives. Even though, accuracy maximization and complexity minimization of FRBCS can be solved using multi-criterion optimization methods42,43 this work tries to improve the accuracy of the FRBCS at the cost of their interpretability as a single objective optimization problem. Hence, the first objective of maximizing the correctly classified data is reformulated as minimizing the difference between total number of samples and the correctly classified data. For this, a pre-specified positive constant if required may be added as a rule of thumb to strengthen the smaller quantity in the single objective function.
Formation of Fuzzy If-Then Rules and Membership Function 113
Given the total number of samples (‘S’) and the maximum number of rules (‘MNR’), the task is to find out the difference between ‘S’ and the correctly classified data (‘Cc’) for the selected number of rules(‘SNR’) of every EPSO run. During the EPSO run, the objective is to find out the minimum of the above said value. This is mathematically represented as, Min f = (S − Cc ) + (k × SN R ) (9) where ‘k’ is a constant introduced to amplify ‘SNR’ whose value is usually small. In this paper, the value of ‘k’ is taken as 5. In general, PSO searches for a solution with maximum fitness function value. Hence, the minimization objective function given by (10) is transformed to a fitness function to be maximized as K Fitness = (10) f where ‘K’ is another constant used to amplify (1/ f ), the value of which is usually small; so that the fitness value of the chromosome will be in a wider range. In this paper, the value of ‘K’ is taken as 1000. 6. Simulation Result This section presents the details of the simulation carried out on ten benchmark datasets available in the UCI machine learning repository.33 The details of the dataset are given in Table 1. It shows, for each dataset, the area, the number of attributes, type of each attribute, the number of classes, total number of samples and the number of class wise samples. Table 1. Details of dataset used. Area
Life Science
Physical Science
Dataset Name # Attributes Breast Cancer Pima Indians Diabetes Iris
10 8
Attribute Types
Total # Classes # Samples
2
768
500,268
4
All are Integer Integer (1,2,3,4,5,8) Real (6,7) All are Real
3
150
Ecoli
8
All are Real
8
336
Yeast
8
All are Real
10
1484
50,50,50 143,77,52, 35,20,5,2,2 463, 429, 244, 163, 51, 44, 37, 30, 20, 5
Magic Gamma 11 Telescope
All are Real
2
19020
12332, 6688
Wine
13
Integer(1,6,13) Real(2,3,4,5,7,8,9, 10,11,12)
3
178
59, 71, 48
Glass Identification
9
All are Real
6
214
70,17,76, 13,9,29
2
690
307,383
5
5473
4913, 329, 28, 88, 115
Financial
Credit Approval
14
Computer
Page Blocks Classification
10
Categorical (1,4,5,6,7,9,10,12,13) Integer (3,11,14) Real (2,8) Integer (1,2,3,8,9,10) Real (4,5,6,7)
2
699
Class wise # Samples 458,241
114 P. G. Kumar, C. Rani & S. N. Deepa
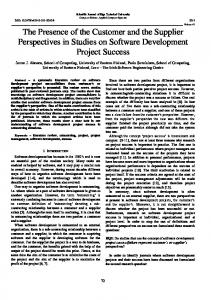
The proposed approach is developed using Matlab R2009 and executed in a PC with Pentium IV processor with 2.40 GHz speed and 256 MB of RAM. Experiments are conducted to demonstrate the effectiveness of the proposed approach in the formation of rule base and membership function. The details of the simulation and the performance of the classifier for the Wine data are presented here. The wine data contains the chemical analysis of 178 wines with 13 input variables and 3 output classes. As shown in Fig. 4, each input variable of the wine data is represented by three fuzzy sets namely, “low”, “medium” and “high”. Trapezoidal membership function is used to represent the “low” and “high” fuzzy sets. Triangular membership function is used to represent the “medium” fuzzy set. Seven points are required to represent an input variable and hence a total of ninety one (13×7 = 91) membership function points are needed. Each rule for a wine data set requires fifteen integer numbers (1 for rule selection +13 for input variables + 1 for output class). A maximum of six rules are included and hence a total of ninety integer numbers (6×15 = 90) are needed to represent the complete rule set. First the learning ability of the proposed EPSO is examined by using all the 178 samples of wine data as training patterns. The proposed approach is run with 30 independent trials with different values of random seeds and control parameters. The optimal results are obtained with the following setting: Max. Iteration Swarm Size Wmin - Wmax C1 and C2 Crossover probability Mutation probability
: 5000 : 30 : 0.4 – 0.9 : 2 and 2 : 0.9 : 0.1
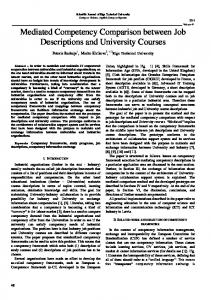
With the above setting the convergence characteristics of the proposed EPSO in designing the FRBCS is analyzed. Figure 7 shows the convergence of the proposed EPSO for wine data set. It is found that the proposed EPSO have sharp increase in the fitness value for the first eight hundred generations. After that the proposed EPSO has drastic improvement in its fitness value up to thousand generations and above that it reaches the optimal value. Accordingly the average and worst fitness value also show considerable improvement in each generation. During the course of run, the ranges of each membership function points are evolved and tuned at the same time. After 1000 iterations, the points of membership function tuned by the proposed EPSO have begun to distribute uniformly over the range of the variables with halfway overlap between them. The optimal membership function formed by the proposed EPSO for the input variable ‘Magnesium’ of wine dataset is shown in Fig. 8.
Formation of Fuzzy If-Then Rules and Membership Function 115
7
6
Fitness
5
4
Worst Average Best
3
2
1
0 0
500
1000
1500
2000
2500 3000 Iterations
3500
4000
4500
5000
Fig. 7. Convergence of proposed EPSO for wine dataset.
Input Varibale: Magnesium of Wine dataset 1 0.9 0.8
Membership Grade
0.7 0.6 0.5 0.4 0.3 0.2 0.1 0 70
80
90
100
110 120 130 Variable Range
140
150
160
170
Fig. 8. Optimal membership function.
It is seen that each fuzzy set is distinguishable from one another and can be easily assigned a linguistic label (low, medium and high). This corroborates the usefulness of the proposed EPSO in obtaining interpretable FRBCS. The three near optimal rules evolved by the proposed EPSO for wine data set are given below. R1. If color intensity is low, non-flavanoid phenols is high and malic acid is medium then it is wine 1. R2. If magnesium is medium, malic acid is low and color intensity is high then it is wine 2. R3. If ash is low, alcohol is medium and color intensity is high then it is wine 3.
116 P. G. Kumar, C. Rani & S. N. Deepa
From the rule set evolved by the proposed approach for wine data set, it is substantiated that the EPSO simplifies the description of each rule by eliminating the irrelevant variables and involved only few input variables that has reasonable significance in producing the output. Next, cross validation is performed for examining the generalization ability of the proposed EPSO method. Among the cross validation methods such as holdout, k-fold, leave-one-out, monte-carlo and bootstrap, Leave-One-Out Cross-Validation (LOOCV)44 is preferred by the author since most of data sets are highly imbalanced and effective splitting of the same for applying other kinds of cross validation method is a difficult task. The LOOCV procedure works as by dividing all samples into K subsets randomly, where K is the total number of samples. Then K-1 subsets are used to train the model and the remaining Kth sample is used for testing. This procedure is repeated for K times such that each sample is given a chance for testing the performance. The LOOCV accuracy is calculated using nCc LOOCV Accuracy = (11) K For wine data set, all the 178 samples were divided into 177 samples for finding the optimal membership function and the rule set and a single sample for testing the performance of the designed fuzzy system. This procedure is iterated 178 times so that each sample is used for evaluating the performance of obtained membership function and rule set. Similarly for other data sets also, the fuzzy rule based classifier model is developed using the proposed approach and its generalization performance are analyzed. In Table 2, the results of the proposed EPSO for all data sets in terms of Number of Iterations (#I), Number of Rules (#R), Number of Variables (#V), Percentage of Correctly Classified data (%CC), Percentage of Incorrectly Classified data (%IC), and Percentage of Unclassified data (% UC) are reported. Table 2. Performance of the proposed EPSO. Data Sets Wine Breast Cancer Pima Iris Ecoli Yeast Telescope Glass Credit Page Blocks
#I 1168 2516 3179 326 874 2856 4731 483 1832 3572
#R 3.1 3.05 3.2 2.9 8.4 10.5 4.3 6.2 3.5 5.6
#V 6.25 5.76 4.56 2.31 5.14 6.26 5.85 4.94 8.43 6.29
%CC 99.9 97.83 96.15 99.9 95.12 94.56 93.16 96.4 98.38 97.42
%IC 0 0.14 0.18 0.07 0.19 0.25 0.28 0.12 0.06 0.09
%UC 0.1 2.03 3.67 0.03 4.69 5.19 6.56 3.48 1.56 2.49
It is inferred from the results that the proposed EPSO works well in fine tuning the solution variable thereby results in better classification accuracy using smaller number of rules. It is understood that the incorporation of the crossover and mutation helps the PSO
Formation of Fuzzy If-Then Rules and Membership Function 117
in avoiding the problem of premature convergence and local minima since it obtains the higher performance with compact (minimum number of variables) rule set in satisfactory number of iterations. Further it is observed that proposed EPSO has very minimum incorrectly classified samples for all the data sets which clearly depict the suitability of the proposed approach in designing a fuzzy rule based system for data classification. In Table 3, the name of the selected variable, number of the membership function (#MF) and their labels are reported for all the data sets. During the run, the proposed EPSO tune the membership function of each variable resulting in selection of minimum number of variables with fewer number of membership ship function for each variable. More over the linguistic label obtained for each variable is evident and complete. Further the system is compact as the average number of membership function obtained for a data set is minimum (varies from 1.33 to 2.5). It is 1.33 for wine, 1.8 for credit and page blocks, 2 for Pima, 2.2 for breast cancer, e-coli, yeast, telescope and glass, and 2.5 for iris respectively. Coverage and accuracy are the two measures of assessing a rule ‘R’ in the rule set and it is calculated using N Coverage ( R) = cov ers (12) S N Accuracy ( R) = correct (13) N cov ers where ‘Ncovers’ is the number of samples covered by ‘R’ from the total number of samples ‘S’, and ‘Ncorrect’ is the number of samples correctly classified by ‘R’ from ‘Ncovers’. The performance of near optimal rule set obtained for every data set using the proposed EPSO is evaluated by allowing each rule at a time to perform classification of all the samples of a data set and the readings are given in Table 4. It is found that most of the rules in a rule set produce good accuracy for the sample it covers. The measure of coverage computed for each rule indicates that the rules are exclusive with each other and cover sufficient number of samples. Further the overlapping among the rules in a rule set is minimum due to the use of AND operation within the attributes and is more comprehensive. To compare the performance of the proposed approach with the existing approaches, simulation is carried out using Hybrid Genetic Based Machine Learning (HGBML)45, Genetic Algorithm-Gradient (GAGRAD)46, Mixed Genetic Algorithm (MGA)47, Real coded Genetic Algorithm (RGA), Particle Swarm Optimization (PSO). HGBML combines Michigan and Pittsburgh approach for learning fuzzy rule-based system. The former is used for generating good fuzzy rules while the latter is used for finding good combinations of generated fuzzy rules. The GAGRAD algorithm considers two trapezoidal fuzzy sets per variable and represents a set of rules by a constrained neural network. It refines the system in two steps. The first step is the rule set optimization by means of a GA and the second one is a gradient based local optimization of the fuzzy sets.
118 P. G. Kumar, C. Rani & S. N. Deepa Table 3. Details of selected variable that forms the data base. Datasets
Wine
Breast Cancer
Pima
Iris
Ecoli
Yeast
Telescope
Glass
Credit
Page Blocks
Variable Name color intensity non-flavanoid phenols malic acid magnesium ash alcohol area smoothness concavity convex points fractal dimension Plasma glucose Diastolic blood pressure 2-Hour serum insulin Diabetes pedigree function Sepal Length Petal Length mcg gvh lip alm1 alm2 gvh alm erl pox vac nuc fSize fConc fAsym fAlpha fDist RI Mg Si Ca Fe A2 A3 A5 A6 A7 A10 A13 A14 area eccen mean_tr blackpix blackand wb_trans
#MF 2 1 2 1 1 1 2 2 2 2 3 2 2 2 2 2 3 2 2 2 2 3 3 2 3 2 2 1 2 2 1 3 3 2 2 3 2 2 2 1 2 2 3 2 2 1 3 2 2 2 1 1
Labels low, high high low, medium medium low medium medium, high low, medium low, high medium, high low, medium, high low, medium medium, high low, high medium, high medium, high low, medium, high low, high medium, high low, high low, medium low, medium, high low, medium, high low, high low, medium, high low, high medium, high high low, high medium, high medium low, medium, high low, medium, high low, medium low, high low, medium, high medium, high medium, high low, high low medium, high low, high low, medium, high low, high medium, high low low, medium, high low, high medium, high low, medium medium medium
Formation of Fuzzy If-Then Rules and Membership Function 119 Table 4. Performance of rule sets in all the data sets. Data Set Wine Breast Cancer Pima Indians Diabetes Iris
Ecoli
Yeast
Magic Gamma Telescope
Glass Identification
Credit Approval
Page Block Classification
Rule set
Ncovers
Ncorrect
Coverage
Accuracy
R1 R2 R3 R1 R2 R3 R1 R2 R3 R1 R2 R3 R1 R2 R3 R4 R5 R6 R7 R8 R1 R2 R3 R4 R5 R6 R7 R8 R9 R10 R1 R2 R3 R4 R1 R2 R3 R4 R5 R6 R1 R2 R3 R4 R1 R2 R3 R4 R5
59 71 48 252 206 241 256 244 268 50 50 50 143 77 52 35 20 5 2 2 463 429 244 163 51 44 37 30 20 5 6160 6172 3340 3348 70 17 76 13 9 29 149 158 181 202 4913 329 28 88 115
59 71 48 251 205 240 254 242 266 50 50 50 143 77 51 34 20 5 1 1 463 429 244 163 51 44 37 29 20 4 6158 6169 3339 3347 70 17 76 12 8 29 148 157 180 201 4913 327 25 88 113
33.14 39.88 26.96 36.05 29.47 34.47 33.33 31.77 34.89 33.33 33.33 33.33 42.55 22.91 15.47 10.41 5.95 1.48 0.59 0.59 31.19 28.90 16.44 10.98 3.43 2.96
100 100 100 99.60 99.51 99.58 99.21 99.18 99.25 100 100 100 100 100 98.07 97.14 100 100 50 50 100 100 100 100 100 100
2.49 2.02 1.34 0.33 32.38 32.45 17.56 17.60 32.71 7.94 35.51 6.07 4.20 13.55 21.59 22.89 26.23 29.27 89.76 6.01 0.51 1.60 2.10
100 96.66 100 80 99.96 99.95 99.97 99.97 100 100 100 92.30 88.88 100 99.32 99.36 99.44 99.50 100 99.39 89.28 100 98.26
120 P. G. Kumar, C. Rani & S. N. Deepa
In MGA, the membership functions are represented as real numbers and the fuzzy rules are represented as binary string. With this mixed form of representation, tournament selection is applied for both rule set and membership function. For the rule set two-point crossover, gene cross swap operator and bit-wise mutation are applied. For membership function arithmetic crossover and uniform mutation is applied. In RGA both the membership function and rule set are represented using real numbers. Elitism, tournament selection, BLX-α crossover and non-uniform mutation are applied. PSO also represents the solution variable as that of RGA and only the standard velocity and position updation operation is applied to find the near optimal rule set and membership functions. The parameter settings of these approaches are given in Table 5. Table 5. Settings of control parameter of approaches considered for comparison. Control Parameter Population size Generations Crossover probability Mutation probability Swap Probability Tournament Size Number of fuzzy rules Number of rule sets Number of replaced rules Activation function Weights Power of approximation No. of hidden layer
HGBML 200 1000 0.9 1/n ----10 or 20 1 and 200 2 or 4 Squashing 0 or 1 2 to 101 1
GAGRAD 100 100 0.6 0.02 -------------------
MGA 30 300 0.8 0.05 --2 ---------------
RGA 30 1000 0.9 0.07 0.02 2 ---------------
PSO 30 1000 -----------------------
In Table 6, numbers of rules, number of variables, mean MF for input variables of a data set (µMF), mean coverage of rules of a data set (µC), overall percentage of classification accuracy are reported for the methods studied for performance comparison. This comparison study reveals that the number of rules and variables are comparatively low for the proposed EPSO than the other approaches. Further the classification accuracy is comparable with the other approaches. For most of the data sets, all the approaches obtain good result but our approach achieved the same with minimum number of variables and membership function label in each rule. This shows that the rules produced by the EPSO are compact and accurate. The comparison made between RGA and PSO with the EPSO demonstrate the power of the genetic operators and their usefulness in avoiding local minima and premature convergence. It is noticed that there is no significant difference in the coverage value of the rule set among the different approaches with our approach. Every approach reported in Table 6, tried to produce the minimum rules which covers majority of samples but our approach achieved the same and it is comparatively greater than the others.
Formation of Fuzzy If-Then Rules and Membership Function 121 Table 6. Results obtained by the studied methods for comparison. Approach
HGBML
GAGRAD
MGA
RGA
PSO
EPSO
Metrics #R µC #V µMF %CC #R µC #V µMF %CC #R µC #V µMF %CC #R µC #V µMF %CC #R µC #V µMF %CC #R µC #V µMF %CC
Wine 20 25.8 11.1 7.8 99.6 3.4 25.5 9.8 5.53 95 5.8 28.2 10 3.7 96.7 4.2 29.5 9.3 2.23 96.6 3.8 27.5 7.5 1.8 98.5 3.1 33.3 6.3 1.3 99.9
Breast 10 25.8 10.6 5.7 92.3 6.7 25.5 9.3 5.6 96.4 8.8 28.2 9.5 4.6 99 7.2 29.5 8.8 3.1 95.1 6.4 27.5 7 2.7 96.2 3.1 33.3 5.8 2.2 97.83
Pima 10 25.8 9.36 8.2 91.5 7.2 25.5 8.1 4.3 94.8 10 28.2 8.3 4.4 93 8.4 29.5 7.6 2.9 95.8 6.7 27.5 5.8 2.5 96.1 3.2 33.3 4.6 2 96.15
Iris 20 25.8 4 5.1 99.2 3.2 25.5 4 5.2 96 3 28.2 4.0 4.9 99.7 3.4 29.5 4 3.4 99.8 3.1 27.5 3.5 3 99.8 2.9 33.3 2.3 2.5 99.9
Ecoli 20 5 9.9 8.3 95.4 12.7 4.7 8.6 5.7 93.4 14.7 7.4 8.8 4.6 95.6 13 8.7 8.2 3.1 92.5 12 6.7 6.3 2.7 93.2 8.4 12.5 5.1 2.2 95.12
Yeast 10 2.51 11.1 7.5 93.2 12.3 2.2 9.8 6.1 94.3 18.1 4.9 10 4.6 93.7 17 6.21 9.3 3.1 96.4 15 4.21 7.5 2.7 95.7 11 10 6.3 2.2 94.56
Teles 10 17.5 10.7 6.3 90.8 5.7 17.2 9.4 7.2 94.4 10.2 19.9 9.6 4.6 91.3 8.6 21.2 8.9 3.1 95.8 6.3 19.2 7.1 2.7 94.2 4.3 25 5.9 2.2 93.16
Glass 20 9.1 9.7 9.4 91.4 8.4 8.9 8.4 4.8 93.7 12.4 11.6 8.6 4.6 84.5 11 12.8 8 3.1 92 8.5 10.8 6.1 2.7 94.9 6.2 16.6 4.9 2.2 96.4
Credit 20 17.5 13.2 6.5 95.4 4.7 17.2 12 3.8 93.8 10.1 19.9 12.1 4.2 94.9 8.5 21.2 11.5 2.7 97.2 5.2 19.2 9.6 2.3 97.6 3.5 25 8.4 1.8 98.38
Page 10 12.5 11.1 5.3 93.5 8.9 12.2 9.8 3.2 94.3 11.2 14.9 10 4.2 91.8 9.6 16.2 9.3 2.7 95.5 7.6 14.2 7.5 2.3 95.8 5.6 20 6.3 1.8 97.42
In order to assess whether significant differences exist among the results of various approaches with the proposed approach, Wilcoxon’s signed-rank test48 is employed and it is reported in Table 7. Wilcoxon’s test is based on computing the differences between two sample means obtained by a pair of different algorithms on different datasets. Table 7. Results of Wilcoxon’s signed-rank test. Comparison HGBML Vs EPSO GAGRAD Vs EPSO MGA Vs EPSO RGA Vs EPSO PSO Vs EPSO
R+ 1 2 6 11 9
R− 54 53 49 44 46
Hypothesis (α = 0.1) Rejected Rejected Rejected Rejected Rejected
ρ value 0.0074 0.0102 0.03 0.0969 0.0629
R+ denotes the sum of ranks for the datasets on which the first approach do better than the second and R− denotes the ranks for contrary result. The null hypothesis associated with the Wilcoxon’s test is rejected, since ρ < α in all the cases in favor of EPSO due to difference between R+ and R− . It seems that the incorporation of genetic operators into
122 P. G. Kumar, C. Rani & S. N. Deepa
PSO is able to provide some kind of improvement in the performance than the other approaches. It can be concluded that performing crossover and mutation operation in addition to the standard PSO operation tune the membership function and form the rule set efficiently and obtain better classifier with comparatively less complexity than some previous approaches. Statistical evaluation of experimental results is considered an essential part of validation of new machine learning methods. For comparing the performance of the proposed algorithm with other algorithms on multiple data sets, Receiver Operating Characteristic (ROC) analysis49 is performed. ROC graphs are useful technique for organizing classifiers and visualizing their performance. Table 8 gives the value of Area under ROC Curve (AUC) for different approaches. Table 8. Statistical comparison of proposed EPSO with other approaches. HGBML
GAGRAD
MGA
RGA
PSO
EPSO
Wine
DATA SETS
0.705(6)
0.715 (5)
0.731(3)
0.731(3)
0.745(2)
0.758(1)
Breast Cancer
0.652(3)
0.612 (5)
0.588(6)
0.638(4)
0.692(2)
0.917(1)
Pima Indians Diabetes
0.362(6)
0.374(5)
0.414(3)
0.412(4)
0.768(1)
0.454(2)
Iris
0.379(4)
0.379 (4)
0.385(3)
0.399(2)
0.419(1)
0.399(2)
Ecoli
0.518(6)
0.543(5)
0.964(1)
0.568(4)
0.623(2)
0.583(3)
Yeast
0.889(1)
0.634(4)
0.584(4)
0.634(4)
0.712(2)
0.672 (3)
Magic Gamma Telescope
0.426(5)
0.484(4)
0.564(2)
0.524(3)
0.376(6)
0.638(1)
Glass Identification
0.847(3)
0.887(2)
0.699(6)
0.749(5)
0.807(4)
0.946(1)
Credit Approval
0.458(3)
0.418(4)
0.319(6)
0.614(1)
0.369(5)
0.498(2)
Page Blocks Classification
0.308(4)
0.268(6)
0.275(5)
0.325(3)
0.348(2)
0.441(1)
3.9
3.3
2.7
Average Rank
4.1
4.4
1.7
From this statistical analysis, it is found that proposed EPSO has the ability to provide a richer measure of classification performance with compact rule set in designing the fuzzy rule based system for all the ten data sets. Table 9 gives the comparison of results obtained by the proposed approach with the already published results for some popular data sets. Table 9. Performance comparison of proposed EPSO with other approaches in the literature. Approach
Wine
Breast
Pima
Iris
Ecoli
Yeast
Telescope
Glass
Page
94.33
96.05
72.39
94.67
71.45
−
75.08
59.86
91.42
FHGBML-IVFS
90.97
95.75
75
96
72.91
−
79.18
57.94
94.16
FHGBML-ND51
96.08
−
−
94.67
81.55
58.96
−
62.19
95.62
SLAVE-ND51
96.05
−
−
96.67
79.46
56.13
−
56.07
93.61
Product/1-ALLTUN 52
93.03
96.35
77.05
97.33
−
−
−
71.28
−
95.10
−
74.37
97.56
77.72
48.56
79.82
65.33
91.23
99.9
97.83
96.15
99.9
95.12
94.56
93.16
96.4
97.42
50
Chi-IVFS
50
GP-COACH
53
Proposed EPSO
Formation of Fuzzy If-Then Rules and Membership Function 123
From this table, it is clear that the incorporation of genetic operator like crossover and mutation into PSO enhanced the performance of fuzzy classifier and outperforms the results of some of the existing classifier in the literature. 7. Conclusion Data Classification using the knowledge extracted from the data is a complex data mining problem. This paper has proposed a hybrid form of particle swarm optimization for classification rule discovery and tuning of membership function for fuzzy logic based classifier model. BLX-α crossover and Non-uniform mutation from genetic algorithm is incorporated in addition to standard velocity and position updating operations of PSO. The performance of the proposed EPSO is tested using ten publicly available bench mark data sets. From the simulation result it is observed that incorporation of crossover operation rapidly increase the performance of PSO and prevents trapping to a local optimal value. Further the addition of the mutation operation enhances the probability to find the global best solution thereby allows faster convergence. For all the data sets, the proposed approach generated a compact fuzzy system with high classification accuracy than the other approaches reported in the literature. Acknowledgement The authors are very much grateful to the reviewers’ highly valuable comments and suggestion that improved the manuscript.
References 1. J. Han and M. Kamber, Data Mining: Concepts and Techniques, (Morgan Kaufmann, 2006). 2. A. Demirkol, Z. Demir and E. Emre, A New Classification Approach using Discriminant Functions, Information Science and Engineering 21 (2005) 819−828. 3. B. Krishnapuram, A. J. Hartemink, L. Carin, M. A. Figueiredo, A bayesian approach to joint feature selection and classifier design, IEEE Trans Pattern Anal Mach Intell. 26(9) (2004) 1105−1111. 4. C. C. Holmes, N. M. Adams, A probabilistic nearest neighbor method for statistical pattern recognition, Journal of the Royal Statistical Society 64(2) (2002) 295−306. 5. G. P. Zhang, Neural Networks for data classification: A Survey, IEEE Trans on System Man and Cybernetics − Part C: Application and Reviews 30(4) (2000) 451−462. 6. S. Osowski, L. T. Hoai and T. Arkiewicz, Support vector machine-based expert system for reliable heartbeat recognition, IEEE Trans Biomed Eng. 51 (2004) 582−589. 7. A. C. Tan, D. Q. Naiman, L. Xu, R. L.Winslow and D. Geman, Simple decision rules for classifying human cancers from gene expression profiles, Bioinformatics 21 (2005), 3896– 3904. 8. S. Salvador, P. Chan and J. Brodie, Learning States and Rules for Time Series Anomaly Detection, Technical Report, CS-2003-05, Dept. of Computer Sciences, Florida Institute of Technology. 9. H. Ishibuchi, K. Nozaki and H. Tanaka, Distributed representation of fuzzy rules and its application to pattern classification, Fuzzy Sets System 52 (1992) 21−32.
124 P. G. Kumar, C. Rani & S. N. Deepa
10. S. Abe and M. S. Lan, A Method for fuzzy rule extraction directly from numerical data and its application to pattern classification, IEEE Transaction on Fuzzy System 3 (1995) 18−28. 11. H. Ishibuchi, K. Nozaki, N. Yamamoto and H. Tanaka, Selecting fuzzy if-then rules for classification problems using genetic algorithms, IEEE Trans. Fuzzy System 3 (1995) 260−270. 12. C. H. Wang, T. Hong and S. Tseng, Integrating fuzzy knowledge by genetic algorithms, IEEE Trans. Evolutionary Computation 2(4) (1998) 138−148. 13. S. Yuhui, E. Russell, C. Yaobin, Implementation of evolutionary fuzzy system, IEEE Trans. Fuzzy System 7(2) (1999) 109−119. 14. M. Setnes and H. Roubos, GA-Fuzzy modeling and classification: Complexity and performance, IEEE Trans. Fuzzy Systems 8(5) (2000) 509−522. 15. M. Russo, Genetic fuzzy learning, IEEE Trans. Evolutionary Computation 4(3) (2000) 259−273. 16. O. Cordon, F. Herrera and P. Villar, Generating the knowledge base of a fuzzy rule-based system by the genetic learning of the data base, IEEE Trans. on Fuzzy Systems 9(4) (2001) 667−674. 17. J. Abonyi, J. Roubos and F. Szeifert, Data driven generation of compact, accurate, and linguistically-sound fuzzy classifiers based on decision tree initialization, Int. J. Approx. Reasoning 32(1) (2003) 1−21. 18. S. Y. Ho, H. M. Chen, S. J. Ho and T K. Chen, Design of accurate classifiers with a compact fuzzy-rule base using an evolutionary scatter partition of feature space, IEEE Trans. Syst. Man Cybern. Part B. 34 (2) (2004) 1031–1044. 19. X. G. Chang and J. H. Lilly, Evolutionary design of a fuzzy classifier from data, IEEE Trans. Syst. Man Cybern. Part B. 34 (3) (2004) 1894–1906. 20. E. Zhou and A. Khotanzad, Fuzzy classifier design using genetic algorithms, Pattern Recognition. 40 (2007) 3401–3414. 21. P. Pulkkinen and H. Koivisto, Identification of interpretable and accurate fuzzy classifiers and function estimators with hybrid methods, Applied Soft Computing 7 (2007) 520–533. 22. H. Ishibuchi and Y. Nojima, Analysis of interpretability-accuracy tradeoff of fuzzy systems by multi objective fuzzy genetics-based machine learning, International Journal of Approximate Reasoning 44 (2007) 4−31. 23. R. Alcala, M. J. Gacto and F. Herrera, A multi-objective genetic algorithm for tuning and rule selection to obtain accurate and compact linguistic fuzzy rule-based systems, International Journal of Uncertainty, Fuzziness and Knowledge-Based Systems 15(5) (2007) 539−557. 24. F. Herrera, Genetic fuzzy systems: taxonomy, current research trends and prospects, Evol. Intel. 1 (2008) 27–46. 25. J. Kennedy, R. C. Eberhart and Y. Shi, Swarm Intelligence (Morgan Kaufman, San Francisco, 2001). 26. L. dos Santos Coeho and B. Herrera, Fuzzy identification based on a chaotic particle swarm optimization approach applied to a nonlinear yo-yo motion system, IEEE Trans. Industrial Electronics 54(6) (2007) 3234−3245. 27. T. Hussein, A. Elshafei, and A. Bajhgat, Comparison between multi-band and self-tuned fuzzy power system stabilizers, Proc. 16th Mediter. Conf. Contol Autom. (2008), pp. 374−379. 28. G. K. Venayagamoorthy, L. L. Grant and S. Doctor, Collective robotic search using hybrid techniques: fuzzy logic and swarm intelligence inspired by nature, Eng. Appl. Artif. Intell. 22(3) (2009) 431−441. 29. R. P. Prado, S. Garcia Galan, J. E. Munoz Exposito and A. J. Yuste, Knowledge acquisition in fuzzy rule based systems with particle swarm optimization, IEEE Trans. Fuzzy System 18(6) (2010) 1083−1097. 30. C. C. Chen, Design of PSO-based fuzzy classification systems, Tamkang Journal of Science and Engineering 9(1) (2006) 63−70.
Formation of Fuzzy If-Then Rules and Membership Function 125
31. Y. Valle, G. K. Venayagamoorthy, S. Mohagheghi, J. Hernandez, R. G. Harley, Particle swarm optimization: Basic concepts, variants and applications in power systems, IEEE Trans. Evolutionary Computation 12(2) (2008) 171−195. 32. S. N. Sivanandam, S. N. Deepa, Introduction to Genetic Algorithms (Springer, Berlin, 2007). 33. A. Asuncion, D. J. Newman, UCI machine learning repository. http://www.ics.uci.edu/ *mlearn/MLRepository.html (2007). 34. R. O. Duda, P. E. Hart and D. G. Stork, Pattern Classification (Wiley-Interscience, 2000). 35. O. Cordón, F. Herrera, F. Hoffmann, L. Magdalena, Genetic fuzzy systems, Evolutionary Tuning and Learning of Fuzzy Knowledge Bases (World Scientific, Singapore, 2001). 36. D. Boeringer and D. Werner, Particle swarm optimization versus genetic algorithms for phased array synthesis, IEEE Trans. Antennas Propagat. 52(3) (2004) 771–779. 37. Y. Shi, Feature article on particle swarm optimization, IEEE Neural Network Society (2004) 8–13. 38. F. Herrera, M. Lazano and A. M. Sanchez, A taxonomy for the crossover operator for realcoded genetic algorithms: An experimental study, Int. J. Intelligent Systems 18 (2003) 309−338. 39. S. Morales-Ortigosa, A. Orriols-Puig and E. Bernado-Mansilla, New crossover operator for evolutionary rule discovery in XCS, in Proc. Eight Int. Conf. Hybrid Intelligent Systems, 2008, pp. 867−872. 40. Z. Michalewicz, Genetic Algorithms + Data Structures = Evolution Programs, (Springer, Berlin, 1996) 41. X. Zhao, X. S. Gao and Z. C. Hu, Evolutionary Programming based on Non-uniform mutation, Applied Mathematics and Computation 192 (1) (2007) 1−11. 42. R. Alcala, M. J. Gacto and F. Herrera, A multi-objective genetic algorithm for tuning and rule selection to obtain accurate and compact linguistic fuzzy rule based systems, Int. J. Uncertainty, Fuzziness and Knowledge-Based Systems 15(5) (2007) 539−557. 43. H. Ishibuchi, T. Murata and I. B. Turksen, Single-objective and two-objective genetic algorithms for selecting linguistic rules for pattern classification problems. Fuzzy Sets and Systems 89 (1997) 135−150. 44. P. Ganesh Kumar, T. Aruldoss, A. Victore, P. Renukadevi and D. Devaraj, Design of fuzzy expert system for microarray data classification using a novel genetic swarm algorithm, Expert Systems with Applications 39(2) (2011) 1811−1812. 45. H. Ishibuchi, T. Yamamoto and T. Nakashima, Hybridization of fuzzy GBML approaches for pattern classification problems, IEEE Trans. System, Man and Cybernetics B 35(2) (2005) 359−365. 46. J. Dombi and Z. Gera, Rule based fuzzy classification using squashing functions, J. Intelligent & Fuzzy Systems 19(1) (2008) 3−8. 47. D. Devaraj, and P. Ganeshkumar, Mixed genetic algorithm approach for fuzzy classifier design, Int. J. Comput. Intelligence and Applications 9(1) (2010) 49−67. 48. D. Sheskin, Handbook of Parametric and Nonparametric Statistical Procedures (London, U.K./Boca Raton, FL: Chapman & Hall/CRC, 2003) 49. T. Fawcett, An introduction to ROC analysis, Pattern Recogn. Lett. 27 (2006) 861−874. 50. J. A. Sanz, A. Fernandez, H. Bustince and F. Herrera, Improving the performance of fuzzy rule based classification systems with interval valued fuzzy sets and genetic amplitude tuning, Information Sciences 180 (2010) 3674−3685. 51. A. Fernandez, M. Calderon, E. Barrenechea, H. Bustince and F. Herrera, Solving multiclass problems with linguistic fuzzy rule based classification systems based on pairwise learning and preference relations, Fuzzy sets and systems 161 (2010) 3064−3080.
126 P. G. Kumar, C. Rani & S. N. Deepa
52. R. Alcala, Y. Nojima, F. Herrera and H. Ishibuchi, Multiobjective genetic fuzzy rule selection of single granularity-based fuzzy classification rules and its interaction with the lateral tuning of membership functions, Soft Computing, in press (2010). 53. F. J. Berlanga, A. J. Rivera, M. J. del Jesus and F. Herrera, GP-COACH: Genetic programming-based learning of COmpact and ACcurate fuzzy rule-based classification systems for High-dimensional problems, Information Sciences 180 (2010) 1183–1200.