ACES JOURNAL, Vol. 33, No. 4, April 2018
450
FPGA Based Fast Bartlett DoA Estimator for ULA Antenna Using Parallel Computing Fahri M. Unlersen 1, Ercan Yaldiz 2, and Sehabeddin T. Imeci 3 1
Department of Electrical and Electronics Engineering Necmettin Erbakan University, Konya, 42090, Turkey
[email protected]
2
Department of Electrical and Electronics Engineering Selcuk University, Konya, 42031, Turkey
[email protected]
3
Department of Electrical and Electronics Engineering International University of Sarajevo, Ilıdza, 71210, Bosnia and Herzegovina
[email protected] Abstract ─ This paper presents a design and implementation of a structure which uses Bartlett Direction of Arrival (DoA) algorithm and a receiver system on Altera Cyclone IV and Cyclone III FPGAs. First of all, a software defined radio (SDR) that has 4 simultaneous inputs, is designed. All data used in this study are obtained by using this radio system. Then one of the FPGA is configured as antenna simulator and the other one is used for implementing Bartlett DoA estimation algorithm. Bartlett DoA estimation algorithm is developed completely in parallel and compared with a previous study which is performed sequentially on an FPGA using NIOS processor. The designs are tested by using 4-element Uniform Linear Array (ULA) antenna. Implemented hardware is compared in terms of DoA calculation speed and the sources that occupy on the FPGA. Furthermore, the paper has significant improvement in calculation duration thereby achieving lower response latency compared with previously published similar works. Index Terms ─ Bartlett algorithm, direction of arrival estimation, FPGA, parallel computing.
I. INTRODUCTION An antenna array is a system consisted of singular antenna elements that are designed to behave like a single antenna used to receive and/or radiate the electromagnetic waves. These antenna arrays are also known as smart antennas have the ability to estimate Direction of Arrival (DoA) as well as high directivity, high gain, formable radiation pattern features. In addition, having the features to prevent co-channel fading and to
Submitted On: July 31, 2017 Accepted On: April 8, 2018
create low side lobe level (SLL) abilities, interference is reduced by antenna arrays. With the help of these features, the use of antenna arrays on systems such as surveillance radar, ground penetrating radar, sonar, ultrasonic imaging, seismic data processing and medical imaging offers significant advantages [1-5]. Detection of the direction of an incident signal received by an antenna array is called DoA estimation. This bases on process actualized with processing the relative phase difference between incident signals onto antenna elements. DoA estimation is widely used in such applications like mobile communication, radar, and sonar etc. [6]. There are three principles of DoA estimation methods named conventional spectral-based, subspace spectral-based, and statistical methods. The most popular conventional spectral-based methods are Bartlett, Capon, First Order Forward Prediction, Maximum Entropy [7], Deterministic and Stochastic Maximum Likelihood (DML, SML) [8]. The popular subspace spectral-based methods are Multiple Signal Classifying (MUSIC), Min-Norm and Weighted Subspace Fitting (WSF). And the statistical methods are Estimation of Signal Parameters via Rotational Invariance Techniques (ESPRIT), Root-MUSIC and Root-WSF [8-11]. These methods have really long calculation processes. Since operations are performed one after the other in the sequential calculation, the DoA estimation calculations like eigenvalue decomposition in subspace-based methods and covariance calculation operation which is the most common operation in all of the methods, cost huge calculation duration [12]. Because of having the ability of parallel calculation, an FPGA could be employed to solve these DoA Estimation problems much faster than a classical microprocessor.
1054-4887 © ACES
UNLERSEN, YALDIZ, IMECI: FPGA BASED FAST BARTLETT DOA ESTIMATOR FOR ULA ANTENNA
451
Table 1: Comparison of the studies in literature in terms of calculation duration and utilized logic elements Number of Calculation Utilized Logic Ref. Structure / Method Antenna Duration (µs) Elements Sequential / New EVD Structure-based MUSIC [13] 4 ULA 27.64 14609 DoA Estimation Sequential / ROM Based Unitary MUSIC processor [14] 4 ULA 30.59 12007 with spatial smoothing Sequential / ROM Based Unitary MUSIC processor [14] 4 ULA 57.11 12995 without spatial smoothing Sequential / ROM Based Unitary MUSIC processor [14] 8 ULA 373.99 29472 without spatial smoothing Sequential / ARM-Cortex Core microprocessor [15] 8 ULA 2560 based MUSIC DoA Estimator Parallel-Sequential / Butterfly FFT Core based on [16] 8 ULA 33961 DSP48E microprocessor Sequential / A coordinate rotation digital computer [17] 16 ULA 768 (CORDIC) based Sum&Delay DoA Estimator Sequential / MicroBlaze soft processor based [18] 8 UCA 684 2349 Bartlett DoA Estimator [18]
Parallel-Sequential / Bartlett DoA Estimator
8 UCA
312.13
165
[18]
Parallel-Sequential / FFT DoA Estimator
8 UCA
104.8 ×10³
7434
In literature, due to the aim of the application (like improve calculation speed, reduce complexity or optimal hardware consumption), the results could be various. The most attractive studies about DoA estimation based on an FPGA with Uniform Linear Array (ULA) and Uniform Circular Array (UCA) are presented in Table 1. In this study, working with data taken from the real environment is aimed. For this purpose, a data collection hardware is designed. The collected dataset is stored on a PC. Then with the next hardware implementation, a DoA estimation is done by using the dataset which was collected from antenna array in a real environment. The proposed system is a highly parallel calculating method. For each angle, the values in the pseudo spectrum are calculated fully parallel but the calculation of whole pseudo spectrum needs 181 sequences. In the second section, the design of the systems is presented. In the third section, the proposed DoA estimation method, Bartlett, is introduced. In the fourth section, the architecture in the FPGA is presented, in the next section, the performance comparison is done. In the last section, the conclusions are presented.
II. SYSTEM DESIGN Usage of the FPGAs in a system does not guarantee that this system is going to be faster. The most important point of an FPGA usage is the ability of parallel computing. So, for a significant improvement in process duration, it is an obligation to use of parallel calculation ability of the FPGAs. Furthermore, to make an existing
algorithm possible to run parallel, it has to be investigated and optimized deeply. The established system to estimate DoA calculation has two stages. The first stage is for data collecting from the real environment. That hardware collects data from 4 quarter wave antenna and saved into a PC. These recordings are done in an open area to avoid reflections. In this stage, the FPGA evaluation board is employed as 4 channel shift register and serial communicator. In the second stage, Bartlett DoA estimation is done by using the recorded data. In this stage, two FPGA evaluation board are used. The first FPGA evaluation board is employed to simulate an antenna array output by using the data collected in the first stage. The dataset comprises the environmental noise, the mutual coupling effects of the antennas in the array. So, it is possible to examine the DoA estimation algorithms in the laboratory environment as if they are done in the real world. The setups used in these stages are presented in Fig. 1. In the first stage, an RF Front-End and data collector structure has been designed. The signals received from 4 monopole antenna elements are amplified by a preamplifier (PA). This amplifier has 4 channels that have equal and fixed gain about 10 dB. The amplified received signal is applied to a mixer IC. Each channel has own mixer ICs, but all of the local oscillator (LO) inputs of mixers are fed from same crystal oscillator with the same length of a path. The obtained intermediate frequency (IF) signal at the output of mixer IC is filtered by a crystal resonator filter (CRF). The IF signal with
ACES JOURNAL, Vol. 33, No. 4, April 2018
452
the frequency of 2MHz, has been amplified by IF amplificator (IF). ADA daughter board (ADA-GPIO) by Altera Company is used as the analog-digital converter. The IF signals received from 4 channels are converted into 8-bit digital data in 40 MSPS speed using two ADAGPIOs. The ADA-GPIOs are connected to Altera DE0 Board. For the rest of the operations, Altera DE0 Board is used.
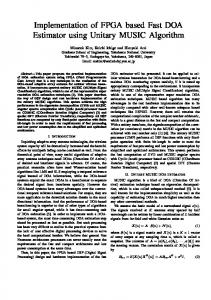
The measurements are done in an open area to avoid reflections. They are performed while two unmodulated narrowband transmitters are at different angles and results are recorded. The measurement set-up whose flow chart is presented in Fig. 1 (a) is shown in Fig. 2. The block diagram of data collection hardware whose picture is seen in Fig. 2 is presented in Fig. 3.
Fig. 3. The block diagram of RF Front-End & data collecting setup.
Fig. 1. (a) The first stage: Data acquisition setup. (b) The second stage: DoA estimation setup.
Fig. 2. Software defined radio & data collecting.
After the ADA-GPIOs the IF signal is digitized and taken into the FPGA. Each of these digitized samples has taken into shift registers from each channel simultaneously. Totally 480 samples are transferred to a PC via Universal Synchronous/Asynchronous Receiver/ Transmitter (USART) when 120 samples are collected from all of the inputs. To avoid mistakes, a header consists of 5 bytes to the beginning of the stream and a checksum byte at the end of the stream is added. So, each transfer sequence consists of 486 bytes. The block diagram of the shift register used for data collection operations and implemented by VHDL codes for FPGA DE0 board is presented in Fig. 4. When the user asks from the software in the PC to take a capture, the software looks for a header, then collects 480 bytes of data after the header, and after receiving the checksum, compares it with the calculated one. If the checksum byte comparison is confirmed the collected data is stored on the hard disk with date, time and an explanatory text. Else, whole instructions mentioned above are repeated.
UNLERSEN, YALDIZ, IMECI: FPGA BASED FAST BARTLETT DOA ESTIMATOR FOR ULA ANTENNA
Fig. 4. The block diagram of data collector implemented on the FPGA. Since there is a filtration operation during the IF signal amplification, the IF signal almost consists of a single frequency at 2MHz. So, the digital IF signal recorded on the hard disk is subject to the mathematical models given in Equation (1):
n (1) U n A cos 2 f 0 , fs where A represents signal amplitude, n represents the sample index changing between 1 and 120, f0 represents the operating frequency (2MHz), fs represents the sampling frequency (40MHz). All measurements are done in open area due to avoid unwanted reflections. A signal generator connected to a monopole antenna is used as the signal source. In measurements, two unmodulated signal sources are settled up to various angles and 120 samples of 4 IF signals are recorded. Totally 480 records are taken for each setup and stored on a PC to use in DoA estimation stage.
In the second stage, the recorded data in the first stage is embedded into DE0 board which simulates an antenna array or an RF front-end outputs. The data is sequentially driven to the outputs through Circular Shift Register (CSR). The antenna simulator whose flowchart is presented in Fig. 1 (b) is demonstrated as a block diagram in Fig. 5. DoA estimation is done on DE2-115 development and education board of Altera Company. The DoA estimation is achieved by using Bartlett algorithm on DE2-115 board. Results are transferred to a PC via a UART protocol. They are observed and saved by a GUI software on a PC. The inner connection between DE0 and DE2-115 is done by using 40 pin Integrated Drive Electronics (IDE) cable. But to avoid interferences into the data signals in IDE cable, it is screened with a grounded aluminum foil. The measurement set-up is presented in Fig. 6.
Fig. 5. The block diagram of the antenna simulator implemented on the FPGA.
453
ACES JOURNAL, Vol. 33, No. 4, April 2018
454
Fig. 6. DoA estimation set-up.
III. BARTLETT DoA ESTIMATION In the Bartlett spectral estimation method, the power maintained from the antenna array is calculated as the function of θ, and a spatial spectrum is obtained. Local maximums are determined in this spatial spectrum. The result is the power coming through PB(θ). This value is obtained by Equation (2) [9]: S H R S (2) PB , N2 where Sθ represents steering vector for θ, N represents the number of antenna elements forming ULA antenna and R represents covariance matrix of the array. (_)H represents Hermitian conjugate of a vector. Sθ and Hermitian conjugate of Sθ are given by Equation (3) [9]: jnkd sin S n e (3) n 0 N 1. jnkd sin SH n e In Equation (3) the k represents the wave number which is equal to 2π/λ. And the d represents distances between antenna elements in the ULA. This value is chosen as λ/2. The N parameter which represents the number of antenna elements in ULA antenna is 4 in this study. To make Equation (2) suitable for parallel computing, following simplifications are done: 1 4 4 PB 2 S n .R n, m .SH m , N n 1 m 1 1 N N jn sin jm sin PB 2 e .e .R n, m , (4) N n 1 m 1 1 N N PB 2 e j ( n m ) sin .R n, m . N n 1 m 1 In Equation (4), it is possible to observe that the minimum and maximum value of n-m is 1-N and N-1 respectively. So if a W vector is defined as in Equation
(5), the Bartlett DoA estimation formula in Equation (4) can be presented as in Equation (6): (5) W p e jp sin p 1 N N 1. 1 N N (6) W [n m].R n, m. N 2 n1 m1 The new vector Wθ is calculated in this study by the Equation (7): e j 3 sin , e j 2 sin , e j sin , W , j sin , e j 2 sin , e j 3 sin 1, e cos 3 sin , cos 2 sin , , (7) W r , cos 2 sin , cos 3 sin sin 3 sin ,sin 2 sin , . W i ,sin 2 sin , s in 3 sin This process conducted on Bartlett DoA estimation algorithm resembles the calculation of the power radiated from the antenna array towards each angle physically. However, the obtained value from a certain direction not only contains the signal sources in the direction, but also the signal sources from side lobes slightly [19]. PB
IV. HARDWARE IMPLEMENTATION The signals obtained in the physical environment have real values. However, DoA estimation algorithms need also imaginary parts of the signals as input [20]. Since the IF is a narrow band signal, the polar expression of IF signal can be expressed as in Equation (8): U n Ae
2 f 0 j n fs
,
2 f 0 2 f 0 (8) U n A cos n j sin n . fs fs
UNLERSEN, YALDIZ, IMECI: FPGA BASED FAST BARTLETT DOA ESTIMATOR FOR ULA ANTENNA
The collected data is the real part of the value in Equation (8). In order to derive imaginary part needed in Bartlett algorithm, several methods could be employed. For example, the imaginary part is equal to (A2 – R2)1/2 where A is the envelope of signal and R is the real values. But both "envelope determination" and "square root operation" cause extra calculation duration. In this study, some trigonometric manipulations are done to obtain the imaginary part of the signal by using just basic four operations. The well-known sum and subtraction formulas of cosine presented in Equation (9) form the basis of the manipulations: x y x y cos x cos y 2 cos .cos , 2 2 (9) x y x y cos x cos y 2sin .sin . 2 2 Since the fs and f0 are chosen as 40MHz and 2MHz respectively, two sequential samples ((n-1)th and nth) can be expressed as in Equation (10): 2 f 0 U n A cos n A cos n , f 10 s (10) 2 f 0 U n 1 A cos n 1 A cos n 1 . fs
10
455
2 f 0 U n 1 U n U n 1 U n A cos n 1 , 2 1.9754 fs 2 cos 20 (14)
2 f 0 A cos n 1 2 fs
1 U n 1 U n . 2
As a result of manipulations seen above, the real and imaginary values can be expressed as in Equation (15) [21]: 1 U n 1 U n , 2 25 U i n 0.5 U n 1 U n . 8 U r n 0.5
(15)
First, the U[n] data is taken from ADC into the FPGA. Then the real and imaginary parts of this data are calculated by the help of the Equation (15). And two shift registers are added to record Ur and Ui on each clock cycle. The calculation method of imaginary and real parts of the data on the FPGA is presented as a block diagram in Fig. 7.
In order to obtain an expression contains sinus function, it is clear that subtraction formulas should be used: DeltaU U n 1 U n ,
DeltaU A cos n 1 cos n , (11) 10 10 DeltaU A 2 sin n 1 sin , 2 10 20
Hence sinus expression can be written as in Equation (12) [21]:
2 f 0 U n 1 U n , DeltaU A sin n 1 2 f 0.3129 s 2 sin 20 (12) 2 f 0 25 A sin n 1 U n 1 U n . 2 fs 8
It can be seen that the sample index of the obtained imaginary part (sinus expression) is (n-0.5). To make real part concurrently with the imaginary part, some manipulations need on real part. In order to obtain a cosine expression with (n-0.5) sample index, the sum of two sequential samples in Equation (10) can be calculated: SumU U n 1 U n ,
SumU A cos n 1 cos n , 10 10 (13) SumU A 2 cos n 1 cos , 2 10 20
The cosine expression can be written as in Equation (14):
Fig. 7. The extraction of imaginary - real values and shift registers on the FPGA. Next step is the calculation of the covariance matrix. The input matrix of covariance calculation consists of 20 samples obtained from each antenna outputs. Since there are 4 sensors in the ULA antenna, the dimension of input matrix is 4×20. The covariance of Xa and Xb vectors are calculated as in Equation (16) [22]: H Cov X a , X b E X a E X a X b E X b . (16) Here, E operator shows the average of the related vector. (_)H symbol indicates the Hermitian conjugate of the concerned vector. The E operator executes the operations in Equation (17): 2 f 0 1 N 1 N E U U n cos n . (17) N n1 N n 1 f s A practical identity about the sum of cosine series is presented in Equation (18) [23]: N 1 N cos x sin x 2 2 . cos xn x n 1 sin 2 N
(18)
ACES JOURNAL, Vol. 33, No. 4, April 2018
456
If the transformation in Equation (18) is performed in the Equation (17), the Equation (19) is obtained: 2 f 0 1 N E U cos n N
n 1
fs
N f0 f cos N 1 0 sin f s fs . E U f N sin 0 fs
(19)
In order to make the mean value of U presented in Equation (19) zero, sin N f0 / f s has to be equal to zero. Therefore N f 0 / f s needs to be equal to k which makes sinus zero: N f0 if k then E (U ) 0 for k 0,1, 2... fs (20) f 40 N sk k 20k . f0 2 The sampling frequency is chosen as a multiple of the signal frequency. Additionally, the number of samples taken into shift registers is chosen as 20 which is a multiple of the ratio between the sampling frequency and the signal frequency. These predilections make the average of the related vector zero as presented in Equation (20). That circumstance eliminates the average calculations in the covariance calculation. So, the Equation (16) could be reconstructed as in Equation (21): H Cov X a , X b E X a X b . (21) This provides a reduction in the FPGA source consumption and calculation duration. As the number of
sensors in the ULA antenna is 4, the covariance matrix has to be 4×4 size as shown in Equation (22): R 1,1 R 1, 2 R 1,3 R 1, 4 R 2,1 R 2, 2 R 2,3 R 2, 4 . (22) R R 3,1 R 3, 2 R 3,3 R 3, 4 R 4,1 R 4, 2 R 4,3 R 4, 4 The covariance matrix is diagonally symmetric [22]. In order to get calculations simple, R[2,1], R[3,1], R[4,1], R[3,2], R[4,2] and R[4,3] are not calculated, only the conjugant value of related element is assigned. The real and imaginary parts of R matrix are calculated as shown in Equation (23) [21]: R a, b Rr a, b j Ri a, b , Rr a, b
1 20 U r a, n U r b, n , 20 n 1 +U i a, n U i b, n
Ri a, b
1 20 U r a, n U i b, n , 20 n 1 U i a, n U r b, n
(23)
where U a, n is nth sample taken from the ath antenna: 1 N N W n m.R n, m, N 2 n 1 m1 1 4 4 PB real Wr n m.Rr n, m Wi n m .Ri n, m , (24) 16 n 1 m1 1 4 4 PB imag Wr n m.Ri n, m Wi n m .Rr n, m, 16 n 1 m1
PB
with the covariance matrix R, DoA strength estimation for any angle θ is calculated by using Equation (6). In order to reduce calculation process, the W vector is obtained from a pre-calculated table. Integer is used as the class in all process. The whole block diagram of the Bartlett DoA system is shown in Fig. 8 [21].
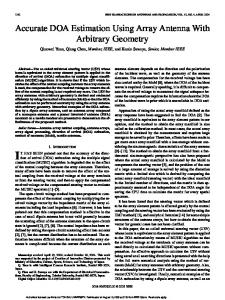
Fig. 8. Block diagram of the Bartlett DoA algorithm on the FPGA. The data obtained from this system is kept by a sphift register and transferred to a PC via serial port. The DoA estimation results are observed by a GUI on a PC.
Figure 9 shows a screenshot of GUI taken from a PC [21]. The most important disadvantage of this method is
UNLERSEN, YALDIZ, IMECI: FPGA BASED FAST BARTLETT DOA ESTIMATOR FOR ULA ANTENNA
1
2
3 Fig. 9. Screenshot of the GUI shows DoA estimation results on pseudo-spectrum.
4
Seq. MicroBlaze soft processor 118193 684 based Bartlett DoA estimator [18] Parallel-Seq. 53929 Bartlett DoA 312.1 (Estimate) estimator [18] Parallel-Seq. 18.19×10⁶ FFT DoA 104.8×10³ (Estimate) estimator [18] Parallel Presented in 181 0.804 this paper
Utilized Logic Elements
Calculation duration (µs)
Clock Cycle
Structure / Method / Reference
Table 2: Comparison of the proposed method and the study [17] in calculation duration Structure No.
the data transfer process. The process of transferring data from the FPGA to a PC is slower compared to the DoA estimation calculations. Designing a system that creates control outputs according to the DoA results on the same device, (means a fully embedded system) would provide significant benefits in real-time applications.
457
2349
165
7434
8467
V. PERFORMANCE COMPARISON In this algorithm, DoA estimation is done for 181° pseudo-spectrum between -90° and 90°. By means of 1° increase in each clock pulse, the incoming signal existence from the related angle is calculated. Thereby, for the DoA estimation of the whole pseudo-spectrum, 181 clock pulse is needed. Since the working frequency is 225MHz, the DoA estimation duration for the whole pseudo-spectrum calculations is about 804.44 ns. In the study [18], the Bartlett DoA Estimation algorithm had done using MicroBlaze soft processor on an FPGA as presented in Table 2 Structure No. 1. When the scripts in the study [17] are considered, it is seen that the DoA estimation of the whole pseudo-spectrum is calculated with 118193 clock pulse. Besides, the custom VHDL in the study [18] is designed in two types, as Parallel-Sequential Bartlett DoA Estimator and Parallel-Sequential FFT DoA Estimator; presented in Table 2 with Structure No. 2 and 3 respectively. The DoA estimation durations on FPGA are presented as 312.13 µs and 104825 µs respectively. Clock cycle, calculation duration, utilized logic elements for the study [17] and the proposed method are given in Table 2.
VI. CONCLUSION This paper presents design and implementation of a fast parallel Bartlett DoA estimation hardware on an FPGA. Since the signals in the study are collected from the real world, the data involves all the effects such as noise, reflections, and interferences between antennas. Moreover, its comparison with Bartlett DoA estimation algorithm, which is created by using MicroBlaze soft processor and custom design VHDL codes, was done.
Besides the improvements in the FPGA technology, the optimization process on the algorithm has an important role on the duration reduction of calculation. It can be seen that DoA estimation which is performed by using parallel calculation, provides a considerable increase in calculation speed. This provides a significant improvement over the similar studies found in literature. By making modifications to covariance matrix calculation and steering vector usage, it has become possible to scan the whole pseudo-spectrum in just 181 clock pulses. The DoA estimation hardware developed in this study is presented as Structure 4 in Table 2. By comparing based on calculation duration, the Structure 4 produces results in 0.034% of calculation duration of Structure 1 (2920 times faster than Structure 1), 0.49% of calculation duration of Structure 2 (205 times faster than Structure 2) and 0.01% of calculation duration of Structure 3 (9241 times faster than Structure 3). Although calculation durations could give an impression, this information has a close relation between working frequency, it has also a relation between improvements in the technology. In order to obtain more objective results, the clock cycle count need to be compared. If a comparison is done based on clock counts, it could be seen clearly that Structure 4 is 653 times faster than Structure 1. This radical decrease in the calculation is occurred because of the algorithm optimizations and adaptation of sequential algorithm into parallel. In this study, arrangements on Bartlett algorithm and imaginary part obtaining method is performed. These are the major effects on achieving the low latency. The results are promising for future works about a standalone fast DoA estimator system on an FPGA.
ACES JOURNAL, Vol. 33, No. 4, April 2018
458
REFERENCES [1]
[2]
[3] [4]
[5]
[6]
[7]
[8]
[9]
[10]
[11]
[12]
[13]
M. Viberg and T. Svantesson, Direction-of-Arrival Estimation in Mobile Communication Environments, in Handbook of Antennas in Wireless Communication. CRC Press, Boca Raton, London, New York, Washington D.C., 2002. M. H. Rahmani and A. Pirhadi, “Optimum design of conformal array antenna with a shaped radiation pattern and wideband feeding network,” ACES Journal, vol. 29, no. 1, pp. 37-46, Jan. 2014. C. A. Balanis, Antenna Theory: Analysis and Design. John Wiley & Sons, New Jersey, 2005. H. L. Sneha, H. Singh, and R. M. Jha, “Analytical estimation of radar cross section of arbitrary compact dipole array,” ACES Journal, vol. 29, no. 9, pp. 726-734, Sep. 2014. C. Furse, “A survey of phased arrays for medical applications,” ACES Journal, vol. 21, no. 3, pp. 365-379, Nov. 2006. G. Buttazzoni and R. Vescovo, “Far-field synthesis of sparse arrays with cross-polar pattern reduction,” ACES Express Journal, vol. 1, no. 2, pp. 44-47, Jan. 2016. Y. Khmou, S. Safi, and M. Frikel, “Comparative study between several direction of arrival estimation methods,” Journal of Telecommunications and Information Technology, vol. 1, no. 41-48, Jan. 2014. H. Krim and M. Viberg, “Two decades of array signal processing research: The parametric approach,” IEEE Signal Processing Magazine, vol. 13, no. 4, pp. 67-94, July 1996. L. C. Godara, “Application of antenna arrays to mobile communications II. Beam-forming and direction-of-arrival considerations,” Proceedings of the IEEE, vol. 85, no. 8, pp. 1195-1245, Aug. 1997. E. M. Al-Ardi, R. M. Shubair, and M. E. Al-Mualla, “Direction of arrival estimation in a multipath environment: An overview and a new contribution,” ACES Journal, vol. 21, no. 3, pp. 14, Nov. 2006. S. J. Ovaska and O. Vainio, “Recursive linear smoothed newton predictors for polynomial extrapolation,” IEEE Transactions on Instrumentation and Measurement, vol. 41, no. 4, pp. 510-516, Aug. 1992. B. J. Fasenfest, F. Capolino, and D. R. Wilton, “Preconditioned gifft: A fast mom solver for large arrays of printed antennas,” ACES Journal, vol. 21, no. 3, pp. 276-283, Nov. 2006. K. Minseok, I. Koichi, and A. Hiroyuki, “Imple-
[14]
[15]
[16]
[17]
[18]
[19]
[20]
[21]
[22]
[23]
mentation of FPGA based fast DoA estimator using unitary MUSIC algorithm [cellular wireless base station applications],” 2003 IEEE 58th Vehicular Technology Conference, vol. 1, pp. 213-217, 6-9 Oct. 2003. M. Kim, K. Ichige, and H. Arai. “Real-time smart antenna system incorporating FPGA-based fast DoA estimator,” 2003 IEEE 58th Vehicular Technology Conference, vol. 1, pp. 26-29, Sep. 2004. M. Devendra and K. Manjunathachari, “Direction of arrival estimation using MUSIC algorithm in FPGA: Hardware software co-design,” International Journal of Applied Engineering Research, vol. 11, no. 5, pp. 3112-3116, 2016. M. Jamali, J. Downey, N. Wilikins, C. R. Rehm, and J. Tipping, “Development of a FPGA-based high speed FFT processor for wideband direction of arrival applications,” 2009 IEEE Radar Conference, pp. 1-4, 4-8 May 2009. Y. Yang and A. E. Fathy, “Development and implementation of a real-time see-through-wall radar system based on FPGA,” IEEE Transactions on Geoscience and Remote Sensing, vol. 47, no. 5, pp. 1270-1280, 24 Mar. 2009. M. Abusultan, S. Harkness, B. J. LaMeres, and Y. Huang, “FPGA implementation of a Bartlett direction of arrival algorithm for a 5.8 ghz circular antenna array,” 2010 IEEE Aerospace Conference, pp. 1-10, 6-13 Mar. 2010. P. Hyberg, “Antenna array mapping for DoA estimation in radio signal reconnaissance,” Ph.D. Dissertation, Sensors and Systems Royal Institute of Technology, Sweden, p. 266, 2005. R. L. Haupt, “Phased array beam steering through serial control of the phase shifters,” ACES Express Journal, vol. 1, no. 1, pp. 12-15, Jan. 2016. M. F. Unlersen, “FPGA kullanilarak dizi anten performansinin iyilestirilmesi - Improving array antenna performance using FPGA,” Ph.D. Dissertation, Selcuk University, Konya - Turkey, p. 132, 29 Oct. 2015. J. I. Marden, Multivariate Statistics: Old School: Mathematical and Methodological Introduction to Multivariate Statistical Analytics, Including Linear Models, Principal Components, Covariance Structures, Classification, and Clustering, Providing Background for Machine Learning and Big Data Study, With r. Create Space Independent Publishing Platform, 2015. L. B. W. Jolley, Summation of Series. Dover Publications Inc., New York, 1961.
UNLERSEN, YALDIZ, IMECI: FPGA BASED FAST BARTLETT DOA ESTIMATOR FOR ULA ANTENNA
Muhammed Fahri Unlersen received B.Sc, MSEE and Ph.D. degrees in Electrical and Electronics Engineering from Selçuk University, Konya, Turkey in 2004, 2007 and 2015, respectively. He was a Lecturer in Doganhisar Vocational School at Selcuk University from 2005 to 2016, and Assistant Professor from 2016 in the Department of Electrical and Electronics Engineering at Necmettin Erbakan University. His current research interests are the array antennas, electromagnetic theory, field programable gate arrays and optimization techniques. Ercan Yaldiz received B.Sc., MSEE and Ph.D. degrees in Electrical and Electronics Engineering from Selçuk University, Konya, Turkey in 1991, 1995 and 2002, respectively. He was a Teaching Assistant from 1992 to 2003, Assistant Professor from 2003 to 2013, and Associate Professor from 2013 to 2018 in the Department of Electrical and Electronics Engineering at Selçuk University. He is already Professor at Selçuk University. His current
research interests are in the areas of the electromagnetic radiation, scattering, and numerical techniques. Şehabeddin Taha İmeci received the B.Sc. degree in Electronics and Communications Engineering from Yildiz Technical University, Istanbul, Turkey in 1993, and M.S.E.E. and Ph.D. degrees from Syracuse University, Syracuse, NY in 2001 and 2007 respectively. He was with Anaren Microwave Inc., East Syracuse, NY from 2000 to 2002, and Herley Farmingdale, New York from 2002 to 2003, and PPC, Syracuse, NY from 2003 to 2005, and Sonnet Software Inc., Liverpool, NY from 2006 to 2007. He was a Teaching Assistant in the Department of Electrical Engineering and Computer Science at Syracuse University from 2005 to 2006. He received the Assistant Professorship and Associate Professorship degrees at Istanbul Commerce University, Istanbul Turkey in 2011 and 2014, respectively. İmeci joined International University of Sarajevo (IUS) as full Professor in 2017. His current research areas are microwave antennas and electromagnetic theory. İmeci authored two books and more than 100 scientific papers.
459