International Journal of Advancements in Technology http://ijict.org/
ISSN 0976-4860
Front-end Digital Signal Processing Scheme for 206.5 MHz Atmospheric Radar Application Ashish Kumar, Samaresh Bhattacharjee, Manish Naja, Phani Kumar Aryabhatta Research Institute of Observational Sciences (ARIES), Department of Science & Technology, Govt. of India, Manora Peak, Nainital, Uttarkhand, INDIA 263 129 Email:
[email protected]
Abstract This paper describes the digitization and front-end digital signal processing scheme for the atmospheric Radar operating at 206.5 MHz. The atmospheric Radar operating at this frequency will have the capability to probe upto the lower Stratosphere (~ 20 km). In the present paper, the capabilities of digital receiver in performing functions like band-pass sampling at 206.5 MHz using 16 bit Analog-to-Digital Converter (ADC) and Field Programmable Gate Array (FPGA) based Digital Down Converter (DDC) are demonstrated through simulation. The latest version FPGA is chosen in the present simulation for designing the digital receiver design due to their relatively low cost, faster processing strength and inbuilt reconfigurability. Keywords: Radar, band-pass sampling, digital receiver, signal processing.
1. Introduction The term „Radar‟ is the abbreviation for „Radio Detection And Ranging‟, defined as the art of detecting the presence of target, determining their direction and range, recognizing their character by means of radio waves. The principle involves in the atmospheric Radar is to transmit the modulated waveform of electromagnetic energy using antenna array into the atmosphere and processing the backscattered echoes through suitable means utilizing a chain of signal processors to determine vertical wind components [1] with a high degree of temporal and spatial resolutions (typically at ~ 30 sec and at ~ 150 m, respectively), and other vital parameters required for studying the structures and dynamics of atmosphere. Today‟s trend in Radio Frequency (RF) front-end is to minimize the complexity and to digitize the signals as close as possible to Antenna. As a result, direct RF digitization is common nowadays [2]. A software simulation for the similar RF digitization is carried out and discussed in the forthcoming sections in this paper to demonstrate and evaluate the feasibility of direct RF sampling at 206.5 MHz RF signal using band-pass sampling technique. FPGAbased digital signal processing solutions using reconfigurable computing [3] meeting the specifications for 206.5 MHz atmospheric Radar is also covered [4].
Vol 2, No 1 (January 2011) ©IJoAT
71
International Journal of Advancements in Technology http://ijict.org/
ISSN 0976-4860
2. Atmospheric Radar Technology 2.1 Brief History No single nation or a single person is could be given complete credit for the invention of the Radar system. One must look at the Radar as an accumulation of many developments and improvements earlier, which scientists and engineers of several nations parallel made share. There are nevertheless some milestones with the discovery of important basic knowledge and important inventions involved in Radar technology as presented in Table 1. Table 1: History of Radar Technology 1865 1887 1904 1917 1921 1922 1930 1931 1936
1940 1961
The English physicist James Clerk Maxwell developed his electro-magnetic light theory [5]. The German physicist Heinrich Rudolf Hertz discovers the electro-magnetic waves and proves the theory of Maxwell with that. The German high frequency engineer Christian Hülsmeyer invents the “Telemobiloskop” to the traffic supervision on the water. This is the first practical radar test. The French engineer Lucien Lévy invents the super-heterodyne receiver. He uses it as first the denomination “Intermediate Frequency”, and eludes the possibility of double heterodyning. The invention of the Magnetron as an efficient transmitting tube by the US-American physicist Albert Wallace Hull. The American electrical engineers Albert H. Taylor and Leo C. Young of the Naval Research Laboratory (USA) locate a wooden ship for the first time. Lawrence A. Hyland (also of the Naval Research Laboratory), locates an aircraft for the first time. A ship is equipped with radar. As antennae are used parabolic dishes with horn radiators. The development of the Klystron by the technicians George F. Metcalf and William C. Hahn, both from General Electric. This will be an important component in radar units as an amplifier or an oscillator tube. Different radar equipments are developed in the USA, Russia, Germany, France and Japan. The first wind-sounding radar came into picture at Jicamarca, Peru.
2.2 Atmospheric Radar around the Globe Table 2 lists some of the leading Atmospheric Radars in the world. Table 2: Atmospheric Radar’s around the World
Radar
Features
Jicamarca Radar (Peru, Greenland)
Established: 1961 Frequency: 49.92 MHz Peak Power: 1.5 MW Duty Ratio: 6 % Array: Phased-array of 18,432 Half-wave dipoles Established: 1984 Frequency: 46.5 MHz Peak Power: 1 MW Duty Ratio: 5 % Array: Circular array of 475 crossed Yagi‟s
MU Radar (Shigaraki MU Observatory, Japan)
Vol 2, No 1 (January 2011) ©IJoAT
Pictorial view
72
International Journal of Advancements in Technology http://ijict.org/
SOUSY Radar (Peru, Greenland)
Equatorial Atmospheric Radar (Bukittinggi, Indonesia)
Arecibo Radar (Arecibo Observatory, USA)
Chung-Li VHF Radar ( Chung-Li, Taiwan)
Indian MST Radar (NARL, Gadanki, India)
404 MHz Radar (IMD, Pune, India)
ISSN 0976-4860
Established: 1977 Frequency: 53.5 MHz Peak Power: 150 kW Duty Ratio: 4 % Array: 356 Yagi‟s with square aperture Established: 2001 Frequency: 47 MHz Peak Power: 100 kW Duty Ratio: 5 % Array: Quasi-Circular array of 560 Yagi‟s Established: 1962 Frequency: 430 MHz Peak Power: 2.5 MW Duty Ratio: 6 % Array: platform cia,1500 ft Established: 1985 Frequency: 52 MHz Peak Power: 180 kW Duty Ratio: 2 % Array: Triangular grid (40 m,80 m and 92 m) 3 rectangular arrays with 32 Yagi‟s each Established: 1992 (ST mode) and in March 1994 (full MST mode) Frequency: 53 MHz Peak Power: 2.5 MW Duty Ratio: 2.5 % Array: 1024 Yagi‟s in area of 130 m x 130 m Established: 2001 Frequency: 404.37 MHz Peak Power: 16 kW Duty Ratio: 10 %
From Table 2, one can clearly understand that almost all atmospheric Radar in the world are designed at the operating frequency of ~ 50 MHz [e.g. Jicamarca Radar (49.92 MHz), MU Radar (46.5 MHz), SOUSY Radar (53.5 MHz), Equatorial Atmospheric Radar (47 MHz), Chung-Li VHF Radar (52 MHz), Indian MST Radar (53 MHz) etc.] and at ~ 400 MHz [e.g. 404 MHz Radar of IMD, Pune (404.37 MHz), Arecibo Radar (430 MHz) etc.]. Nowadays, the Radar scientists and engineers are very much keen in understanding the performance of atmospheric Radar around frequency of ~ 200 MHz, with the opinion that with ~ 200 MHz one can get certain features of both at ~ 50 MHz and at ~ 400 MHz. There are other reasons too like at ~ 200 MHz, the sky noise will be comparatively very less (~ 600 °K ) Vol 2, No 1 (January 2011) ©IJoAT
73
International Journal of Advancements in Technology http://ijict.org/
ISSN 0976-4860
as compared to that at ~ 50 MHz (~ 6000 °K), thereby providing better figure of merit (G/T). This will greatly increase the sensitivity of the receiving system. Furthermore, 50 MHz atmospheric Radar needs a large flat area, whereas the atmospheric Radar operating at ~ 400 MHz limits the height coverage up to 11-13 km. In order to limit the scope at ~ 200 MHz atmospheric Radar, this paper is aimed to demonstrate the signal processing scheme at 206.5 MHz.
3. Atmospheric Radar Signal Processing Mechanism The signal processing subsystem plays a vital role in the atmospheric Radar application. This concept begins with a signal of a given frequency being transmitted into the atmosphere, gets scattered back from the atmospheric scatterers like cloud, hydrometeor etc. The time delay between the transmission and reception is used to determine the height from which the signal is returned back. Through various signal processing steps on the received data, the wind speed and direction as a function of height are estimated which can further be used in atmospheric dynamics studies. The key section of any atmospheric Radar signal processing is the digital receiver. With the present technology, it is possible to incorporate the features of high speed ADC and latest version of Xilinx FPGA based processing modules in the digital receiver. The on-line processing significantly compresses the data via time averages and produces power spectra or autocorrelation functions (ACFs). From the ACFs the scattered power, line-of-sight velocity and signal correlation time are calculated. Real time display provides the on-site graphical terminals for real-time quick-look assessment of the quality of the received data. It is also equipped with the options for plotting the complex autocorrelation functions, power spectra, and received signal as a function of range. The off-line processing involves curve fitting and parameter extraction. The discussion in the present paper is limited upto digital receiver section. 4. Results and Discussion The simplest form of a transmit pulse as shown in Fig. 1 is a snippet of a sinusoid that can be expressed mathematically as:
where,
t x t rect cos 2 f c t p
……………(1)
t 1 0 t p rect p 0 elsewhere
Fig. 1: Basic Transmitted Pulse
Vol 2, No 1 (January 2011) ©IJoAT
74
International Journal of Advancements in Technology http://ijict.org/
ISSN 0976-4860
The signal received by the atmospheric Radar will be ideally, an attenuated delayed version of the transmit signal i.e.
r t . x (t Td ) w (t ) t Td ………….(2) cos 2 ( f c f d )t (r ) w (t ) p
= .rect
Fig. 2 shows the spectrum of simulated received signal, r (t) without any delay being added.
Fig. 2: Single-sided Amplitude Spectrum of Received signal (without delay)
4.1 Direct RF Digitization To make a receiver more flexible, it is desirable to sample and digitize the received signal at the RF frequency. The RF sampling scheme expands the region of digital signal processing and makes the receiver more programmable. However, a high speed ADC is required for the RF sampling receiver because the ADC needs to sample the high frequency signal and convert it to a digital signal. As one of the solutions to this, the band-pass sampling scheme is considered in this paper. Band-pass sampling (or under sampling) is a sampling technique in which the frequency conversion and the sampling are performed at the same time using a sampling frequency less than the Nyquist frequency of the sampled signal [6], [7]. Using appropriate sampling frequency f , the desired signal is frequency-converted to a frequency range between 0 and f /2. Out-band interference and noises not rejected by the band pass filter are also frequency-converted to the same frequency range. Thus, the signal can be frequency-converted without an oscillator or a mixer by undersampling. The criterion for band-pass sampling is given as: sample
sample
2 fH n
Vol 2, No 1 (January 2011) ©IJoAT
f sample
2 fL n 1
..………..(3)
75
International Journal of Advancements in Technology http://ijict.org/
ISSN 0976-4860
For present analysis, f H (Higher cut-off frequency) = 208.5MHz, f L (Lower cut-off frequency) = 204.5 MHz, and n is an integer given by: 1 n I g
fH . For n = 6, 69.5 MHz ≤ fsample ≤ 81.8 B
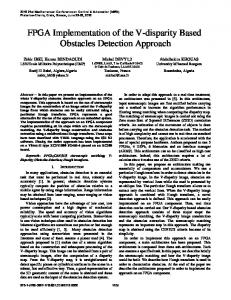
MHz. Simulations are carried out by taking the features of latest high speed (16-bit) ADC of Linear Technology LTC2209 [8]. In the present simulation scheme, the received signals at 206.5 MHz are under-sampled at the speed of 72 MSPS (fsample). The translation is shown in Fig. 3 and the replicated model of LTC2209 illustrating this translation is shown in Fig. 4. fRF'= |fRF-fsample*round(fRF/fsample)| = |206.5 - 72*round(206.5/72)|MHz =9.5 MHz fRF' = 9.5 MHz
fRF = 206.5 MHz
fsample=72MHz
NYQUIST ZONE
Fig. 3: Band-pass sampling for 206.5 MHz received RF signal
Figure 7. Replication for LTC2209 ADC
Fig. 4: Replication of LTC2209 illustrating band-pass sampling for 206.5 MHz signal
The reason behind choosing of high speed LTC 2209 ADC in the present work is that it provides an ultra low jitter of 70 fsRMS [9], thereby allowing the under sampling of 206.5 MHz RF signal with excellent noise performance.
4.2 Digital Down Conversion Normally DDC is implemented using Texas Instruments Graychip or Intersil. FPGA is chosen in the present scheme because of its following merits [10], [11]: - Better performance like improved Spurious-Free Dynamic Range (SFDR). - Faster processing and inbuilt reconfiguability. - Reduction in Power requirement, increased precision performance. Vol 2, No 1 (January 2011) ©IJoAT
76
International Journal of Advancements in Technology http://ijict.org/
ISSN 0976-4860
- Excellent quadrature channel phase balance, increased temperature stability. - Can easily taylor and optimize the design. Wide varieties of FPGA are available for DDC implementation. A comparision between widely used FPGAs for atmospheric Radar digital receiver application is tabulated in Table 3 [12]. Table 3: FPGA Selection Virtex-II Pro VP50
Virtex-4 SX SX55
Virtex-5 SXT SX95T
Logic Cells
32,256
55,296
94,208
Block RAM(bits)
4,176K
5,760K
8,784
Max I/O Pins
852
640
640
DSP Multipliers
232
512
640
Rocket I/O Serial
16
--
640
Gbit Ethernet Port
--
--
4
PCI-X Port
--
--
1
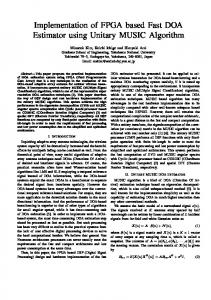
The DDC performs the critical frequency translation needed to extract the desired information. It converts a digitized RF signal centered at 206.5 MHz down to a baseband complex signal centered at zero frequency. In addition to down conversion, DDC‟s typically decimate to a lower sampling rate, allowing follow-on signal processing by lower speed processors. The typical block diagram of DDC is shown in Fig. 5. Tuning Stage
ADC O/P
Data Reduction Stage
DIGITAL MIXER
Tuning in
NCO/DDS
CIC Initial Downsample
Gain Adjustment Stage
CIC Coarse Gain
Additional Data Reduction & signal shaping stage
Polyphase Decimator CFIR
Polyphase Decimator PFIR
(21 tap)
(63 tap)
RESAMPLER & GAIN Block
I Q
DDC IMPLEMENTATION IN XILINX VIRTEX-5 (SX95T)
Fig. 5: Framework of DDC section
DDC block integrates [13]: a) A Direct Digital Synthesizer (DDS)/Numerically Controlled Oscillator (NCO) which generates a complex sinusoid at the intermediate frequency. b) A pair of Mixers that allows translation down to baseband, and c) Chain of multistage multirate filter consisting of Cascaded Integrator Comb (CIC) filter, Compensating FIR (CFIR) and the Programmable FIR (PFIR) filter [14].
Vol 2, No 1 (January 2011) ©IJoAT
77
International Journal of Advancements in Technology http://ijict.org/
ISSN 0976-4860
In the present scheme, the digital outputs from the ADC are delivered into the Xilinx Virtex-5 FPGA for routing, formatting and DDC signal processing application. A First-In First- Out (FIFO) interface (128 K x 74 bits) can be provided in between to gather data from ADC. NCO is the critical component in DDC. It can be implemented in a various ways. Here the NCO design based on Look-Up Table (LUT) is presented as shown in Figure 6 with the design parameters as: LUT Word Size - 16; LUT Address Size - 10; ROM Size - 1024 bytes.
Fig. 6: NCO Simulation result with hardware utilization
The NCO output spectrum is shown in Fig. 7 and the mixer output is shown in Figure 8.
Figure 8: Mixer Output spectrum
Figure 7: NCO Output spectrum
The Transfer Function for a CIC filter at fS is [15]:
(1 z RM ) N RM 1 k H (z) H (z)H (z) z (1 z 1 ) N k 0 N I
(4)
N
N C
For the present scheme, the design specification chosen for CIC filter are given in Table 4. Vol 2, No 1 (January 2011) ©IJoAT
78
International Journal of Advancements in Technology http://ijict.org/
ISSN 0976-4860
Table 4: CIC filter specifications Input Sample Rate Output Sample Rate Decimation Factor (R) Number of CIC Stages (N) Differential Delay (M) Phase Number of Multipliers Number of Adders
72 MSPS 4 MSPS 18 5 1 Linear 0 10
The CIC stage characteristics are shown in Figure 9.
Figure 9: CIC stage characteristics
When there is large number of stages in CIC filter, the frequency response does not possess a flat band character. The magnitude droop occurs in the passband resulting in undesired response. To overcome the magnitude droop, a FIR filter that has an inverse magnitude response of CIC filter is applied to achieve the frequency response correction. These filters are thereby called as CFIR and PFIR filters. For the present scheme, the design specification chosen for CFIR and PFIR filters are given in Table 5. Table 5: CFIR and PFIR stage specifications Parameters Input Sample Rate Output Sample Rate Decimation Factor (R) Filter Length Number of Multipliers Number of Adders
Vol 2, No 1 (January 2011) ©IJoAT
CFIR 4 MSPS 2 MSPS 2 21 21 20
PFIR 2 MSPS 1 MSPS 2 63 63 62
79
International Journal of Advancements in Technology http://ijict.org/
ISSN 0976-4860
The CFIR stage characteristics are shown in Figure 10 and the PFIR stage characteristics are shown in Figure 11.
Figure 10: CFIR stage characteristics
Figure 11: PFIR stage characteristics
Resampler can be used as an additional optional filter to optimize the passband or stopband response of the channel. The overall gain of DDC is the product of the CIC gain, coarse gain, CFIR gain, PFIR gain, final shift gain. Each of these gain are set by Gain Setting block so as to maximize the signal amplitude without clipping.
5. Conclusion The emphasis of this paper is on the direct RF digitization and processing involved in atmospheric Radar application using the latest version of ADC and FPGA available in today‟s Vol 2, No 1 (January 2011) ©IJoAT
80
International Journal of Advancements in Technology http://ijict.org/
ISSN 0976-4860
market. Also, the work has attempted to summarize the major key points and provide particular insights into digital receiver design by taking the advantages of FPGA technology. The simulations for the direct RF digitization at 206.5 MHz and subsequent down conversion and processing were carried out and discussed.
References [1] R. F. Woodman and A. Guillén, “Radar observations of winds and turbulence in the stratosphere and mesosophere”, Journal of the Atmospheric Sciences, vol. 31, 1974, pp. 493-505. [2] U. Mavric, S. Bremec and R. Ursic, “Experience with Sampling of 500 MHz RF Signal for Digital Receiver Applications”, Proceedings of the 6th European Workshop on Beam Diagnostics and Instrumentation for Particle Accelerators (DIPAC 2003), Mainz, Germany, May 2003, pp. 178-180. [3] D. R. Martinez, T. J. Moeller and K. Teitelbaum, “Application of reconfigurable computing to a high performance front-end radar signal processor”, Journal of VLSI Signal Processing, Kluwer Academic Publishers, Netherlands, vol. 28, No. 1-2, 2001, pp. 63-83. [4] T. J. Moeller and D. R. Martinez, “Field programmable gate array based radar front-end digital signal processing”, Proceedings of the 7th Annual IEEE Symposium on Field-Programmable Custom Computing Machines, Napa Valley, CA, April 1999, pp.178-187. [5] J. M. Clerk, “A dynamical theory of the electromagnetic field”, Philosophical Transactions of the Royal Society of London, vol. 155, 1865, pp. 459-512. [6] R. G. Vaughan, N. L. Scott and D. R. White, “The Theory of Bandpass Sampling”, IEEE Transactions on Signal Processing, vol. 39, No. 9, September 1991, pp. 1973-1984. [7] G. Hill, “The benefits of undersampling”, Electronic Design, July 1994, pp.69-79. [8] Linear Technology LTC2209 ADC product documentation, http://cds.linear.com/docs/Datasheet. [9] D. Redmayne, E. Trelewicz and A. Smith, “Understanding the Effect of Clock Jitter on High Speed ADCs”, Linear Technology, Design Note 1013, 2006. [10] G. R. Goslin, “Implement DSP functions in FPGAs to reduce cost and boost performance”, EDN, 1996. [11] R. Hosking, “New FPGAs revolutionize digital down converters”, Proceedings of the SDR ’08, Technical Conference and product Exposition, 2008. [12] Xilinx Virtex-5 FPGA product documentation, http://www.xilinx.com [13] H. Wang, Y. Lu, Y. Wan, W. Tang and C. Wang, “Design of wideband digital receiver”, IEEE International Conference on Communications, Circuits and Systems Proceedings, May 2005, pp. 794-797. [14] E. B. Hogenauer, “An Economical Class of Digital Filters for Decimation and Interpolation'', IEEE. Trans. Acoust., Speech Signal Processing, Vol. 29, No. 2, April 1981, pp. 155-162. [15] G. J. Dolecek and F. Harris, “Design of CIC Compensator Filter in a Digital IF Receiver”, IEEE International Symposium on Communications and Information Technologies, October 2008, pp. 638 643.
Vol 2, No 1 (January 2011) ©IJoAT
81