J. Cent. South Univ. (2014) 21: 593−599 DOI: 10.1007/s1177101419784
Fuzzy least squares support vector machine soft measurement model based on adaptive mutative scale chaos immune algorithm WANG Taosheng(王涛生) 1, 2 , ZUO Hongyan(左红艳) 1, 3 1. Research Center of Engineering Technology for Engineering Vehicle Chassis Manufacturing of Hunan Province, Changsha 410205, China; 2. Research Base of Multinational Investment and Operations in Hunan Province, Changsha 410205, China; 3. School of Resource and Safety Engineering, Central South University, Changsha 410083, China © Central South University Press and SpringerVerlag Berlin Heidelberg 2014 Abstract: In order to enhance measuring precision of the real complex electromechanical system, complex industrial system and complex ecological & management system with characteristics of multivariable, nonliner, strong coupling and large timedelay, in terms of the fuzzy character of this real complex system, a fuzzy least squares support vector machine (FLS−SVM) soft measurement model was established and its parameters were optimized by using adaptive mutative scale chaos immune algorithm. The simulation results reveal that fuzzy least squares support vector machines soft measurement model is of better approximation accuracy and robustness. And application results show that the relative errors of the soft measurement model are less than 3.34%. Key words: chaos; immune algorithm; fuzzy; support vector machine
1 Introduction It is known that measuring a lot of important process parameters is difficult in the real complex electromechanical system, complex industrial system and complex ecological & management system with characteristics of multivariable, nonliner, strong coupling, and large timedelay due to the process and technical limitations. So far, research on measuring the properties of the key parameters indirectly has long been the concern of the scholars [1−5] and some soft measurement methods [6−10] such as mechanism modeling, estimation modeling based on the state, regression analysis modeling, artificial neural network modeling, fuzzy modeling and hybrid modeling were proposed and used in the real complex electromechanical system, complex industrial system and complex ecological & management system, and research achievements are encouraging. But the applications of soft measurement methods are obviously inadequate. Firstly, most researches are from former three modeling methods. As for complex industry system, the properties of the key parameters are not obviously linked with the key parameters, the properties are likely to be caused by other reasons except key parameters, so the soft
measurement method seems to be too rough and the corresponding results are inevitably too general. Secondly, although the latter three modeling methods try to establish the properties model linked with the key parameters on black box method macroscopically, but it is difficult to get lots of data about the key parameters from complex industry system. Therefore, the properties of the model do not reflect the true state of the properties of the key parameters. Fuzzy support vector machine (FSVM) [11−16] has a unique advantage in solving such problems, so this work makes use of adaptive mutative scale chaos immune algorithm to optimize the fuzzy least squares support vector machine (fuzzy LSSVM) parameters and establishes a fuzzy least squares support vector machine soft measurement model, which provides strong theoretical and technical support for the fast and efficient measurement analysis on the real complex electromechanical system, complex industrial system and complex ecological & management system with characteristics of multivariable, nonlinear, strong coupling and large timedelay.
1 Model establishment 1.1 Fuzzy LSSVM Based on fuzzy LSSVM, the input fuzzy samples
Foundation item: Project(51176045) supported by the National Natural Science Foundation of China; Project(2011ZK2032) supported by the Major Soft Science Program of Science and Technology Ministry of Hunan Province, China Received date: 2012−09−13; Accepted date: 2013−01−10 Corresponding author: WANG Taosheng, Professor; Tel: +86−18974977798; Email:
[email protected]
594
J. Cent. South Univ. (2014) 21: 593−599
of soft measurement for the real complex industry system are as follows: (x1, y1, μ(x1)), (x2, y2, μ(x2)), …, (xk, yk, μ(xk)), k=1, 2, … , n, where μ(xk) is the membership function, 00, i=1, 2, …, l where b is threshold value. The corresponding Lagrange function is l
L = J - å ai [ w T × j ( xi ) + e i + b - yi ] i=1, 2, …, l (2) i =1
Thus, the fuzzy LSSVM optimization problem is translated into solution of linear equation: é 0 ù é b ù é 0 ù E T ê úê ú=ê ú êë E W + C × m ( xi ) -1 l úû ë a û ë y û T
1.2 Determination of fuzzy LSSVM’s membership At present, the determination of membership function still depends on experience and feedback from field practice. For this reason, the distribution function shown in Eq. (5) is used as the membership function of fuzzy LSSVM to fuzz. ì0 ( X i £ X i , min ) ï ï X i - X i , min mi = í ( X i, min < X i £ X i , max ) ï X i , max - X i , min ï1 ( X > X i i , max ) î i=1, 2, …10
F (C , s ) =
(4)
i =1
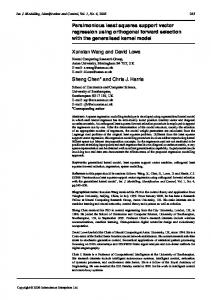
where K(xi, x)=φ(xi)·φ(x) is called kernel function, which is the dot product of any symmetrical kernel function satisfying Mercer condition corresponding to characteristic space. The soft measurement network of fuzzy least squares support vector machines is shown in Fig. 1.
1 n
i =1
where yi is the expecting output, f(xi ) is the practical output, e is a tiny real number, i.e. 1×10 −3 , which is used to avoid the circumstance that denominator is zero. The error function of mean square error (fMSE) is defined as the evaluation index of LSSVM generalization performance [16]: f MSE =
1 m å [ f ( xi ) - y i ] 2 M i =1
(7)
where f(xi ) is the practical output, yi is the expecting output. The detailed procedures that LSSVM parameter were optimized using selfadaptive variable metric chaos immune algorithm [17] is expressed as follows. Step 1: Input antigen {Ag} and conduct standardization. And generate the chaos variables of N initializing antigens {Ab} between (0, 1) at random by using of Eq. (8) as chaos model. ì x n + 1 = sin( 2 / x n ) í î- 1 £ x n £ 1 x n ¹ 0
Fig. 1 Soft measurement network of fuzzy least squares support vector machines
(6)
å [ yi - f ( xi )] 2 + e
T
l
(5)
1.3 Adaptive mutative scale chaos immune algorithm The LSSVM parameters, regularization parameter C and kernel parameter σ, are optimized by selfadaptive variable metric chaos immune algorithm. In view of the fact that the key of selfadaptive variable metric chaos immune algorithm is to determine fitness function, the function is chosen as
(3)
where y=[y1, y2, …, yl] ; E=[1, 1, …, l] ; a=[a1, a2, …, al] T ; Ωij=φ(xi)·φ(xj)=K(xi, xj). Thus, fuzzy least squares support vector machines soft measurement model is expressed as y ( x ) = å ai K ( xi , x ) + b
When fuzzy LSSVM is used to conduct soft measurement of the real complex industry system, the selection of regularization parameter C and kernel parameter σ is a key issue.
(8)
Step 2: Operation for each antigen Agi is as follows: Step2.1: Equation (9) is used to calculate the appetency aij between each antibody Abi and each antigen
J. Cent. South Univ. (2014) 21: 593−599
595 m
Agi: n
aij =
æ K - 1 ö ÷ è K ø
b i = 1 - ç 2
å ( Abik - Ag jk )
(9)
k =1
Step 2.2: m antibodies of the highest appetency are chosen as network cells; Step 2.3: Conduct clone operation for m chosen network cells. The higher the appetency of network cell is, the more the number of clone Nc is; Step 2.4: Conduct mutation operation for the cloned cell by application function C=C−α(C−X), where C is cloning antibody cell, X is cloning antigen cell, α is aberration rate; Step 2.5: Recalculate the appetency of C after mutation operation; Step 2.6: Choose ξ(%) with highest appetency as dataset of partial memory cells Mp; Step 2.7: Equation (10) is used to calculate the similarity sij between each antibody Abi and each antibody Abj, and individual with similarity sij larger than threshold value σs is eliminated;
(14)
where m is an integer depending on target function (in this work it is defined as 2), and K is the number of iterations (in this work it is the number of evolving generation). And eliminate individuals of top 10% adaptive value in the memory bank with similarity larger than σs. Step 5: Equation (8) is chosen to generate N individuals between (0, 1), which will be taken as antibody for immune calculation of next generation together with the memory dataset M of last immune calculation, to replace individuals with lower appetency, and return to Step 2 until network convergence is reached. The algorithm end condition is that the number of iterations exceeds the given number of maximum evolving generation, or both the average distance between immune network cells of adjacent generations and the size of network do not change or the change is small enough.
n
s ij =
å ( Ab ik - Ab jk ) 2
(10)
k =1
Step 3: Consolidate Mp with the obtained memory dataset M. Step 4: Proceed chaos fine search for superior individuals. Individuals with adaptive value of top 10% in the memory bank are chosen for chaos fine search. Suppose superior individuals are X=(X1, X2, … , Xk), the constriction of chaos variable region of search is represented as ìai¢ = X i - f (bi - a i ) í î bi¢ = X i + f (bi - ai )
(11)
where φ is the constriction factor, φ∈(0, 0.5). To ensure that the new region does not exceed the boundaries, it is disposed as follows: if ai ¢ < a i then ai ¢ = a i ; if bi ¢ > b i then bi ¢ = b i . Therefore, vector Yi that is reductively treated from Xi into the new region [ ai ¢, b i ¢ ] is determined by Y i =
X i - a i ¢ bi¢ - ai ¢
(12)
Take the linear combination of Yi and Xi, n+1 as the new chaos variable, and search with this chaos variable. X i¢,n +1 = (1 - bi ) Y i + bi X i ,n +1
(13)
where βi is selfadaptive accommodation coefficient, and 0<βi<1. The selfadaptive accommodation coefficient βi is selfadaptively determined by
1.4 Simulation Consider nonlinear object modeling expressed as y=8sin(πx1x2)+25(x3−0.5)+3x4+7x5
(15)
where x1, x2, x3, x4 and x5 are uniform distribution data belonging to [0, 1]. Two hundred samples were produced by using Eq. (15) and the former one hundred training samples were taken as a training sample set S1, the latter one hundred training samples were taken as a measuring sample set S2. Taking root mean square error Rmse and maximum absolute error Emax as index parameters for measuring the performance of the soft measurement model, the training sample set S1 and the measuring sample set S2 were used to test training properties and measuring properties of fuzzy least squares support vector machines soft measurement model of this work and soft measurement models such these in Refs. [12−13, 18], and the comparative results from the four soft measurement models are listed in Table 1. Obviously, fuzzy least squares support vector Table 1 Comparative results of test training properties and measuring properties Rmse
Model
Emax
S1
S2
S1
S2
Ref. [12]
0.1794
0.2523
0.4512
0.6355
Ref. [13]
0.1346
0.2365
0.4332
0.5982
Ref. [18]
0.1253
0.2221
0.3829
0.5513
This work
0.1012
0.2023
0.3316
0.5127
596
machines soft measurement model in the work is of better approximation accuracy and robustness than other three soft measurement models.
2 Application 2.1 Principles of soft measurement of export product quality for electrical and mechanical The observable price zone of export product is subjected to dirty price, which is mutually influenced by quality factor and other factors, and clean price, which is only influenced by other factors while quality factor is rejected. Dirty price index could be decomposed into quality index and clean price index, relating to the unit price of the export product, the number of export product categories and the demand for export. While clean price index is influenced to a large extent by the unit price of export product, quality index, net trade volume, and corresponding GDP. Therefore, it is hard to describe the relation between such influencing factors and electrical and mechanical export product quality index using accurate mathematical model through mechanism analysis. It is indicated by the study on electrical and mechanical export product quality index that electrical and mechanical export product quality index could represent as the variation of parameters such as the unit price of export product, the number of export product categories, the demand for export, net trade volume, and corresponding GDP in the same year. In consideration of the fact that data of unit price of export product, the number of export product categories and the demand for export are hard to obtain and export value and import value were replaced. For this purpose, the soft measurement model of electrical and mechanical export product quality based on fuzzy LSSVM is proposed. The soft measuring method of electrical and mechanical export product quality is estimated. The soft measurement diagram of electrical and mechanical export product quality is shown in Fig. 2.
Fig. 2 Soft measurement diagram of electrical and mechanical export product quality index
Combining the knowledge of fuzzy LSSVM, it is known that fuzzy LSSVM inputs are export value x1, import value x2, net trade volume x3, and GDP x4, whereas only one output exists, which is electrical and
J. Cent. South Univ. (2014) 21: 593−599
mechanical export product quality index defined as λ. The basic idea is as follows: Characteristic parameters such as export value x1, import value x2, net trade volume x3, and GDP x4 are taken as supplementary variables; electrical and mechanical export product quality index λ is taken as leading variable; According to the character of fuzzy LSSVM that it can sufficiently approach any nonlinear relation, we then establish a blackbox model from supplementary variables to the leading variable, so that the mapping from dirty price and clean price index to electrical and mechanical export product quality index λ is represented. In the first place, the learning sample of the supplementary variables, i.e., unit price of export product x1, the number of export product categories x2, demand x3, net trade volume x4 and learning teacher (electrical and mechanical export product quality index λ) are collected. Then, the learning method with teacher is used to conduct offline training on soft measurement model of fuzzy LSSVM according to the learning rule of error correction. Finally, the trained soft measurement model is applied to practical soft measurements. 2.2 Index parameter data acquisition of soft measurement model of export product quality for electrical and mechanical With the help of the US import data of US Census Bureau and China Statistical Yearbook data, we assume the United States as the reference country, of which import price and quantity are representatives of countries’ export price and quantity to other markets, and obtain parameter data information of export product value x1, imports product value x2, net trade value x3, GDP value x4 under China’s SITC7 departments, as presented in Table 2. By using the data, soft measurement of electrical and mechanical export product quality coefficient are analyzed in this work. 2.3 Soft measurement analysis of electrical and mechanical export product quality As shown in Table 2, this work regards data of export product value x1, import product value x2, net trade value x3, GDP value x4, electrical and mechanical export product quality coefficient yi from the year of 1990 to 2010 as the training sample set, and data of that from 2007 to 2010 as the test sample for soft measurement analysis of export product quality for electrical and mechanical data. Through fuzzification, data of export product fuzzy value μx1, import product fuzzy value μx2, net trade fuzzy value μx3, GDP fuzzy value μx4 and electrical and mechanical export product quality fuzzy coefficient μyi from 1990 to 2006 are shown in Table 3, and data from 2007 to 2010 are shown in Table 4.
J. Cent. South Univ. (2014) 21: 593−599
597
Table 2 Index parameter of soft measurement model of export product quality for electrical and mechanical Year
x1/ x2/ x3/ x4/ 10 10 US$ 10 10 US $ 10 10 US $ 10 10 US $
lnyi
Table 4 Index parameter based on fuzzification from 2007 to 2010 Year
μx1
μx1
μx3
μx4
2007
0.0000
0.0319
0.7015
0.0000
1990
10.83
21.53
−10.68
390.28
−3.862
2008
1.0000
1.0000
0.5119
0.3671
1991
13.91
25.66
−11.76
409.17
−3.361
2009
0.2912
0.0000
1.0000
0.6368
1992
13.20
30.76
−17.56
488.22
−2.860
2010
0.2470
0.8421
0.000
1.0000
1993
15.26
44.55
−29.29
613.22
−2.359
1994
21.89
51.47
−29.57
559.23
−1.858
1995
31.41
52.64
−21.24
727.95
−1.357
1996
35.31
54.76
−19.45
856.00
−0.856
1997
43.71
52.77
−9.07
952.65
−0.355
1998
50.22
56.84
−6.63
1019.48
0.146
1999
58.84
69.45
−10.62
1083.29
0.647
2000
82.60
91.93
−9.33
1198.48
1.148
2001
94.90
107.02
−12.11
1324.81
1.649
2002
126.98
137.01
−10.03
1453.83
2.150
2003
187.77
192.83
−5.05
1640.96
2.651
2004
268.26
252.83
15.43
1931.65
3.151
2005
352.23
290.48
61.76
2235.75
3.652
2006
456.34
357.02
99.32
2657.84
4.153
2007
557.05
398.98
158.10
3290.97
—
2008
677.72
545.55
132.76
4300.20
—
2009
592.19
394.15
198.00
5041.83
—
2010
586.86
521.65
64.35
6040.48
—
Table 3 Index parameter based on fuzzification from 1990 to 2006 Year
μx1
μx1
μx3
μx4
lnμyi
1990
0.0000
0.0000
0.1466
0.0000
0.0000
1991
0.0069
0.0123
0.1382
0.0083
0.0625
1992
0.0053
0.0275
0.0932
0.0432
0.1250
1993
0.0099
0.0686
0.0022
0.0983
0.1875
1994
0.0248
0.0892
0.0000
0.0745
0.2500
1995
0.0462
0.0927
0.0646
0.1489
0.3125
1996
0.0549
0.0990
0.0785
0.2054
0.3750
1997
0.0738
0.0931
0.1591
0.2480
0.4376
1998
0.0884
0.1052
0.1780
0.2775
0.5001
1999
0.1078
0.1428
0.1470
0.3056
0.5626
2000
0.1611
0.2098
0.1570
0.3564
0.6251
2001
0.1887
0.2548
0.1355
0.4121
0.6876
2002
0.2607
0.3442
0.1516
0.4690
0.7501
2003
0.3972
0.5106
0.1902
0.5516
0.8126
2004
0.5778
0.6894
0.3491
0.6797
0.8750
2005
0.7663
0.8017
0.7086
0.8139
0.9375
2006
1.0000
1.0000
1.0000
1.0000
1.0000
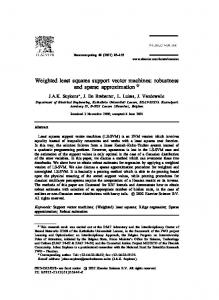
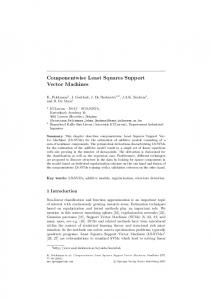
According to membership and fuzzy feature of electrical and mechanical export product quality coefficient shown in Table 3, electrical and mechanical export product quality coefficients lnμyi (i=1, 2, … , 17) are regarded as the output of fuzzy training points of fuzzy least squares support vector machines, and data of export product fuzzy value μx1, import product fuzzy value μx2, net trade fuzzy value μx3, GDP fuzzy value μx4 from 1990 to 2006 are regarded as the output of fuzzy training points. By means of established soft measurement model of electrical and mechanical export product quality based on fuzzy least squares support vector machine, the relative error η between soft measured value and actual value of electrical and mechanical export product quality from 1990 to 2006 can be obtained and shown in Table 4, and its absolute value is less than 3.34%, with higher prediction accuracy. Consider the partial derivatives ai of output component to input component of fuzzy least squares support vector machines as parameter index which is a criterion for its influence degree on soft measurement value of export product quality for electrical and mechanical. The greater the value of partial derivatives is, the more remarkable the effect of the factor is. And calculating results of the weight coefficients of each indicator parameter to soft measurement of electrical and mechanical export product quality are presented in Fig. 4 below. From Fig. 4, a1 is more than a3, a3 is more than a2, and a2 is more than a4. Visibly, the higher influence degree on the soft measurement of electrical and
Fig. 3 Relative errors between soft measurement value and actual value of electrical and mechanical export product quality
598
Fig. 4 Weight coefficient of influence degree on soft measurement of electrical and mechanical export product quality
mechanical export product quality is export product value x1, net trade value x3, import product value x2, GDP value x4 in accordance with the order. To judge the weight coefficients of influence degree correctly is one of keys to an accurate analysis of comprehensive influence degree. According to membership and fuzz feature of electrical and mechanical export product quality coefficient listed in Table 3, electrical and mechanical export product quality coefficients lnμyi (i=1, 2, …, 17) are regarded as the output of fuzzy training points of fuzzy least squares support vector machines, and data of export product fuzzy value μx1, import product fuzzy value μx2, net trade fuzzy value μx3, GDP fuzzy value μx4 under China’s SITC7 departments from 2007 to 2010 are regarded as the input of fuzzy training points. With the help of the established soft measurement model of electrical and mechanical export product quality based on fuzzy least squares support vector machine, we can get soft measurement of electrical and mechanical export product quality from 2007 to 2010, which is presented in Fig. 5. From the example of soft measurement of electrical
J. Cent. South Univ. (2014) 21: 593−599
and mechanical export product quality from 1990 to 2010, it is very obvious that fuzzy least squares support vector machines has a lot of advantages of very clear theoretical basis and good result in the application. Furthermore, its learning ability can be qualified for the task of linear systems identification. In identifying, it can select the structure and complexity of the model automatically according to the training data and control model accuracy and generalization. Theoretically, it can guarantee the correctness of the model without the need to be validated and has great potential for dynamic system identification. All in all, it has provided an effective solution for soft measurement of export product quality for electrical and mechanical. 2.3 Comparison of results with other soft measurement models Some soft measurement models such as Refs. [12−13, 15] and proposed method in this work were used to softly measure by using data listed in Table 3, and the relative errors from different export product qualities for electrical and mechanical can be expressed as Table 5. Table 5 Relative errors comparison with soft measurement value from different electrical and mechanical export product qualities Network type
Average relative error/%
Maximum relative error/%
Ref. [12]
3.15
6.75
Ref. [13]
2.48
6.06
Ref. [15]
2.28
5.34
This work
0.98
3.34
As listed in Table 4, compared with other soft measurement models, the soft measurement model of electrical and mechanical export product quality based on fuzzy least squares support vector machines (FLSSVM) whose parameters are optimized self adaptive variable metric chaos immune algorithm is of high precision. The main reason can be expressed as follows: after selfadaptive variable metric chaos immune algorithm is used to optimize parameters of fuzzy least squares support vector machines, complexity of the soft measurement model is diminished greatly and over fitting for soft measurement model is reduced, therefore, its generalization ability is enhanced and relative errors is reduced accordingly.
3 Conclusions Fig. 5 Soft measurement value of electrical and mechanical export product quality from 2007 to 2010
1) In terms of the fuzzy character of soft measurement data of export product quality for electrical
J. Cent. South Univ. (2014) 21: 593−599
and mechanical, the soft measurement model of electrical and mechanical export product quality which is based on FLSSVM is established. And selfadaptive variable metric chaos immune algorithm is used to optimize the parameters in FLSSVM. Electrical and mechanical export product data of export value x1, import value x2, net trade volume x3, GDP x4 and electrical and mechanical export product quality coefficient yi show that the warning relative error of FLSSVM based on chaos immune algorithm is less than 3.34%, indicating a relative high prediction accuracy. 2) The factors which have major influence on soft measurement of electrical and mechanical export product quality are export value, net trade volume, import value, and GDP successively.
599
[7]
[8]
[9]
[10]
[11] [12]
References [1]
[2]
[3]
[4]
[5]
[6]
YANG S H, WANG X Z, MCGREAVY C. Soft sensor based predictive control of industrial fluid catalytic cracking processes [J]. Chemical Engineering Research & Design, Transactions of the Institute of Chemical Engineers, 1998, 76(5): 499−508. DEMIRLI K, CHENG S X, MUTHUKUMARAN P. Subtractive clustering based modeling of job sequencing with parametric search [J]. Fuzzy Sets and Systems, 2003, 137: 235−270. LÜ J, CHEN G. A timevarying complex dynamical network models and its controlled synchronization criteria [J]. IEEE Transactions on Automatic Control, 2005, 50(6): 841−846. ZHOU J, LU J, LÜ J. Adaptive synchronization of an uncertain complex dynamical network [J]. IEEE Transactions on Automatic Control, 2006, 51(4): 652−656. LÜ J, CHEN G, YU X, LEUNG H. Design and analysis of multiscroll chaotic attractors from saturated function series [J]. IEEE Transactions on Circuits and Systems I, 2004, 51(12): 2476−2490. YAN W W, SHAO H H., WANG X F. Soft sensing modeling based
[13] [14]
[15]
[16] [17]
[18]
on support vector machine and bayesian model selection [J]. Computers & Chemical Engineering, 2004, 28(10): 1489−1498. LIU Ruilan, MOU Shengjing, SU Hongye, CHU Jian. Modeling soft sensor based on support vector machine and particle swarm optimization algorithms [J]. Control Theory and Applications, 2006, 23(6): 895−900. (in Chinese) WANG Huazhong, YU Jinshou. Studies on modeling using mixtures of kernels partial least squares and its application to soft sensing [J]. Computer and Applied Chemistry, 2007, 24 (2): 239−242. CHANG Yuqing, ZHOU Wei. Research on soft sensing method based on support vector machines [J]. Control and Decision, 2007, 24(2): 239−242. CHEN Wenjie, WANG Jing. Application of support vector machine in industrial process [J]. Computers and Applied Chemistry, 2005, 22(3): 195−200. LIN C F, WANG S D. Fuzzy support vector machines [J]. IEEE Transactions on Neural Networks, 2002, 13(2): 464−471. LIN C F, WANG S D. Training algorithms for fuzzy support vector machines with noisy data [J]. Pattern Recognition Letters, 2004, 25: 1647−1656. JIANG X F, YI Z, LV JC. Fuzzy SVM with a new fuzzy membership function [J]. Neural Computing and Application, 2006, 15: 268−276. LESKI J M. An epsiv margin nonlinear classifier based on fuzzy ifthen rules [J]. IEEE Transactions on Systems, Man, and Cybernetics, Part B: Cybernetics, 2004, 34(1): 68−76. WANG Y Q, WANG S Y, LAIK K. A new fuzzy support vector machine to evaluate credit risk [J]. IEEE Transactions on Fuzzy Systems, 2005, 13(6): 820−831. E Jiaqiang. Intelligent fault diagnosis and its application [M]. Changsha: Hunan University Press, 2006. YANG Haidong, E Jiaqiang. An adaptive chaos immune optimization algorithm with mutative scale and its application [J]. Control Theory & Applications, 2009, 26(10): 1069−1074. E Jiaqiang, LI Yuqiang, GONG Jinke. Function chain neural network prediction on heat transfer performance of oscillating heat pipe based on grey relational analysis [J]. Journal of Central South University of Technology, 2011, 18(5): 1733−1737. (Edited by DENG Lüxiang)